Upgrade to Pro — share decks privately, control downloads, hide ads and more …

MongoDB Performance Tuning

MongoDB Performance Tuning

MongoSV 2012
Kenny Gorman
Founder, ObjectRocket

Avatar for Kenny Gorman

Kenny Gorman

December 04, 2012
Tweet

More Decks by Kenny Gorman

Other Decks in Technology

Transcript

  1. MongoDB performance tuning Obsession • Performance planning • Order matters:

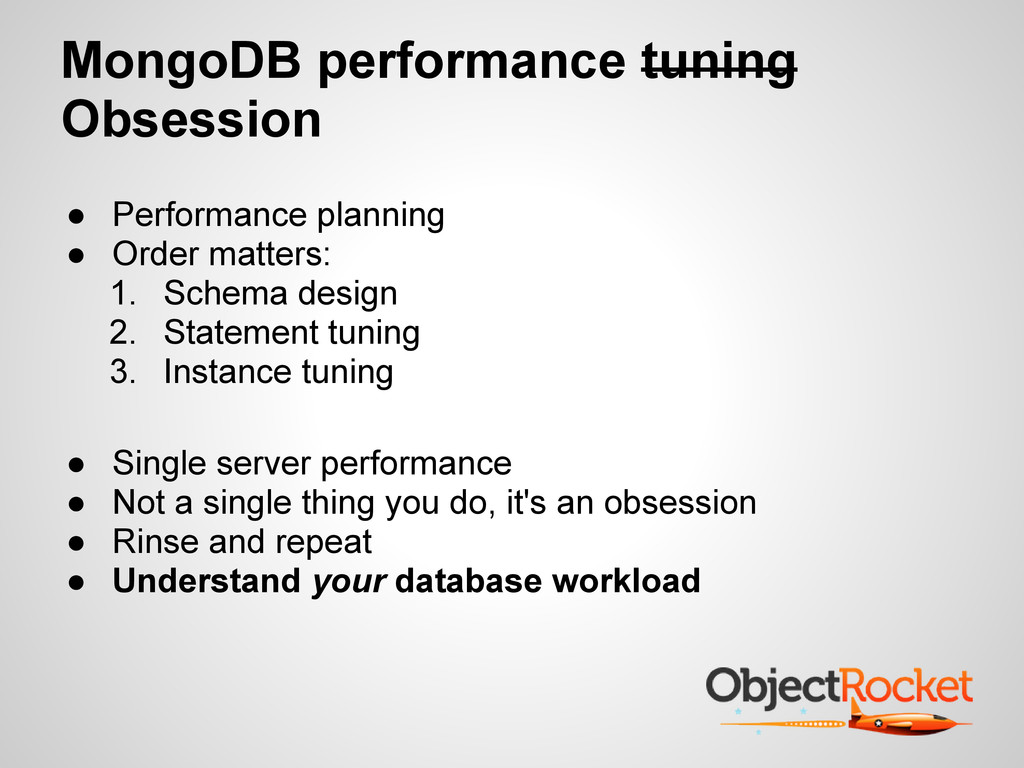
    1. Schema design 2. Statement tuning 3. Instance tuning • Single server performance • Not a single thing you do, it's an obsession • Rinse and repeat • Understand your database workload
  2. Statement Tuning • Profiler ◦ Tuning tool/process to capture statements

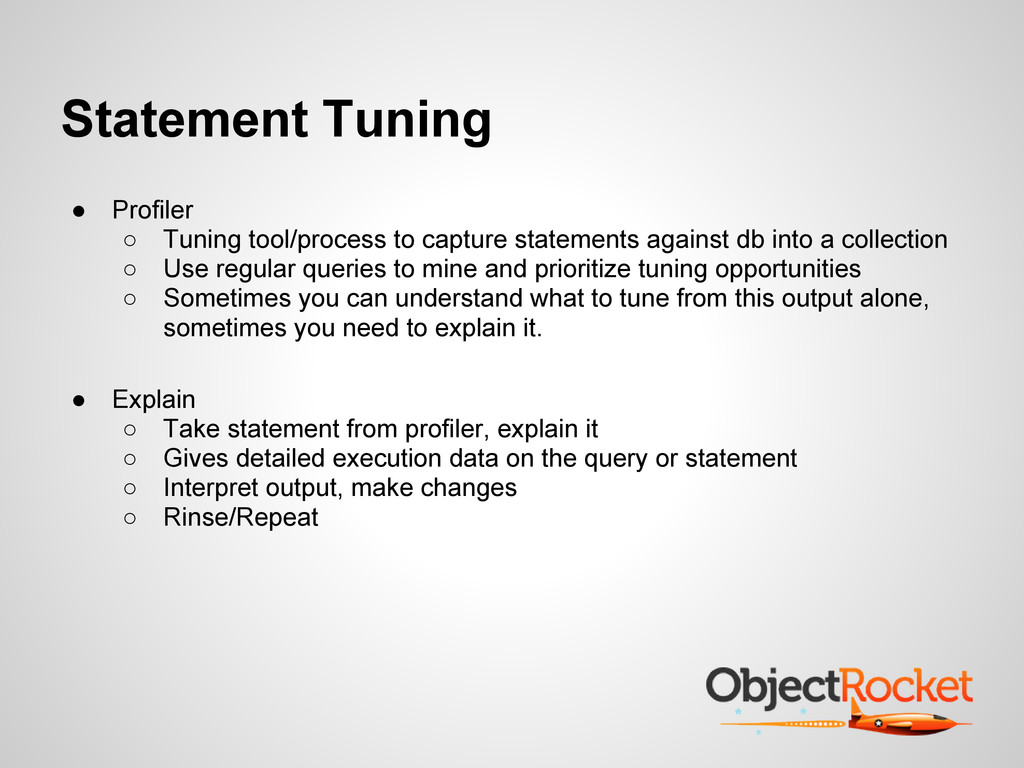
    against db into a collection ◦ Use regular queries to mine and prioritize tuning opportunities ◦ Sometimes you can understand what to tune from this output alone, sometimes you need to explain it. • Explain ◦ Take statement from profiler, explain it ◦ Gives detailed execution data on the query or statement ◦ Interpret output, make changes ◦ Rinse/Repeat
  3. The MongoDB Profiler • Data is saved in capped collections,

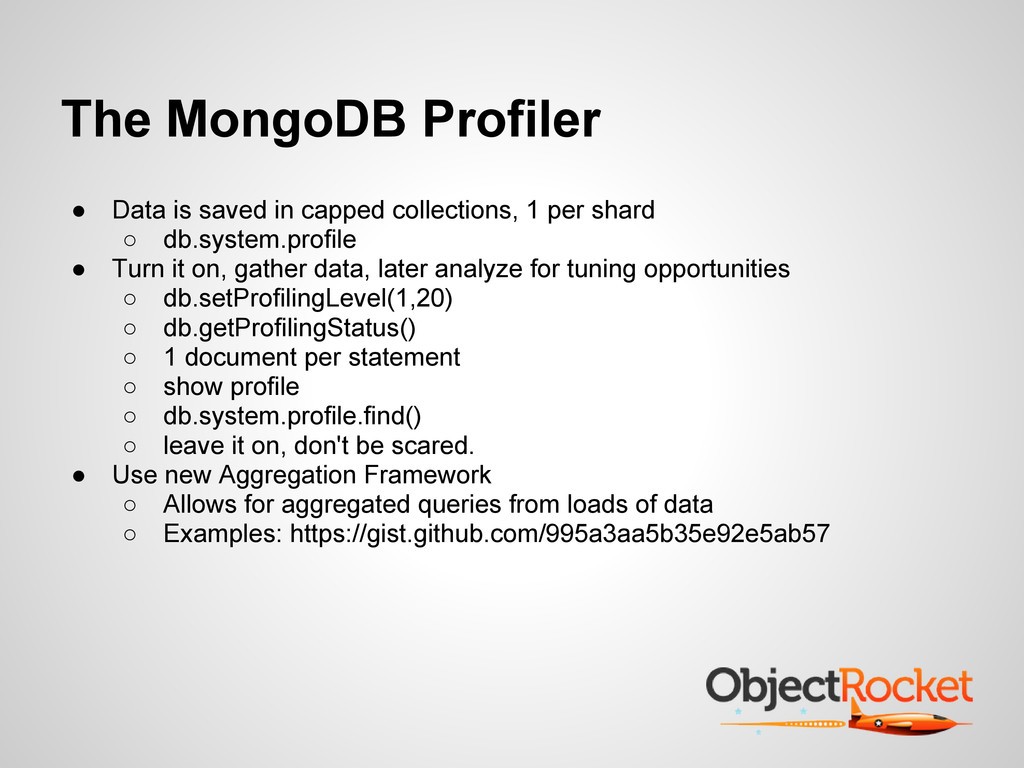
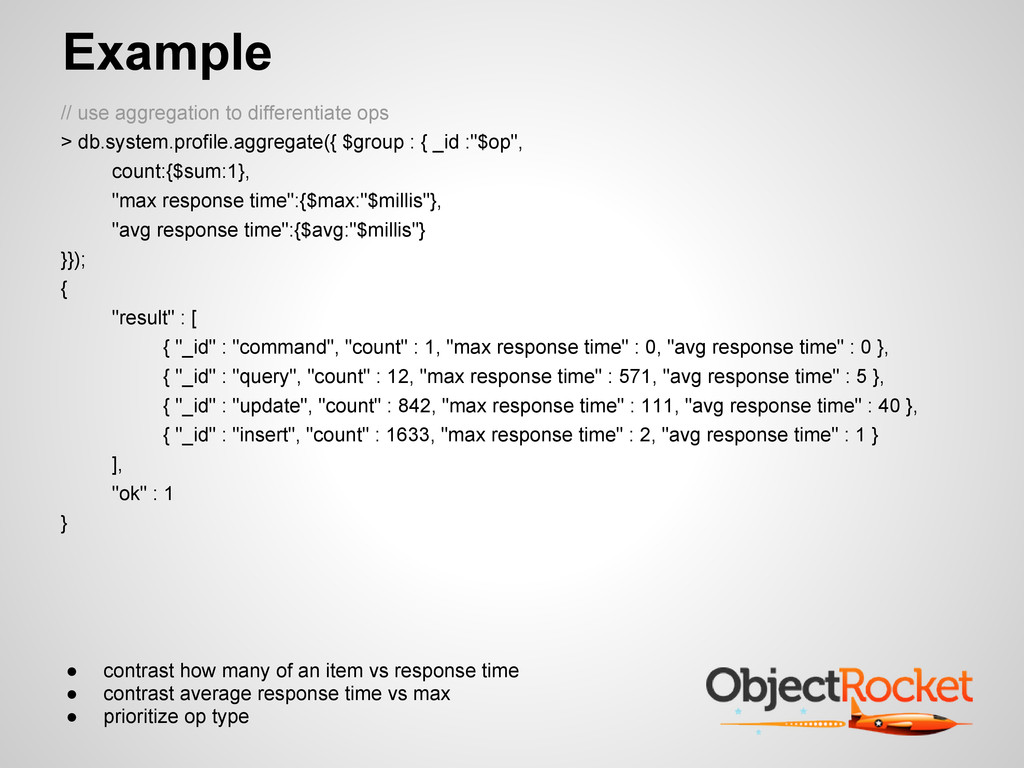
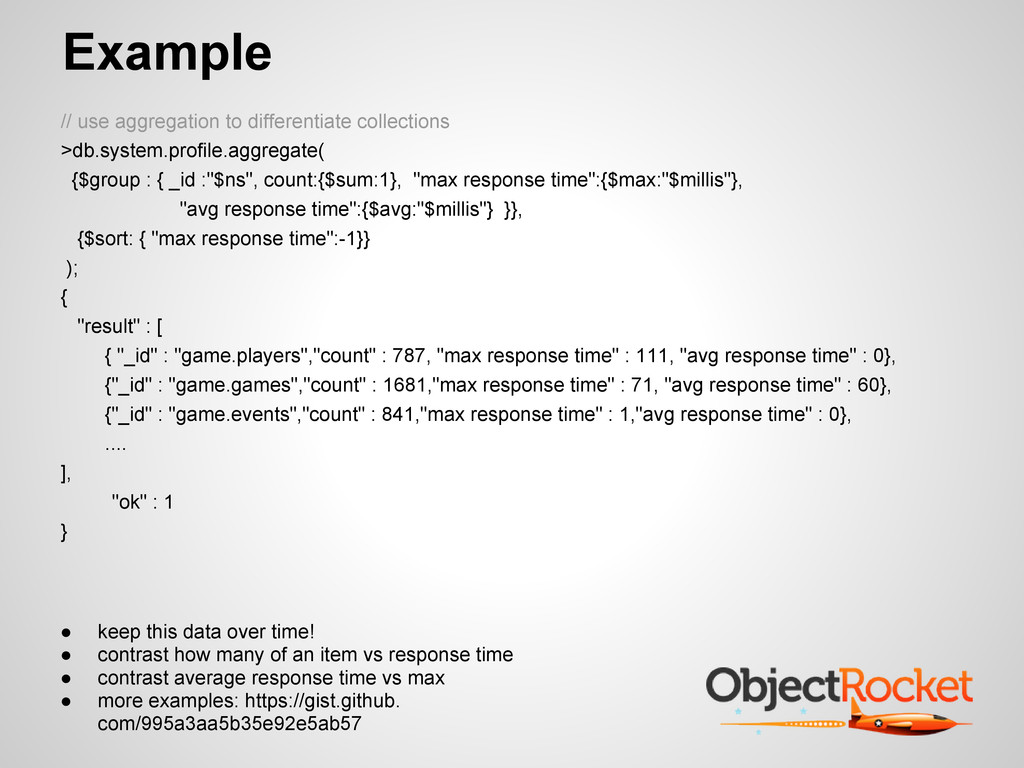
    1 per shard ◦ db.system.profile • Turn it on, gather data, later analyze for tuning opportunities ◦ db.setProfilingLevel(1,20) ◦ db.getProfilingStatus() ◦ 1 document per statement ◦ show profile ◦ db.system.profile.find() ◦ leave it on, don't be scared. • Use new Aggregation Framework ◦ Allows for aggregated queries from loads of data ◦ Examples: https://gist.github.com/995a3aa5b35e92e5ab57
  4. // simple profiler queries // slowest > db.system.profile.find({"millis":{$gt:20}}) // in

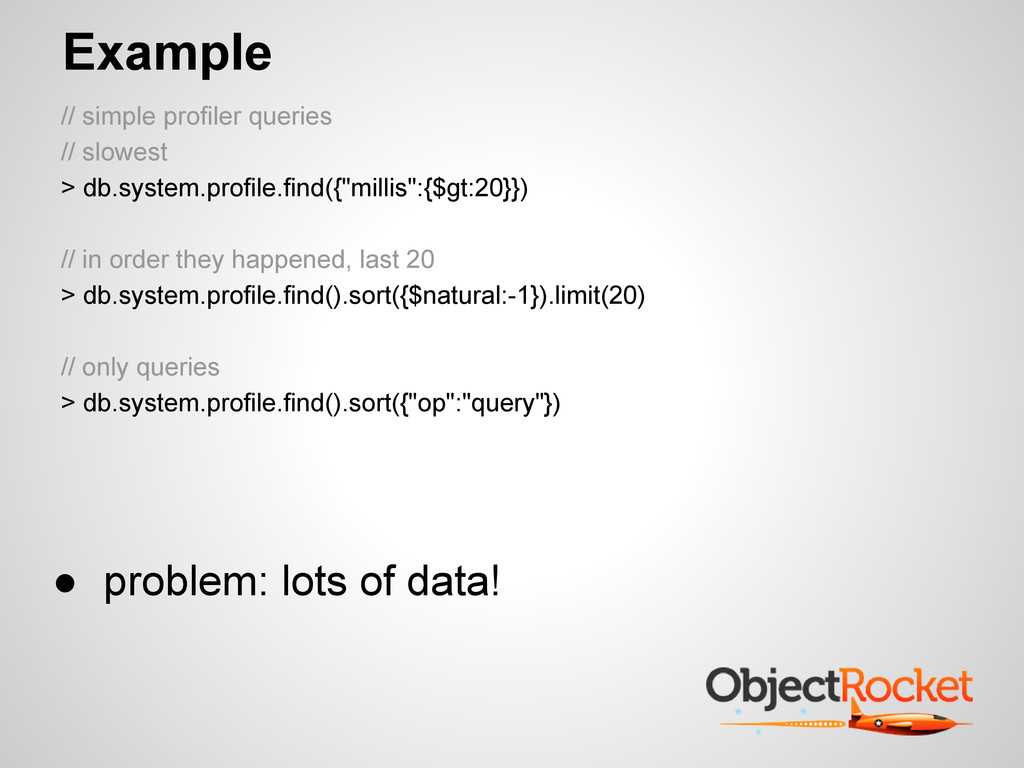
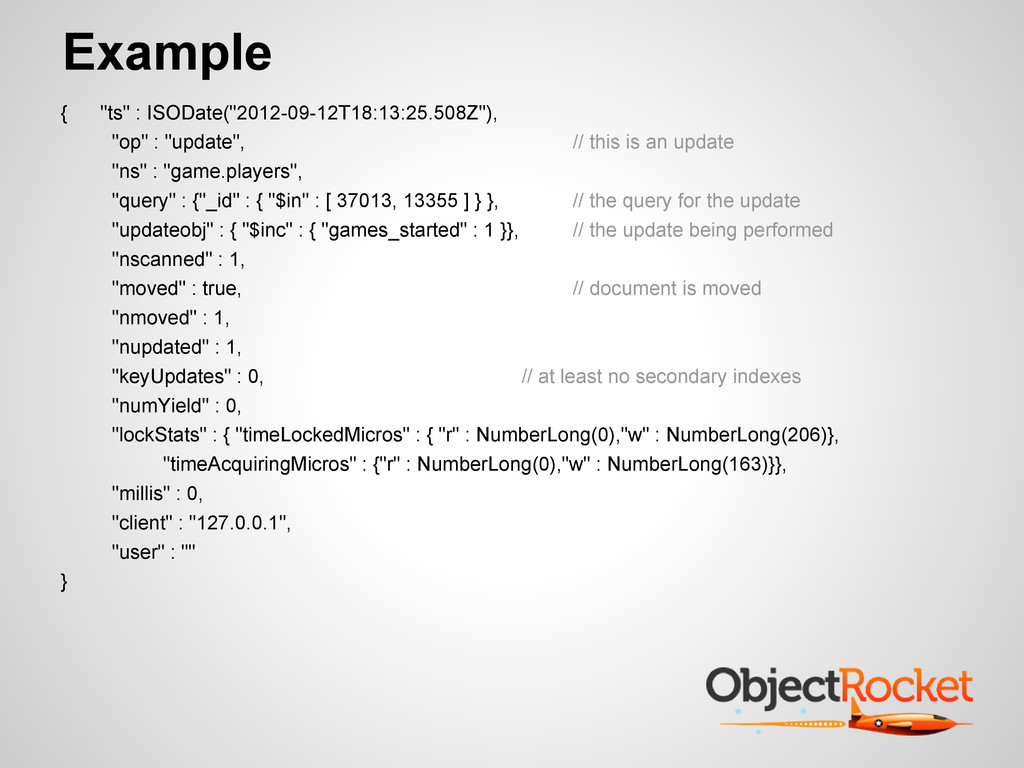
    order they happened, last 20 > db.system.profile.find().sort({$natural:-1}).limit(20) // only queries > db.system.profile.find().sort({"op":"query"}) Example • problem: lots of data!
  5. // use aggregation to differentiate ops > db.system.profile.aggregate({ $group :

    { _id :"$op", count:{$sum:1}, "max response time":{$max:"$millis"}, "avg response time":{$avg:"$millis"} }}); { "result" : [ { "_id" : "command", "count" : 1, "max response time" : 0, "avg response time" : 0 }, { "_id" : "query", "count" : 12, "max response time" : 571, "avg response time" : 5 }, { "_id" : "update", "count" : 842, "max response time" : 111, "avg response time" : 40 }, { "_id" : "insert", "count" : 1633, "max response time" : 2, "avg response time" : 1 } ], "ok" : 1 } Example • contrast how many of an item vs response time • contrast average response time vs max • prioritize op type
  6. // use aggregation to differentiate collections >db.system.profile.aggregate( {$group : {

    _id :"$ns", count:{$sum:1}, "max response time":{$max:"$millis"}, "avg response time":{$avg:"$millis"} }}, {$sort: { "max response time":-1}} ); { "result" : [ { "_id" : "game.players","count" : 787, "max response time" : 111, "avg response time" : 0}, {"_id" : "game.games","count" : 1681,"max response time" : 71, "avg response time" : 60}, {"_id" : "game.events","count" : 841,"max response time" : 1,"avg response time" : 0}, .... ], "ok" : 1 } Example • keep this data over time! • contrast how many of an item vs response time • contrast average response time vs max • more examples: https://gist.github. com/995a3aa5b35e92e5ab57
  7. Profiler Attributes • fastMod ◦ Good! Fastest possible update. In-place

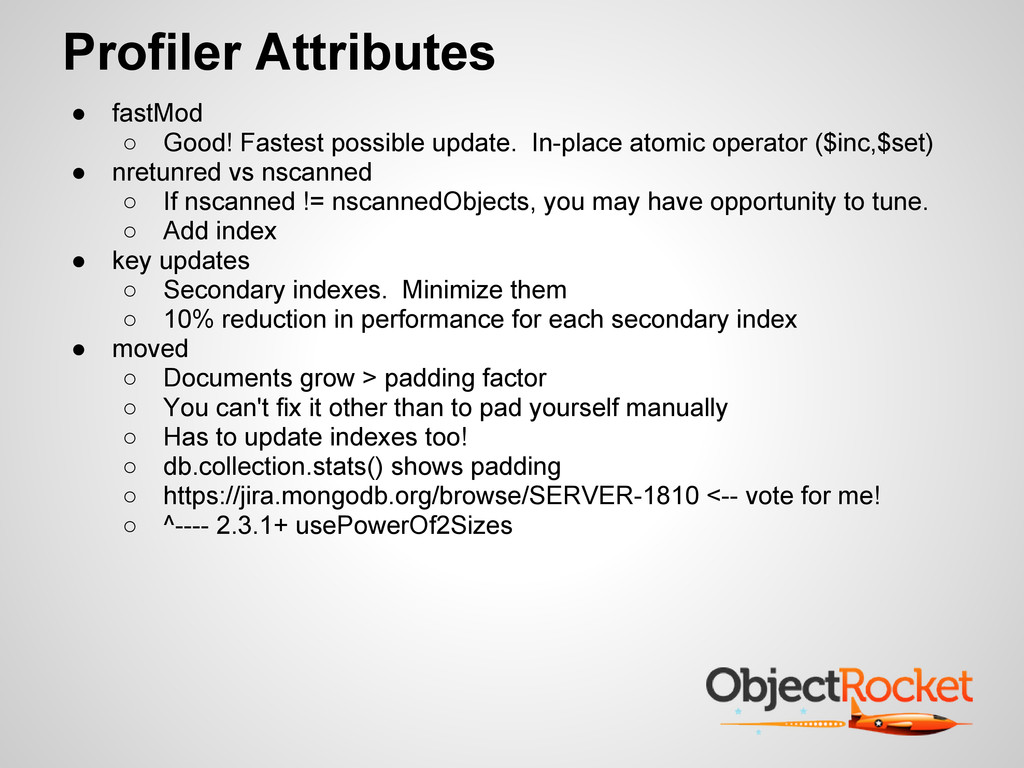
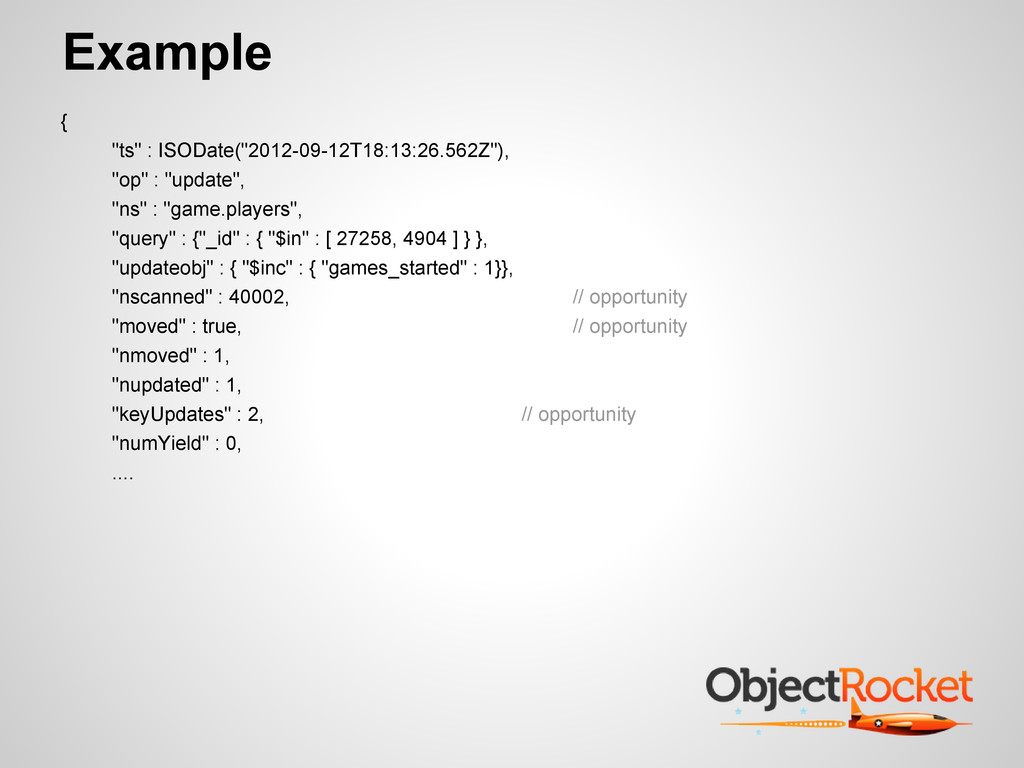
    atomic operator ($inc,$set) • nretunred vs nscanned ◦ If nscanned != nscannedObjects, you may have opportunity to tune. ◦ Add index • key updates ◦ Secondary indexes. Minimize them ◦ 10% reduction in performance for each secondary index • moved ◦ Documents grow > padding factor ◦ You can't fix it other than to pad yourself manually ◦ Has to update indexes too! ◦ db.collection.stats() shows padding ◦ https://jira.mongodb.org/browse/SERVER-1810 <-- vote for me! ◦ ^---- 2.3.1+ usePowerOf2Sizes
  8. { "ts" : ISODate("2012-09-14T16:34:00.010Z"), // date it occurred "op" :

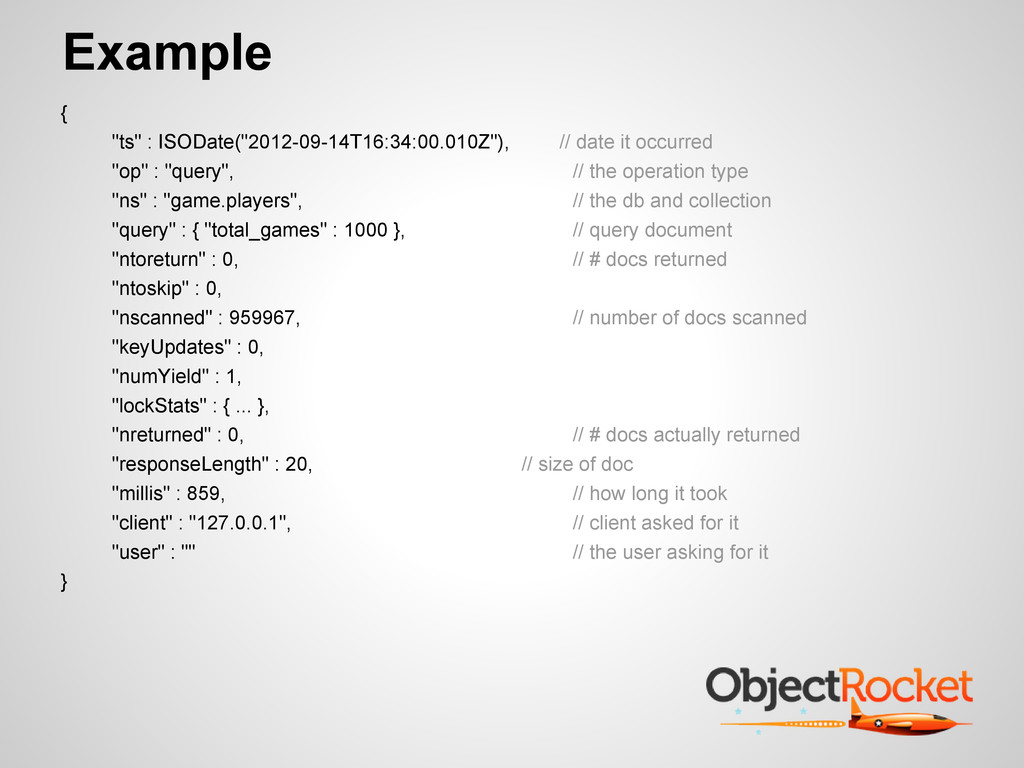
    "query", // the operation type "ns" : "game.players", // the db and collection "query" : { "total_games" : 1000 }, // query document "ntoreturn" : 0, // # docs returned "ntoskip" : 0, "nscanned" : 959967, // number of docs scanned "keyUpdates" : 0, "numYield" : 1, "lockStats" : { ... }, "nreturned" : 0, // # docs actually returned "responseLength" : 20, // size of doc "millis" : 859, // how long it took "client" : "127.0.0.1", // client asked for it "user" : "" // the user asking for it } Example
  9. Example { "ts" : ISODate("2012-09-12T18:13:25.508Z"), "op" : "update", // this

    is an update "ns" : "game.players", "query" : {"_id" : { "$in" : [ 37013, 13355 ] } }, // the query for the update "updateobj" : { "$inc" : { "games_started" : 1 }}, // the update being performed "nscanned" : 1, "moved" : true, // document is moved "nmoved" : 1, "nupdated" : 1, "keyUpdates" : 0, // at least no secondary indexes "numYield" : 0, "lockStats" : { "timeLockedMicros" : { "r" : NumberLong(0),"w" : NumberLong(206)}, "timeAcquiringMicros" : {"r" : NumberLong(0),"w" : NumberLong(163)}}, "millis" : 0, "client" : "127.0.0.1", "user" : "" }
  10. { "ts" : ISODate("2012-09-12T18:13:26.562Z"), "op" : "update", "ns" : "game.players",

    "query" : {"_id" : { "$in" : [ 27258, 4904 ] } }, "updateobj" : { "$inc" : { "games_started" : 1}}, "nscanned" : 40002, // opportunity "moved" : true, // opportunity "nmoved" : 1, "nupdated" : 1, "keyUpdates" : 2, // opportunity "numYield" : 0, .... Example
  11. Statement Tuning • Take any query when you build your

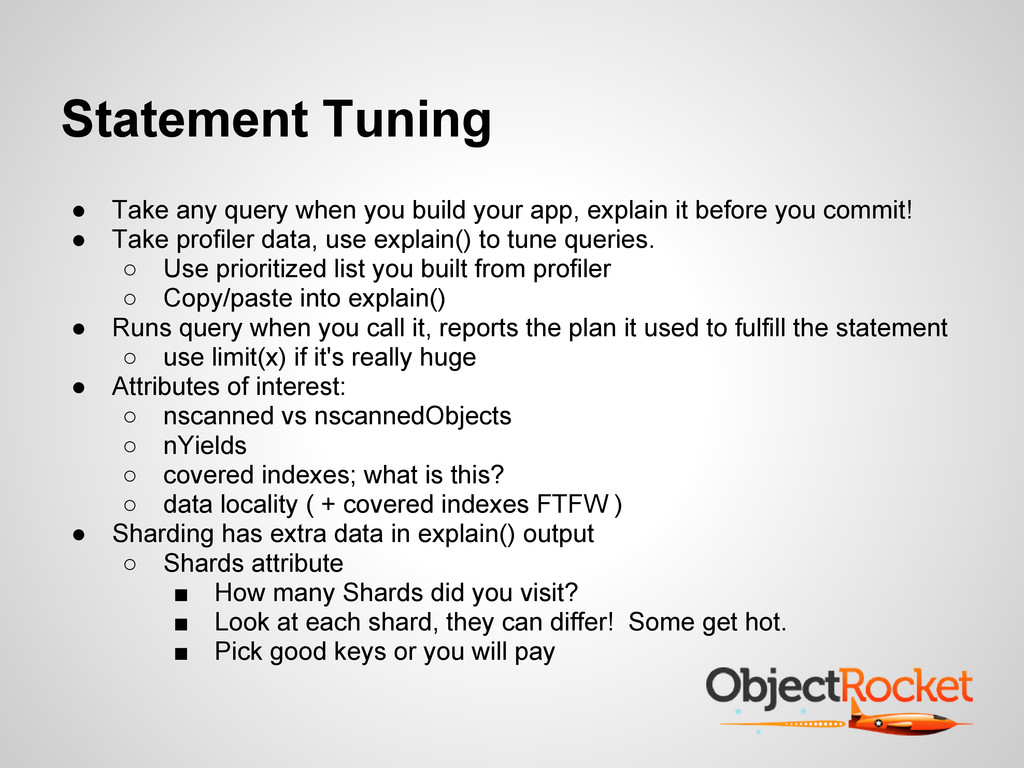
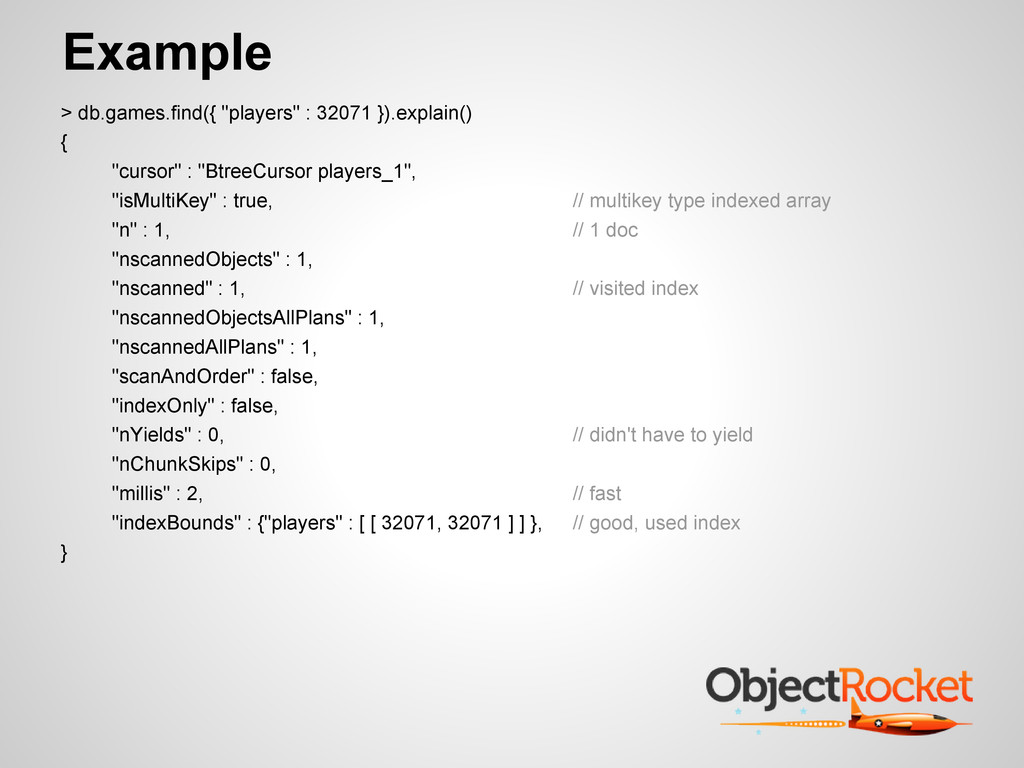
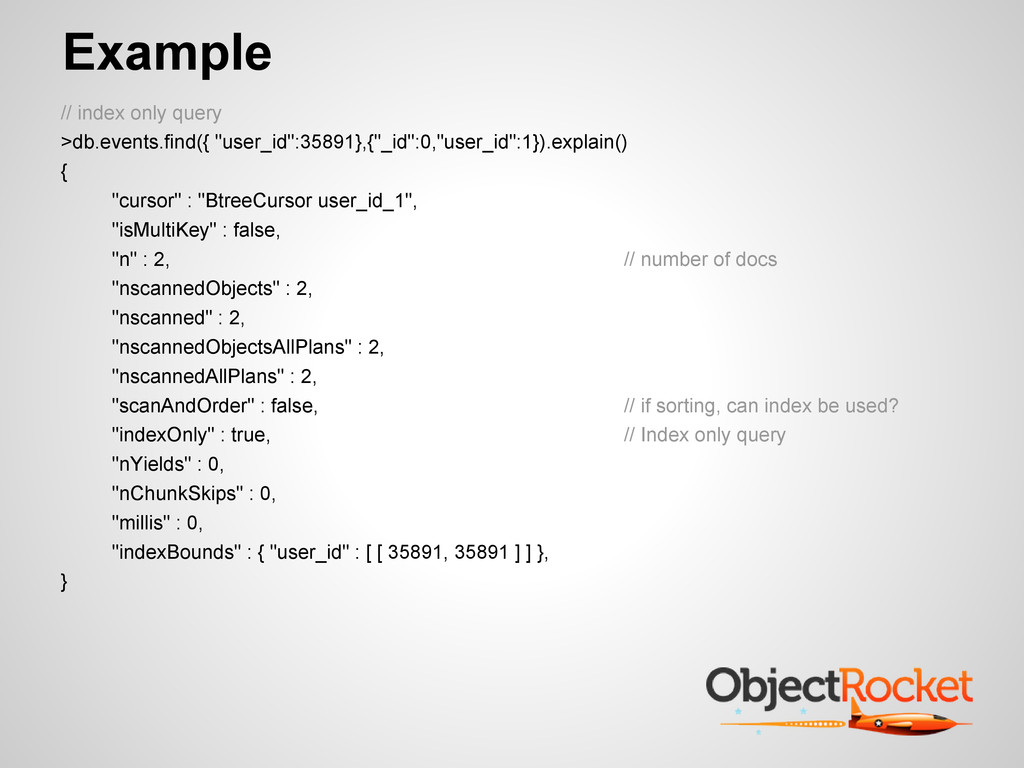
    app, explain it before you commit! • Take profiler data, use explain() to tune queries. ◦ Use prioritized list you built from profiler ◦ Copy/paste into explain() • Runs query when you call it, reports the plan it used to fulfill the statement ◦ use limit(x) if it's really huge • Attributes of interest: ◦ nscanned vs nscannedObjects ◦ nYields ◦ covered indexes; what is this? ◦ data locality ( + covered indexes FTFW ) • Sharding has extra data in explain() output ◦ Shards attribute ▪ How many Shards did you visit? ▪ Look at each shard, they can differ! Some get hot. ▪ Pick good keys or you will pay
  12. > db.games.find({ "players" : 32071 }).explain() { "cursor" : "BtreeCursor

    players_1", "isMultiKey" : true, // multikey type indexed array "n" : 1, // 1 doc "nscannedObjects" : 1, "nscanned" : 1, // visited index "nscannedObjectsAllPlans" : 1, "nscannedAllPlans" : 1, "scanAndOrder" : false, "indexOnly" : false, "nYields" : 0, // didn't have to yield "nChunkSkips" : 0, "millis" : 2, // fast "indexBounds" : {"players" : [ [ 32071, 32071 ] ] }, // good, used index } Example
  13. // index only query >db.events.find({ "user_id":35891},{"_id":0,"user_id":1}).explain() { "cursor" : "BtreeCursor

    user_id_1", "isMultiKey" : false, "n" : 2, // number of docs "nscannedObjects" : 2, "nscanned" : 2, "nscannedObjectsAllPlans" : 2, "nscannedAllPlans" : 2, "scanAndOrder" : false, // if sorting, can index be used? "indexOnly" : true, // Index only query "nYields" : 0, "nChunkSkips" : 0, "millis" : 0, "indexBounds" : { "user_id" : [ [ 35891, 35891 ] ] }, } Example
  14. Data locality document; user_id:10 data block query: db.mytest.find({"user_id":10}).count() = 3

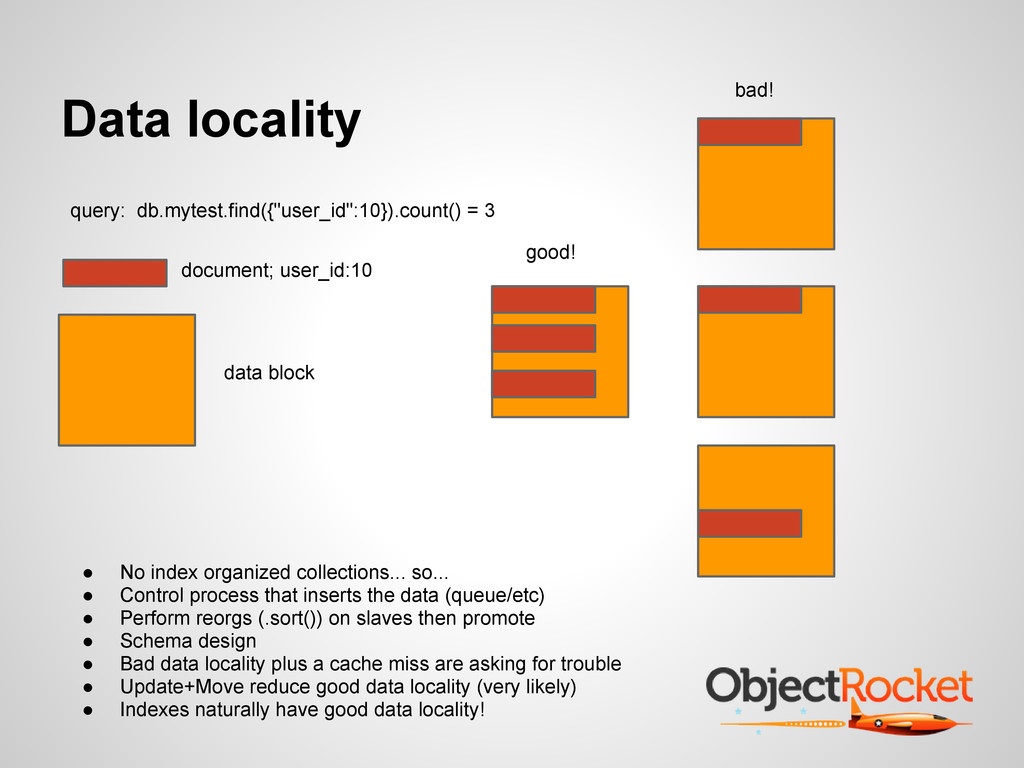
    good! bad! • No index organized collections... so... • Control process that inserts the data (queue/etc) • Perform reorgs (.sort()) on slaves then promote • Schema design • Bad data locality plus a cache miss are asking for trouble • Update+Move reduce good data locality (very likely) • Indexes naturally have good data locality!
  15. Example; Data Locality > var arr=db.events.find( {"user_id":35891}, {'$diskLoc':1, 'user_id':1}).limit(20).showDiskLoc() >

    for(var i=0; i<arr.length(); i++) { var b=Math.round(arr[i].$diskLoc.offset/512); printjson(arr[i].user_id+" "+b); } "35891 354" "35891 55674" // what is this stuff? examples at: https://gist.github.com/977336
  16. Instance tuning; Write performance • Overall system performance function of

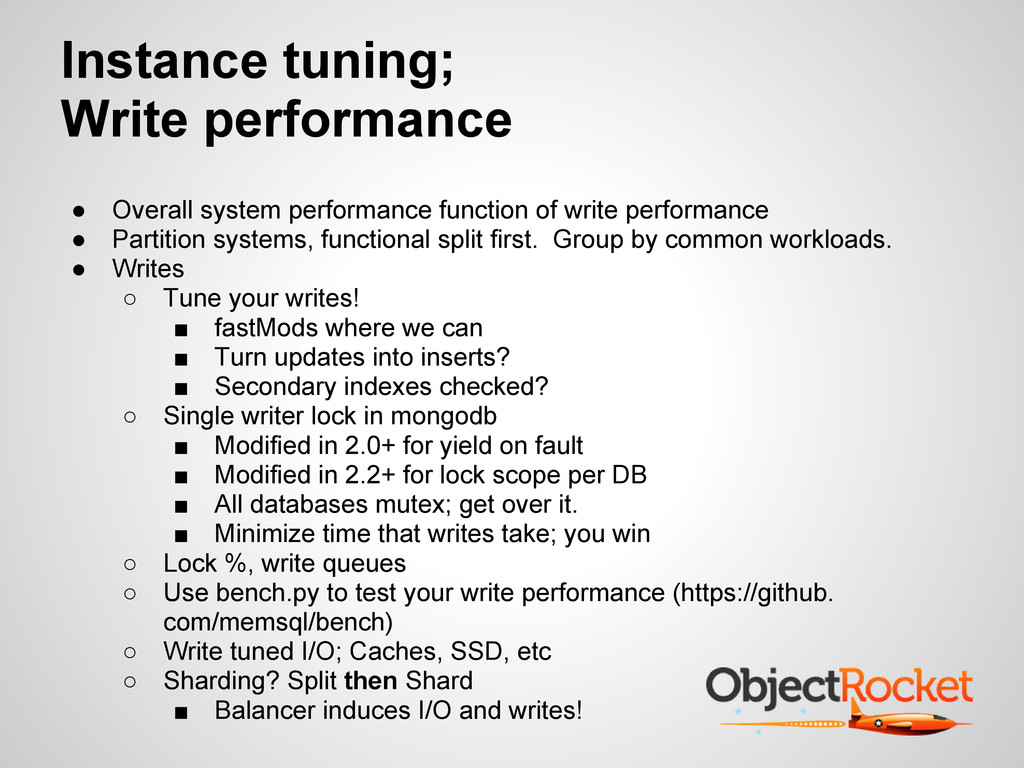
    write performance • Partition systems, functional split first. Group by common workloads. • Writes ◦ Tune your writes! ▪ fastMods where we can ▪ Turn updates into inserts? ▪ Secondary indexes checked? ◦ Single writer lock in mongodb ▪ Modified in 2.0+ for yield on fault ▪ Modified in 2.2+ for lock scope per DB ▪ All databases mutex; get over it. ▪ Minimize time that writes take; you win ◦ Lock %, write queues ◦ Use bench.py to test your write performance (https://github. com/memsql/bench) ◦ Write tuned I/O; Caches, SSD, etc ◦ Sharding? Split then Shard ▪ Balancer induces I/O and writes!
  17. Instance tuning; Read performance • Overall system performance function of

    write performance • Reads scale well as long as writes are tuned • Partition systems, split first. Group by common workloads. • Reads scale nicely, especially against slaves ◦ inconsistency OK? ◦ Know your workload! • Statements tuned ◦ Using indexes ◦ Covered indexes ◦ Data locality • Sharding ◦ See how I mentioned that last?