Upgrade to Pro — share decks privately, control downloads, hide ads and more …

Beyond Block Diagrams: Different Ways of Understanding K8s Architecture

Kim Schlesinger
November 01, 2021
77

Beyond Block Diagrams: Different Ways of Understanding K8s Architecture

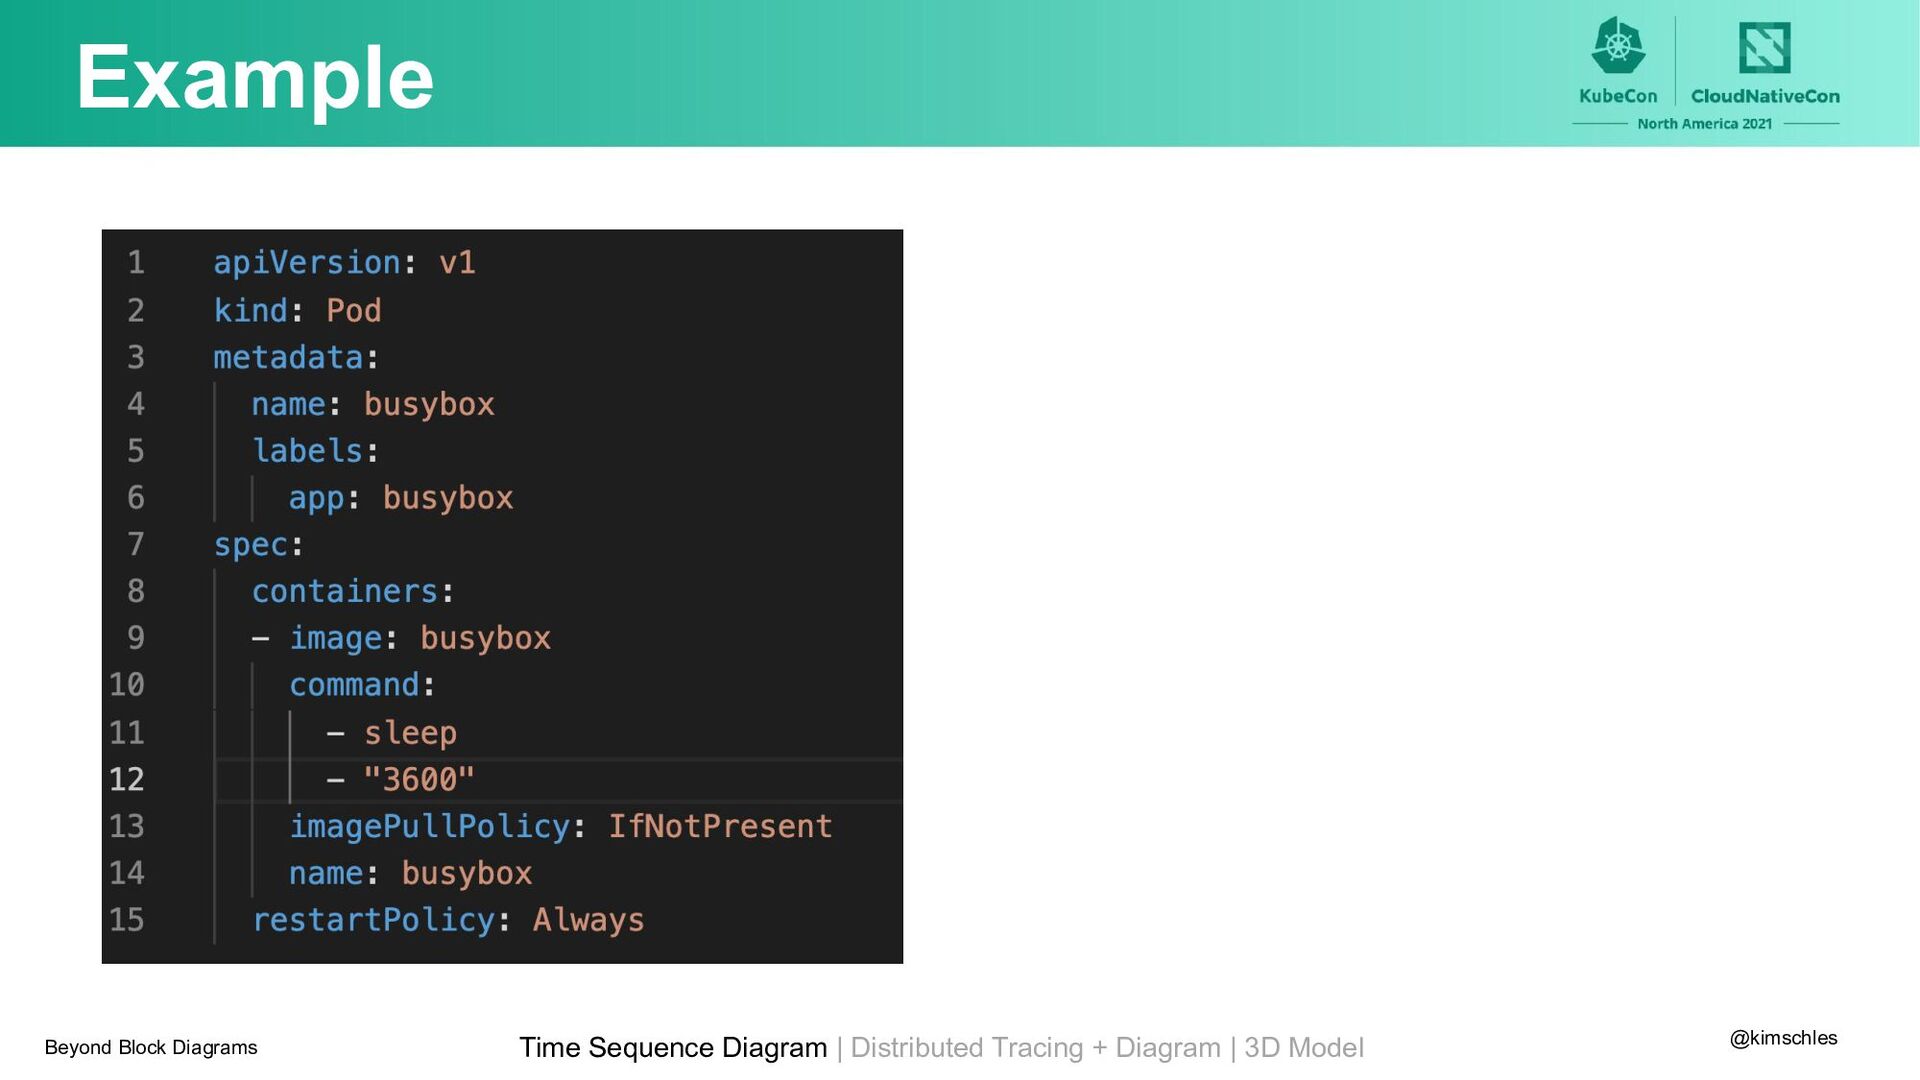
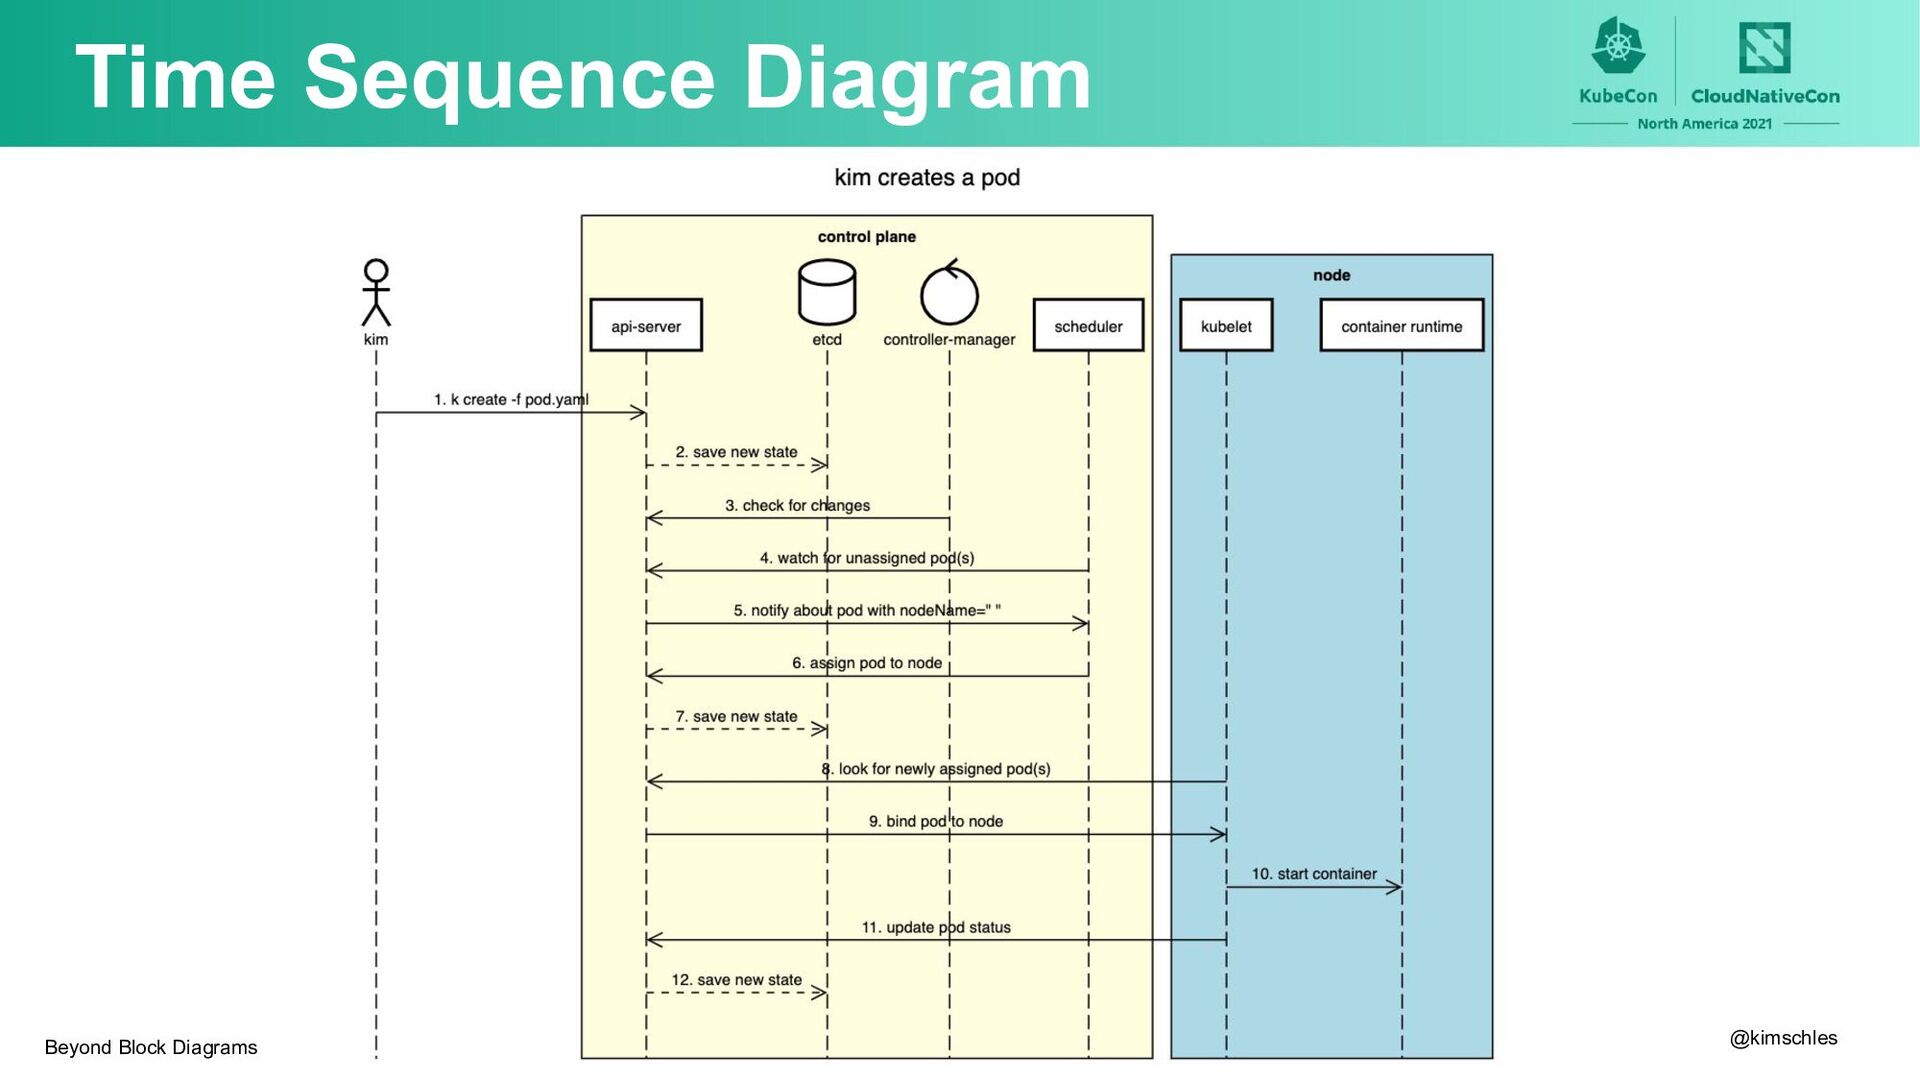
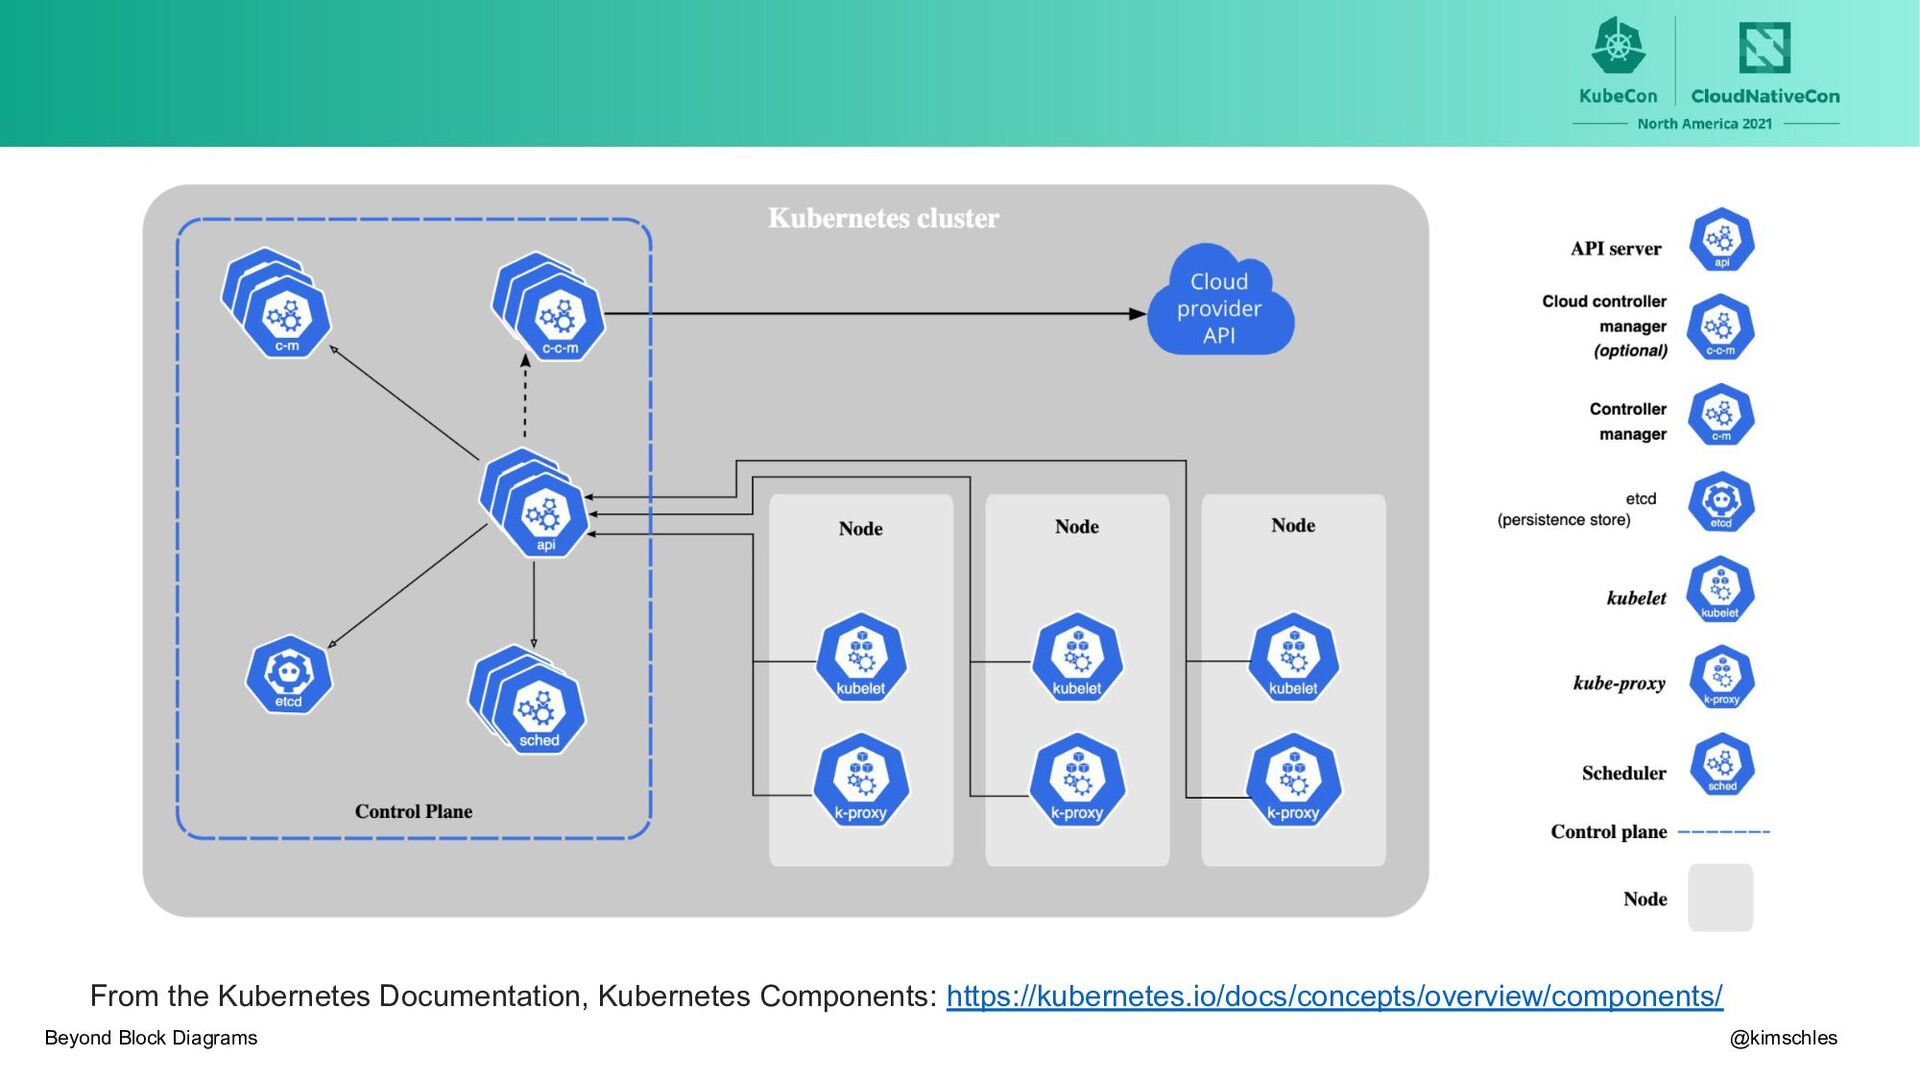
Most introductory Kubernetes videos and blog posts use static block diagrams to illustrate the core components of Kubernetes and how they interact. These diagrams don’t convey the dynamic communication between the K8s control plane, nodes, and pods, and we owe it to ourselves and people new to the field more accurate and engaging ways of representing Kubernetes architecture. This talk will demonstrate a few different methods to visualize how Kubernetes components work together including a time-sequence diagram that models what happens when a user creates a pod using the Kubernetes command line tool, kubectl, and how to use Jaeger to see an http request move onto different nodes by traveling through a load balancer, to a service, and arriving at a specific pod. This talk is for people who are new to Kubernetes and want to understand how the system is designed, as well as experienced engineers who are curious about alternative ways of visualizing Kubernetes architecture.

Kim Schlesinger

November 01, 2021
Tweet

Transcript

  1. Hi, I’m Kim Developer Advocate Site Reliability Engineer JavaScript Developer

    Elementary School Teacher 2018 @kimschles Beyond Block Diagrams
  2. “Any framework that you can hold as a mental representation

    of an external reality.” - What is a mental model? by Julia Clavien Mental Models Photo source: https://unsplash.com/photos/3KGF9R_0oHs @kimschles Beyond Block Diagrams
  3. Takeaways 1. Create diagrams that show the passage of time

    2. Use distributed tracing technology as a learning tool 3. Build 3D models of Kubernetes clusters Photo source: https://unsplash.com/photos/_gEKtyIbRSM @kimschles Beyond Block Diagrams
  4. Agenda 1. Time Sequence Diagram 2. Distributed Traces + Diagram

    3. 3D Model @kimschles Beyond Block Diagrams
  5. Agenda 1. Time Sequence Diagram 2. Distributed Traces + Diagram

    3. 3D Model @kimschles Beyond Block Diagrams
  6. Example Time Sequence Diagram | Distributed Tracing + Diagram |

    3D Model @kimschles Beyond Block Diagrams
  7. kubectl create -f pod.yaml Time Sequence Diagram | Distributed Tracing

    + Diagram | 3D Model @kimschles Beyond Block Diagrams
  8. Agenda 1. Time Sequence Diagram 2. Distributed Traces + Diagram

    3. 3D Model @kimschles Beyond Block Diagrams
  9. Agenda 1. Time Sequence Diagram 2. Distributed Traces + Diagram

    3. 3D Model @kimschles Beyond Block Diagrams
  10. Distributed Tracing “Distributed tracing, also called distributed request tracing, is

    a method used to profile and monitor applications, especially those built using a microservices architecture.” - OpenTracing Project Time Sequence Diagram | Distributed Tracing + Diagram | 3D Model @kimschles Beyond Block Diagrams
  11. Meow-Micro 🐈 • 2 go microservices • The meow-client accepts

    requests via a REST API and uses GRPC to communicate with the meow-server • Fernando Diaz at GitLab Example Time Sequence Diagram | Distributed Tracing + Diagram | 3D Model @kimschles Beyond Block Diagrams
  12. curl http://143.244.209.228/meow -X POST -d '{"name": "Meow-Mixer"}' Time Sequence Diagram

    | Distributed Tracing + Diagram | 3D Model @kimschles Beyond Block Diagrams
  13. @kimschles Beyond Block Diagrams From Setting up Distributed Tracing with

    OpenTelemetry & Jaeger in Kubernetes Ingress-NGINX by Fernando Diaz Time Sequence Diagram | Distributed Tracing + Diagram | 3D Model
  14. Time Sequence Diagram | Distributed Tracing + Diagram | 3D

    Model @kimschles From Setting up Distributed Tracing with OpenTelemetry & Jaeger in Kubernetes Ingress-NGINX by Fernando Diaz Beyond Block Diagrams
  15. @kimschles Beyond Block Diagrams Weaveworks kspan Example: rollout of a

    Deployment of two Pods From weaveworks-experiments/kspan: Turning Kubernetes Events into spans
  16. Agenda 1. Time Sequence Diagram 2. Distributed Traces + Diagram

    3. 3D Model @kimschles Beyond Block Diagrams
  17. Agenda 1. Time Sequence Diagram 2. Distributed Traces + Diagram

    3. 3D Model @kimschles Beyond Block Diagrams
  18. Example Time Sequence Diagram | Distributed Tracing + Diagram |

    3D Model @kimschles Beyond Block Diagrams
  19. kubectl create -f pod.yaml Time Sequence Diagram | Distributed Tracing

    + Diagram | 3D Model @kimschles Beyond Block Diagrams
  20. Time Sequence Diagram | Distributed Tracing + Diagram | 3D

    Model @kimschles Beyond Block Diagrams
  21. Agenda 1. Time Sequence Diagram 2. Distributed Traces + Diagram

    3. 3D Model @kimschles Beyond Block Diagrams
  22. “Any framework that you can hold as a mental representation

    of an external reality.” - What is a mental model? by Julia Clavien Mental Models Photo source: https://unsplash.com/photos/3KGF9R_0oHs @kimschles Beyond Block Diagrams
  23. Takeaways 1. Create diagrams that show the passage of time

    2. Use distributed tracing technology as a learning tool 3. Build 3D models of Kubernetes clusters Photo source: https://unsplash.com/photos/_gEKtyIbRSM @kimschles Beyond Block Diagrams
  24. Resources Examples of Kubernetes Time Sequence Diagrams • Writing custom

    Kubernetes Scheduler - My Fake Tardis • A Sequential Breakdown of the Kubernetes Deployment Process- ContainerLabs Time Sequence Diagram Generator • SequenceDiagram.org - UML Sequence Diagram Online Tool @kimschles Beyond Block Diagrams
  25. Resources Distributed Tracing with Jaeger and ingress-nginx • Jaeger: open

    source, end-to-end distributed tracing • OpenTracing - NGINX Ingress Controller Tutorial • Setting up Distributed Tracing in Kubernetes with OpenTracing, Jaeger, and Ingress-NGINX by Fernando Diaz, @awkwardferny Diagram Tool • LucidChart @kimschles Beyond Block Diagrams
  26. Resources kspan • Traces from Events: A New Way to

    Visualise Kubernetes Activities - Bryan Boreham • weaveworks-experiments/kspan: Turning Kubernetes Events into spans @kimschles Beyond Block Diagrams