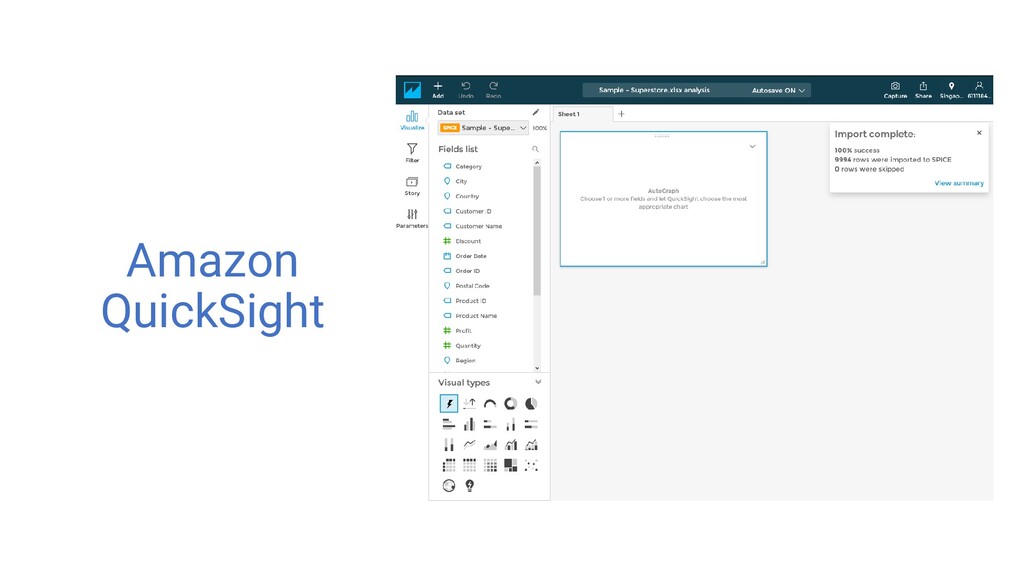
This slide deck introduces the concept of Amazon Quicksight as a Business Intelligence tool and how QuickSight lets you easily create and publish interactive BI dashboards that include Machine Learning-powered insights as well as its other features.
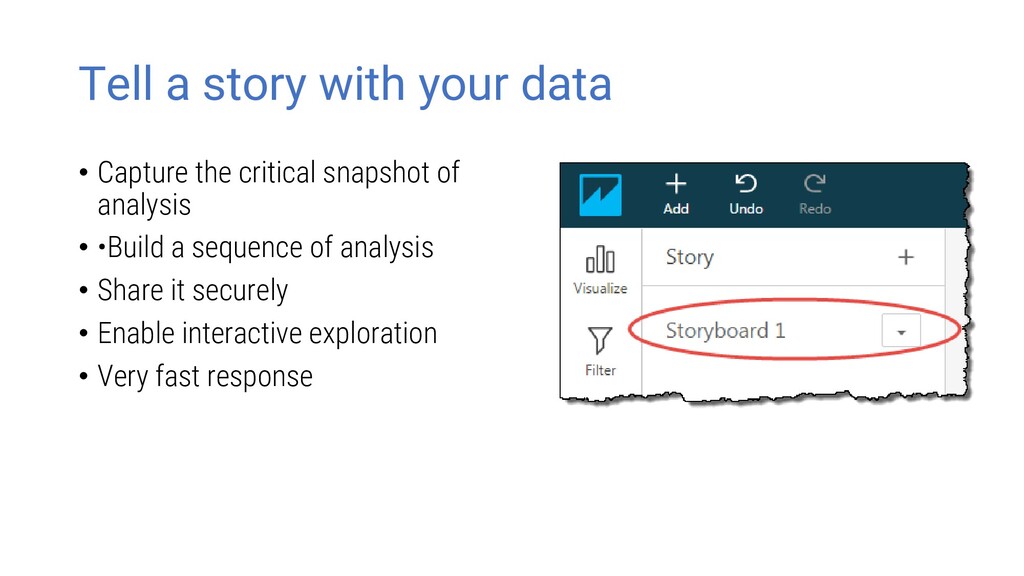
with SPICE (Super-fast, Parallel, In-memory, Calculation Engine) • Intuitive visualizations and transitions with AutoGraph • Native mobile experience • Secure sharing and collaboration through StoryBoards
Engine • 2 to 4x compression columnar data • Compiled queries with machine code generation • Rich calculations • Very fast response time to queries • Fully managed – No hardware or software to license
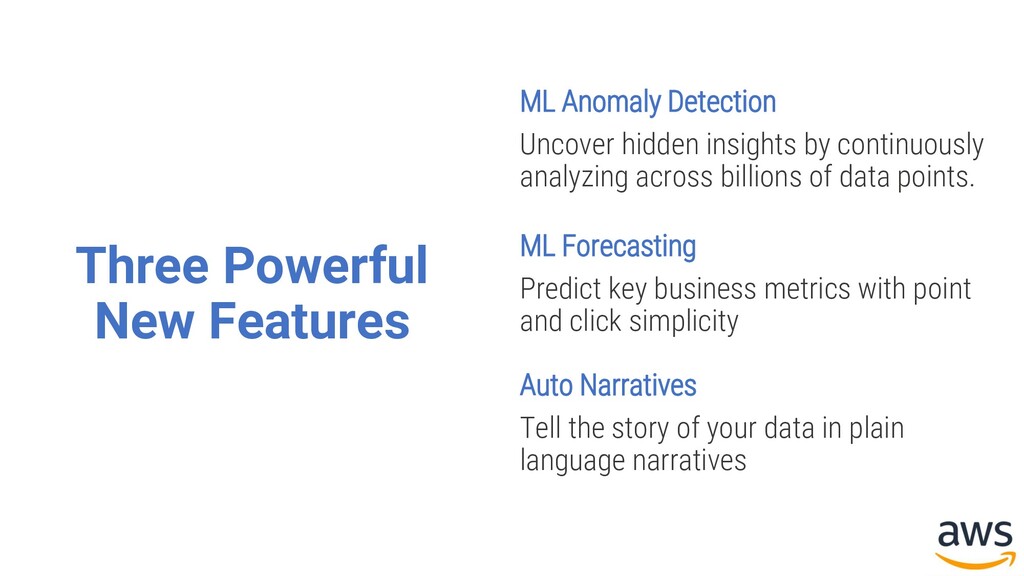
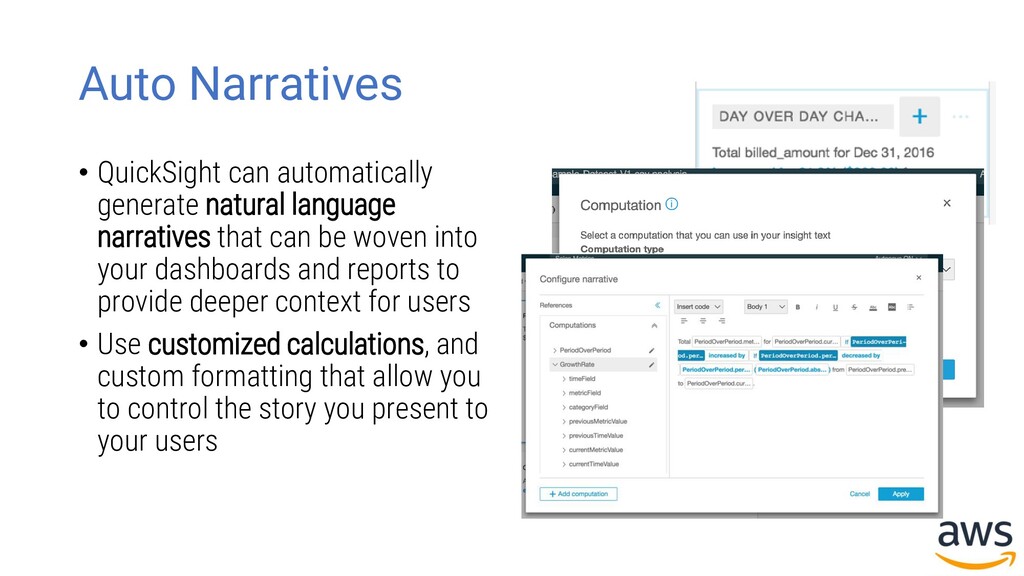
by continuously analyzing across billions of data points. ML Forecasting Predict key business metrics with point and click simplicity Auto Narratives Tell the story of your data in plain language narratives
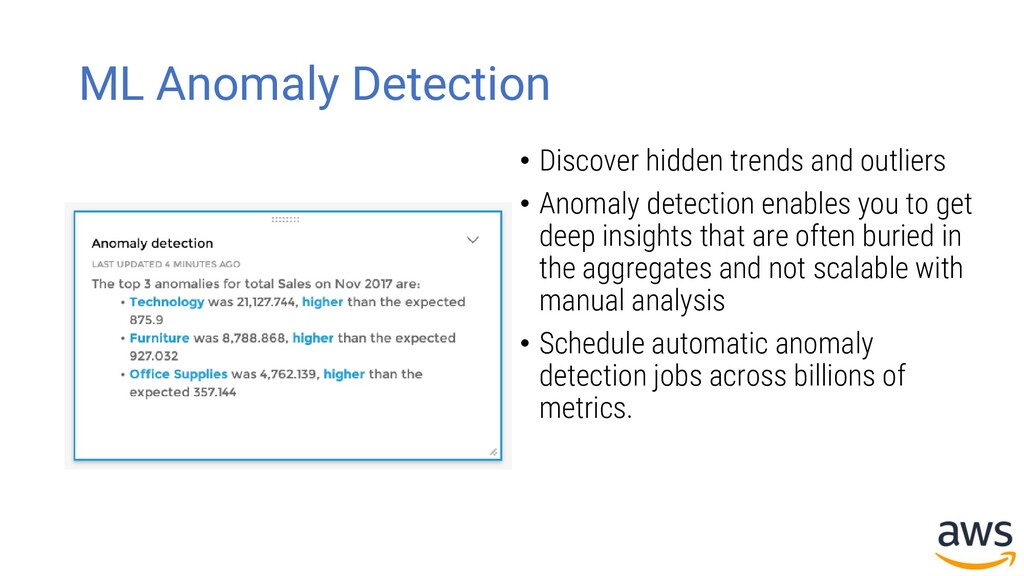
Anomaly detection enables you to get deep insights that are often buried in the aggregates and not scalable with manual analysis • Schedule automatic anomaly detection jobs across billions of metrics.
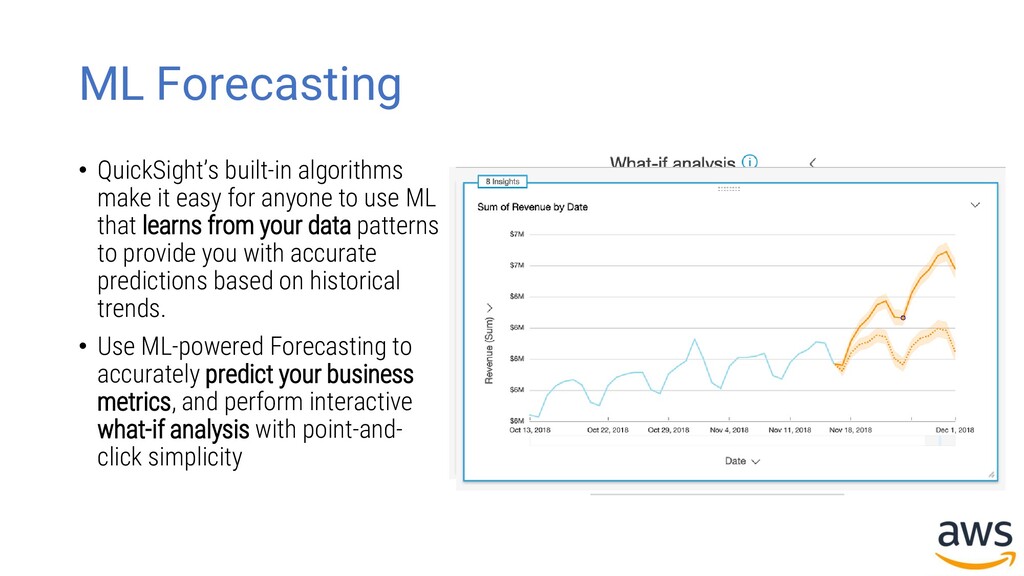
anyone to use ML that learns from your data patterns to provide you with accurate predictions based on historical trends. • Use ML-powered Forecasting to accurately predict your business metrics, and perform interactive what-if analysis with point-and- click simplicity
that can be woven into your dashboards and reports to provide deeper context for users • Use customized calculations, and custom formatting that allow you to control the story you present to your users
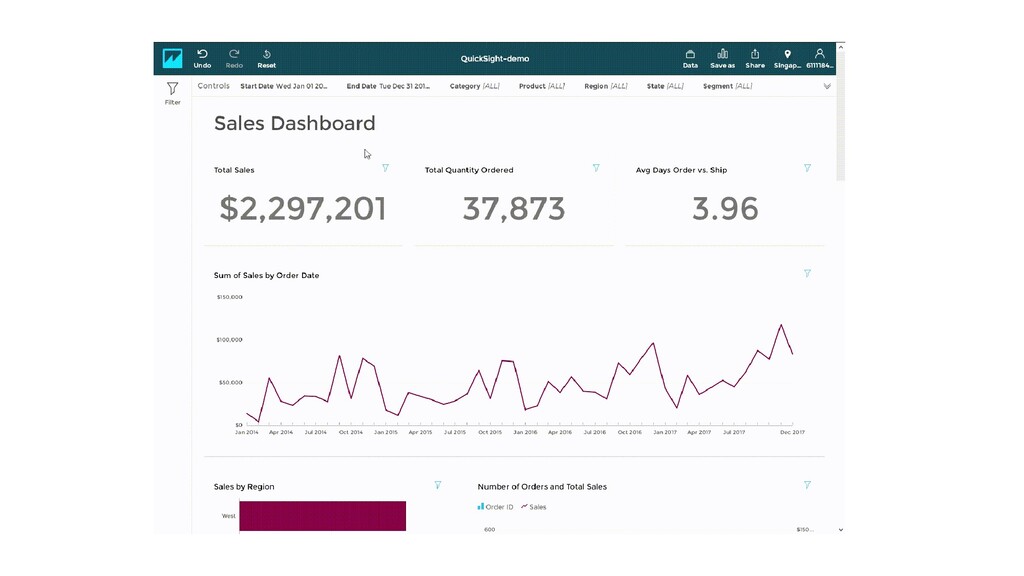
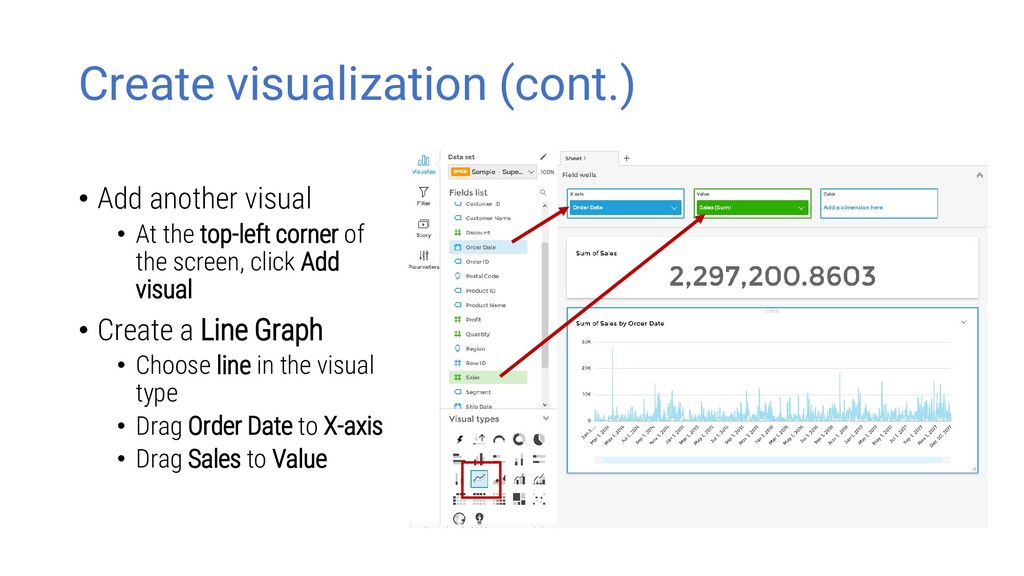
top-left corner of the screen, click Add visual • Create a Line Graph • Choose line in the visual type • Drag Order Date to X-axis • Drag Sales to Value
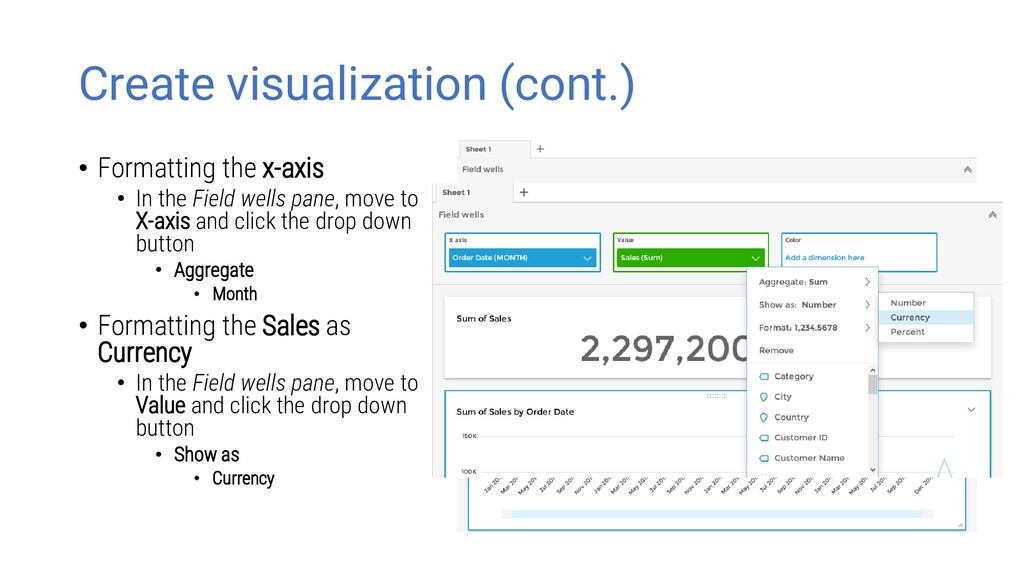
Field wells pane, move to X-axis and click the drop down button • Aggregate • Month • Formatting the Sales as Currency • In the Field wells pane, move to Value and click the drop down button • Show as • Currency
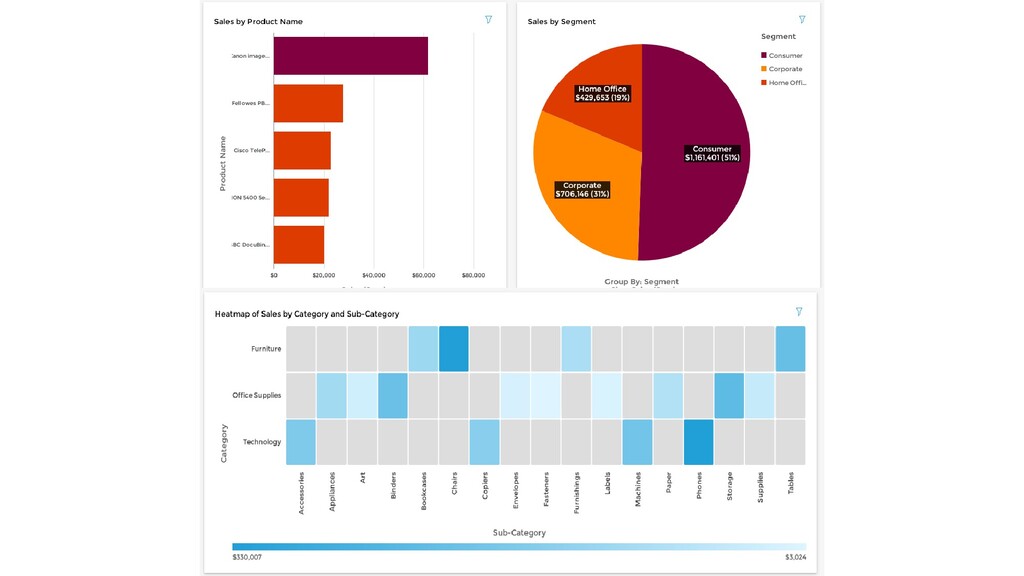
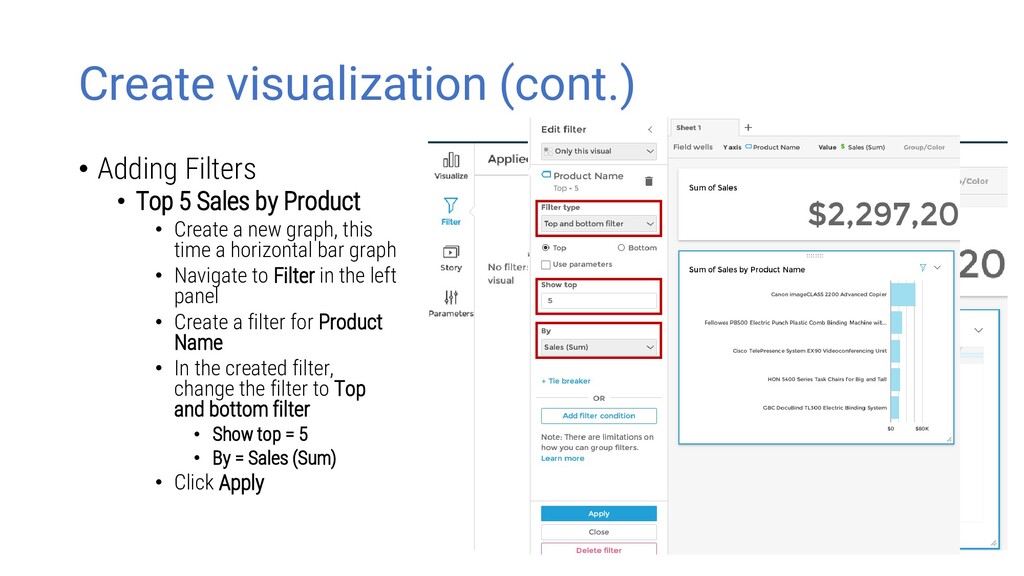
by Product • Create a new graph, this time a horizontal bar graph • Navigate to Filter in the left panel • Create a filter for Product Name • In the created filter, change the filter to Top and bottom filter • Show top = 5 • By = Sales (Sum) • Click Apply
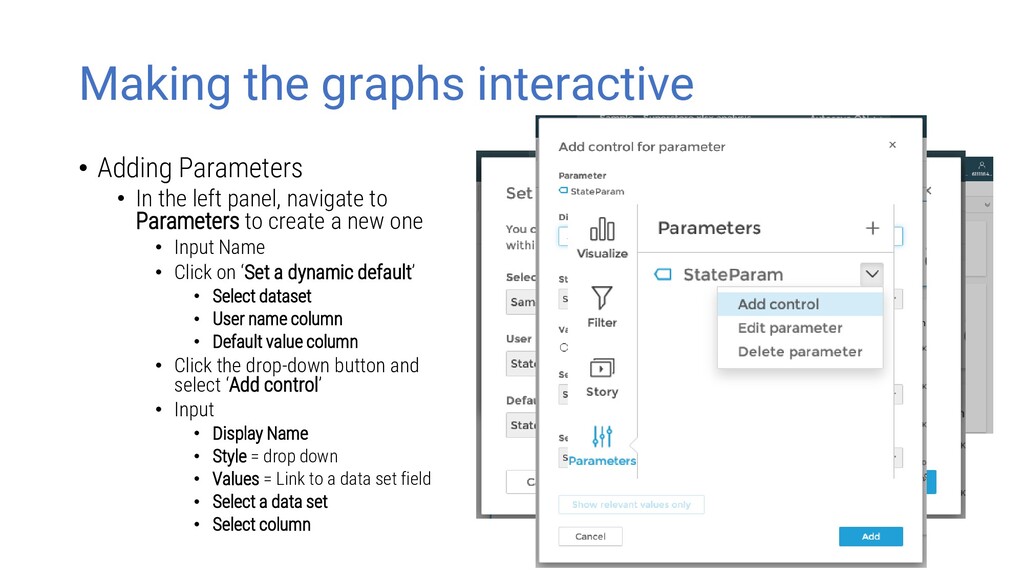
left panel, navigate to Parameters to create a new one • Input Name • Click on ‘Set a dynamic default’ • Select dataset • User name column • Default value column • Click the drop-down button and select ‘Add control’ • Input • Display Name • Style = drop down • Values = Link to a data set field • Select a data set • Select column
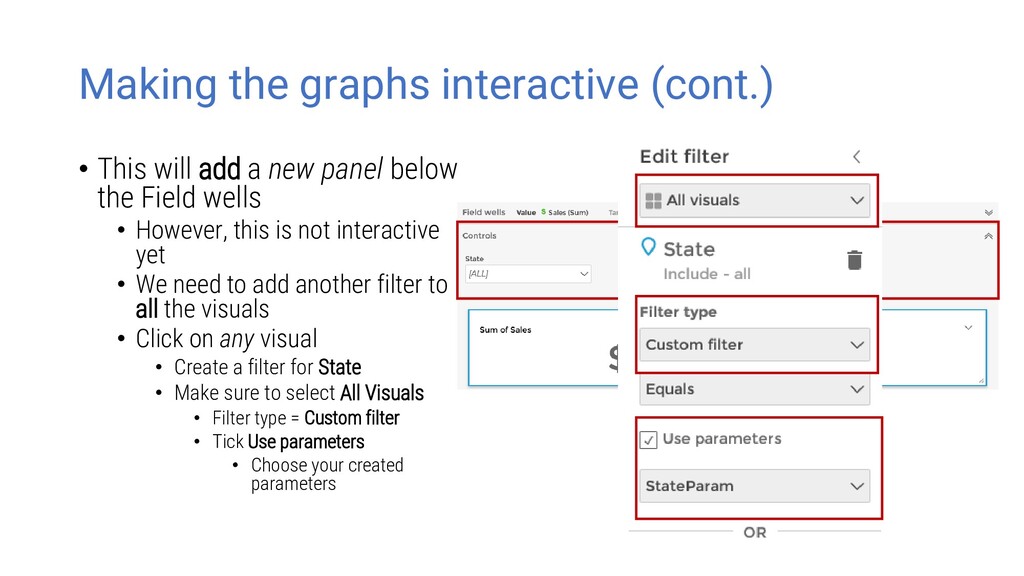
new panel below the Field wells • However, this is not interactive yet • We need to add another filter to all the visuals • Click on any visual • Create a filter for State • Make sure to select All Visuals • Filter type = Custom filter • Tick Use parameters • Choose your created parameters