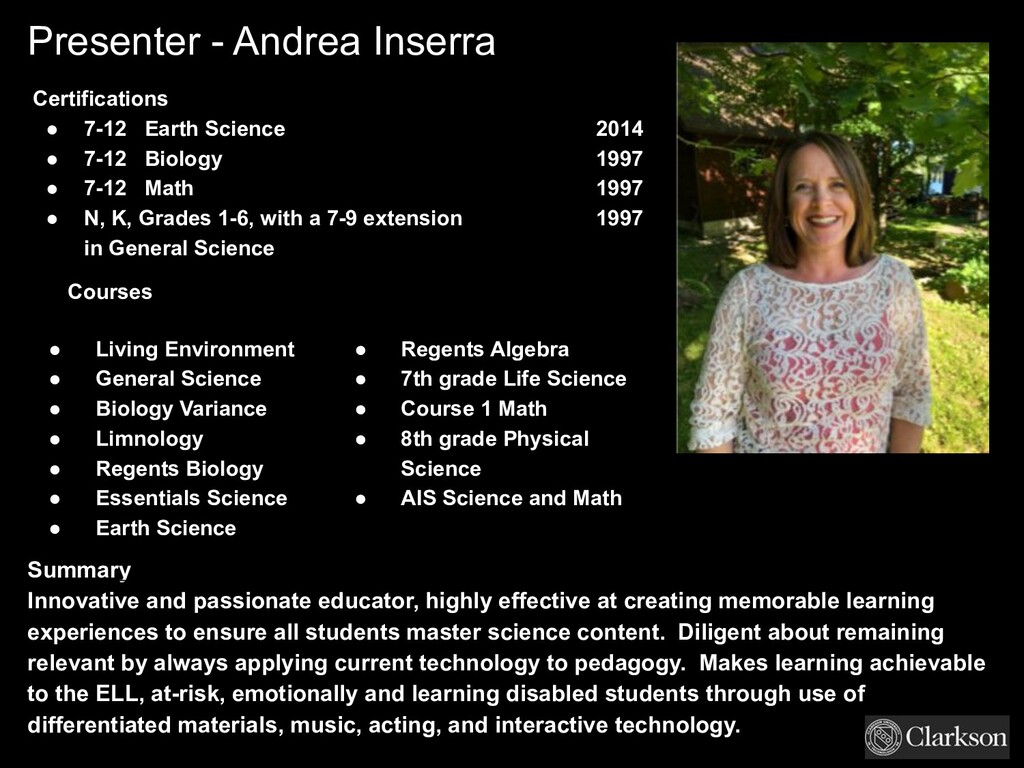
learning experiences to ensure all students master science content. Diligent about remaining relevant by always applying current technology to pedagogy. Makes learning achievable to the ELL, at-risk, emotionally and learning disabled students through use of differentiated materials, music, acting, and interactive technology. Certifications • 7-12 Earth Science 2014 • 7-12 Biology 1997 • 7-12 Math 1997 • N, K, Grades 1-6, with a 7-9 extension 1997 in General Science Courses • Living Environment • General Science • Biology Variance • Limnology • Regents Biology • Essentials Science • Earth Science • Regents Algebra • 7th grade Life Science • Course 1 Math • 8th grade Physical Science • AIS Science and Math Presenter - Andrea Inserra
7th grade accelerated science (life science, chemistry, physics), 7th grade life science, and forensics Degree with certification in Medical Laboratory Technology, a B.A. degree in Education majoring in biology and minoring in chemistry, a M.Sc. in Education I worked in a hospital laboratory before becoming a teacher. I have been teaching for 18 years. I am a New York State Master Teacher.
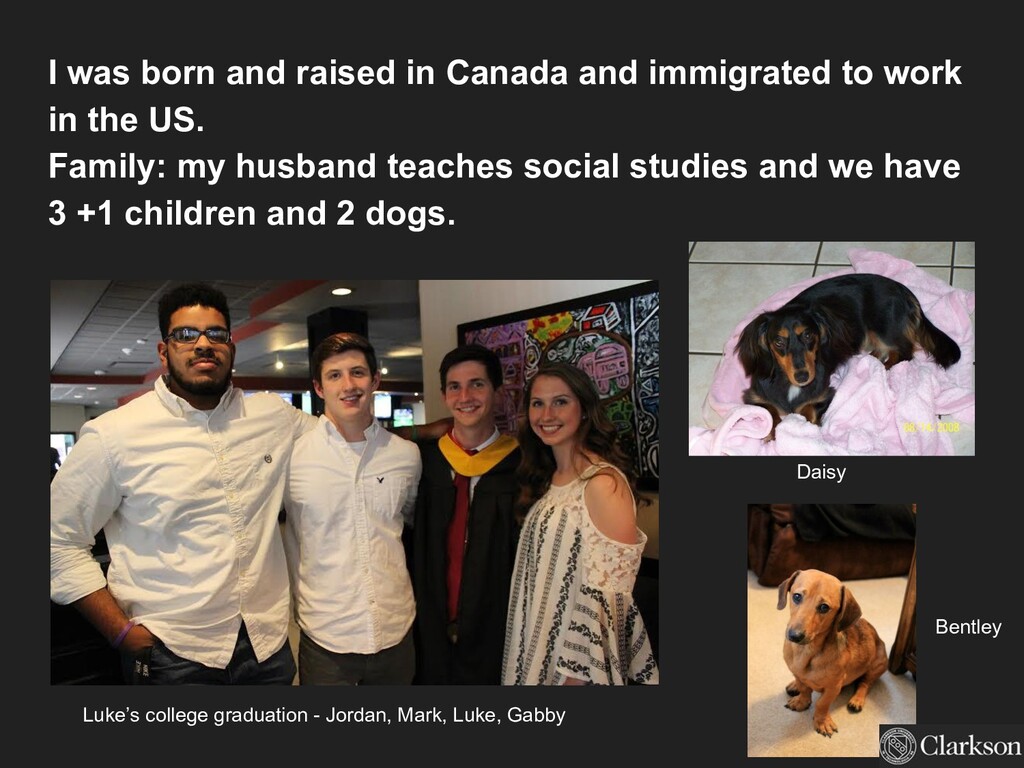
work in the US. Family: my husband teaches social studies and we have 3 +1 children and 2 dogs. Luke’s college graduation - Jordan, Mark, Luke, Gabby Daisy Bentley
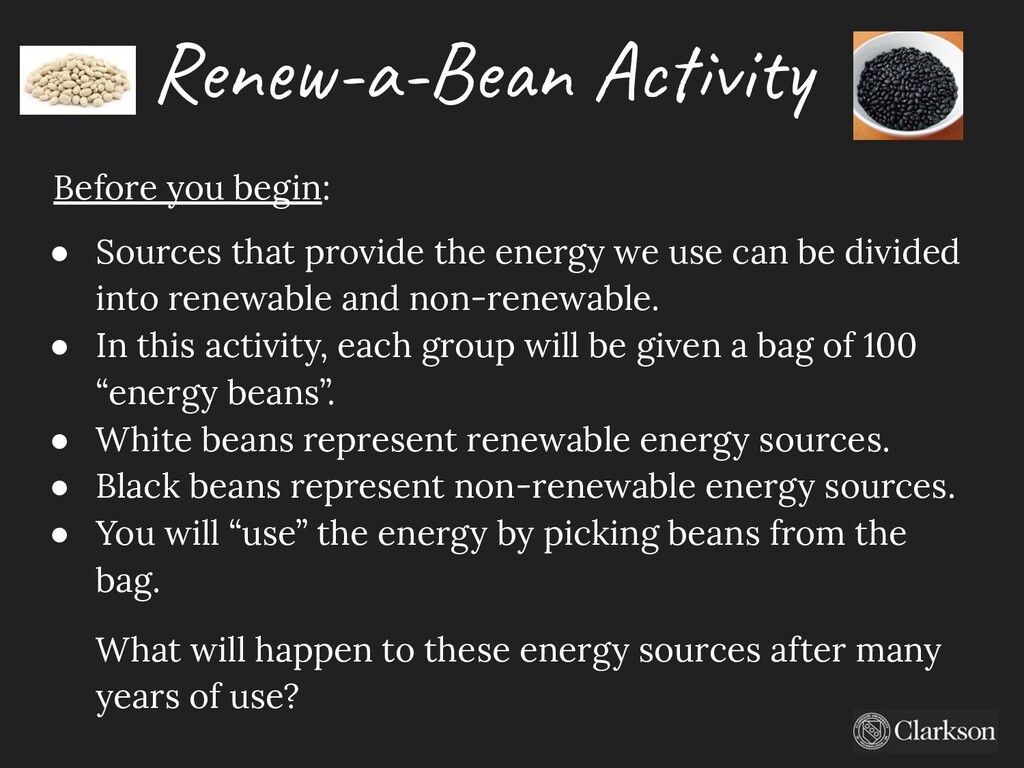
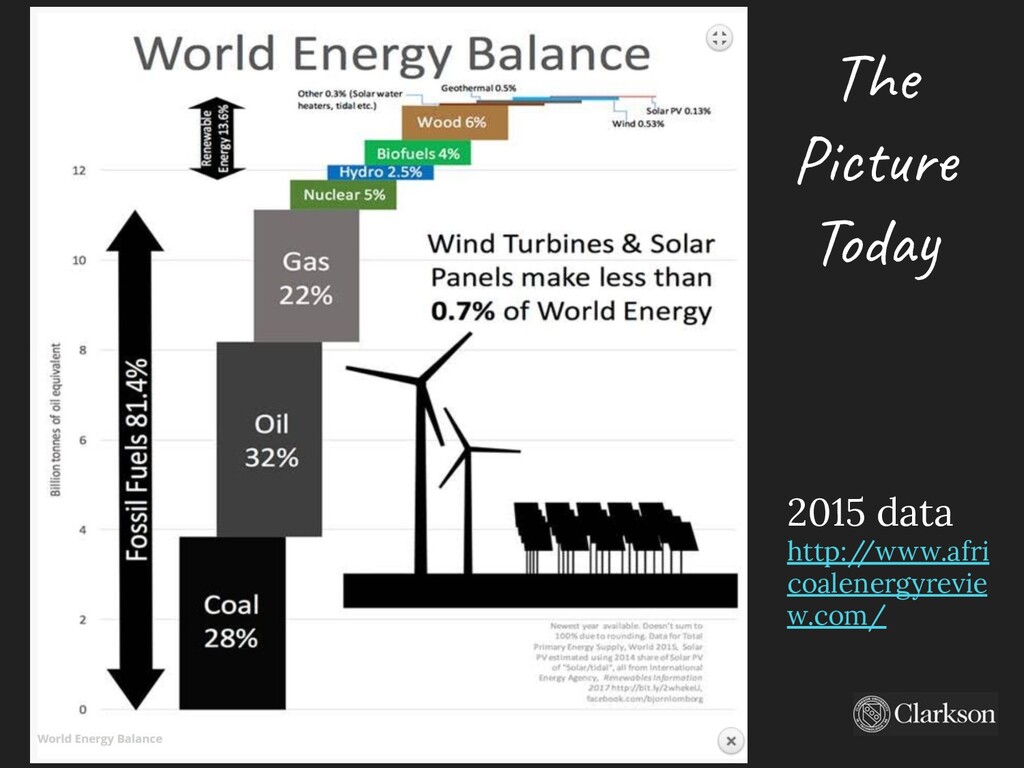
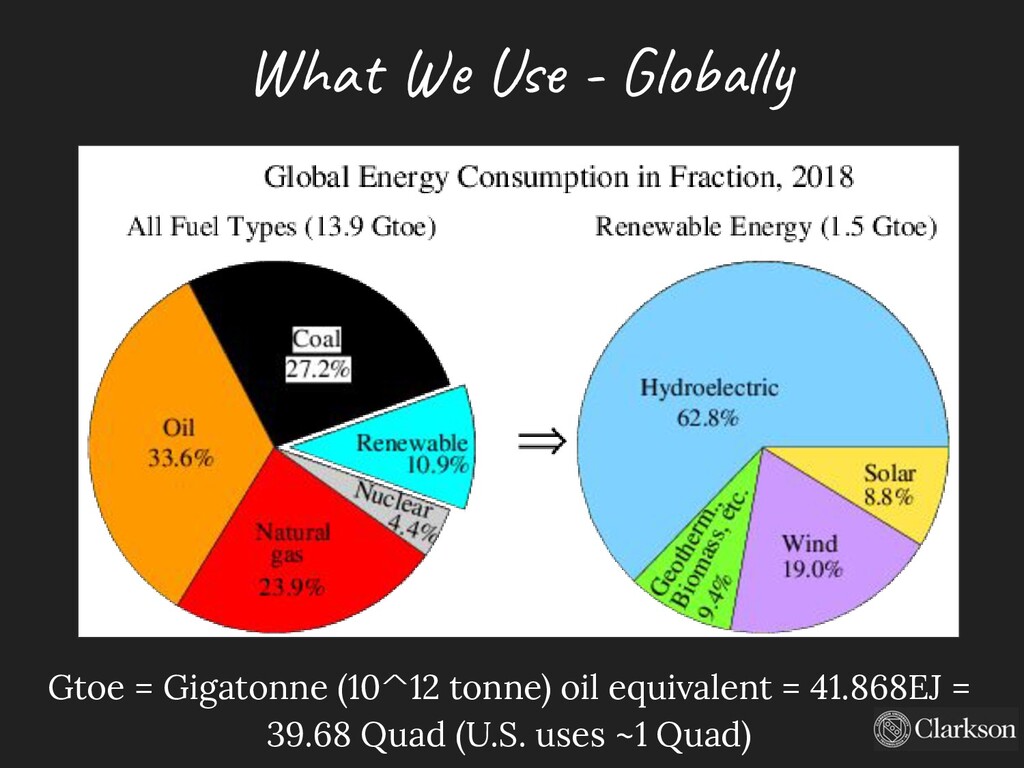
energy we use can be divided into renewable and non-renewable. • In this activity, each group will be given a bag of 100 “energy beans”. • White beans represent renewable energy sources. • Black beans represent non-renewable energy sources. • You will “use” the energy by picking beans from the bag. What will happen to these energy sources after many years of use?
- K) - the bags that contain a star will add their data to Google sheets - small plastic bag - worksheet - calculator and pencil - one person picks out 10 beans from the bag without looking - this represent energy use in 1 year. Renew-a-Bean Activity
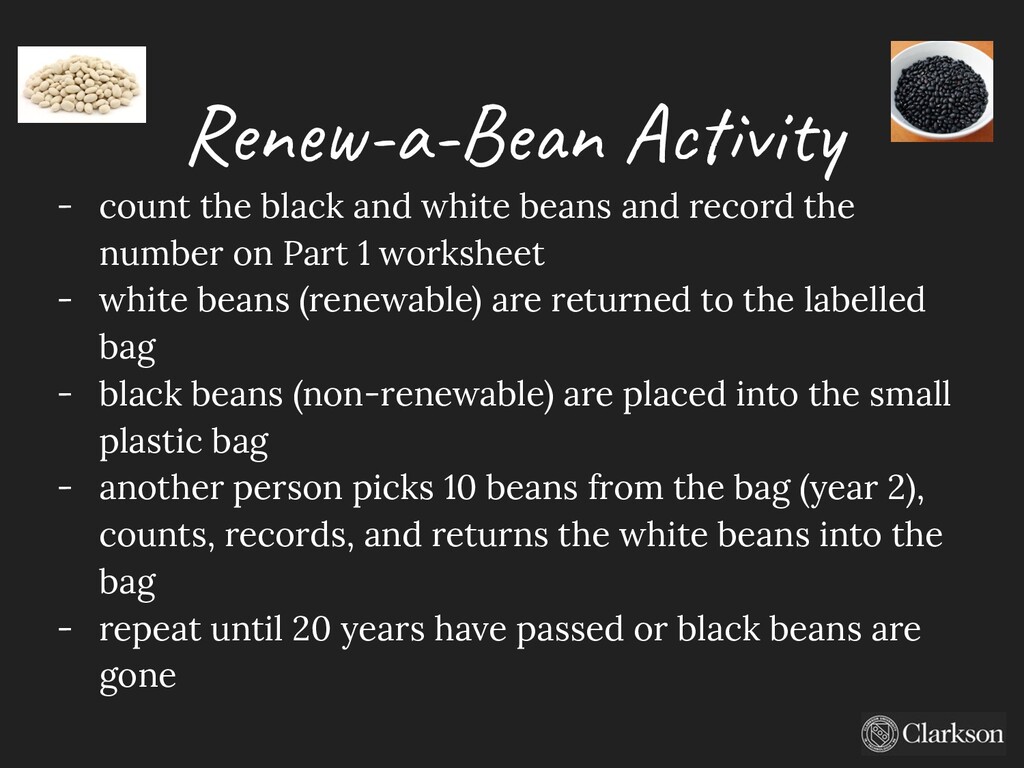
record the number on Part 1 worksheet - white beans (renewable) are returned to the labelled bag - black beans (non-renewable) are placed into the small plastic bag - another person picks 10 beans from the bag (year 2), counts, records, and returns the white beans into the bag - repeat until 20 years have passed or black beans are gone
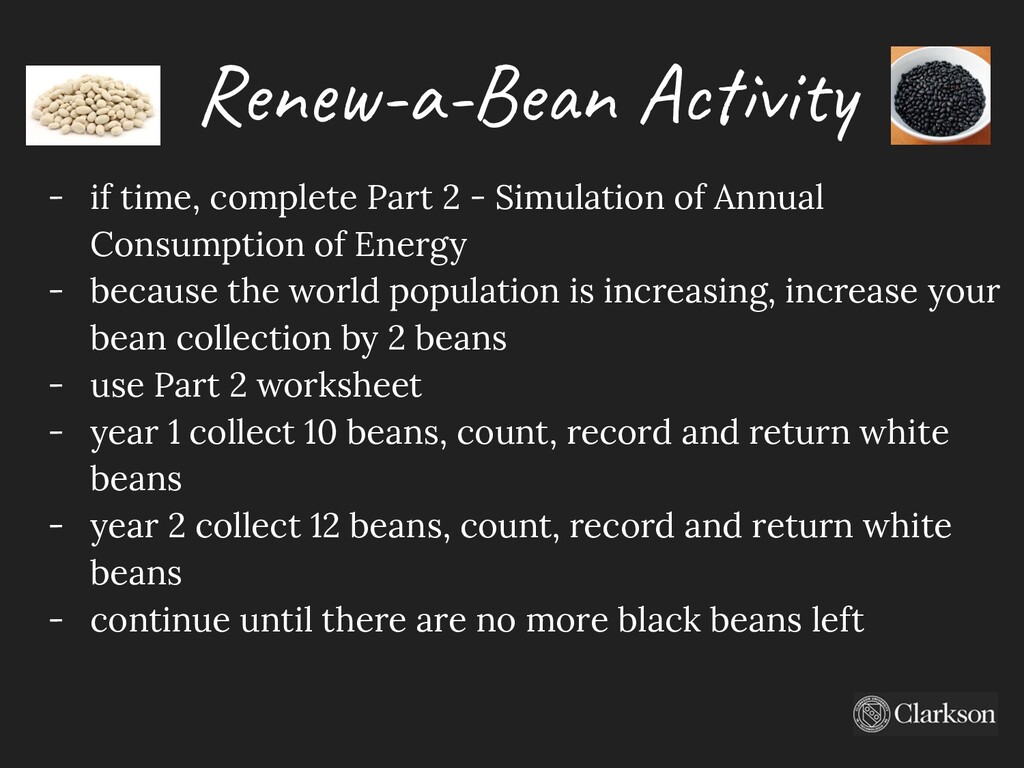
Consumption of Energy - because the world population is increasing, increase your bean collection by 2 beans - use Part 2 worksheet - year 1 collect 10 beans, count, record and return white beans - year 2 collect 12 beans, count, record and return white beans - continue until there are no more black beans left Renew-a-Bean Activity
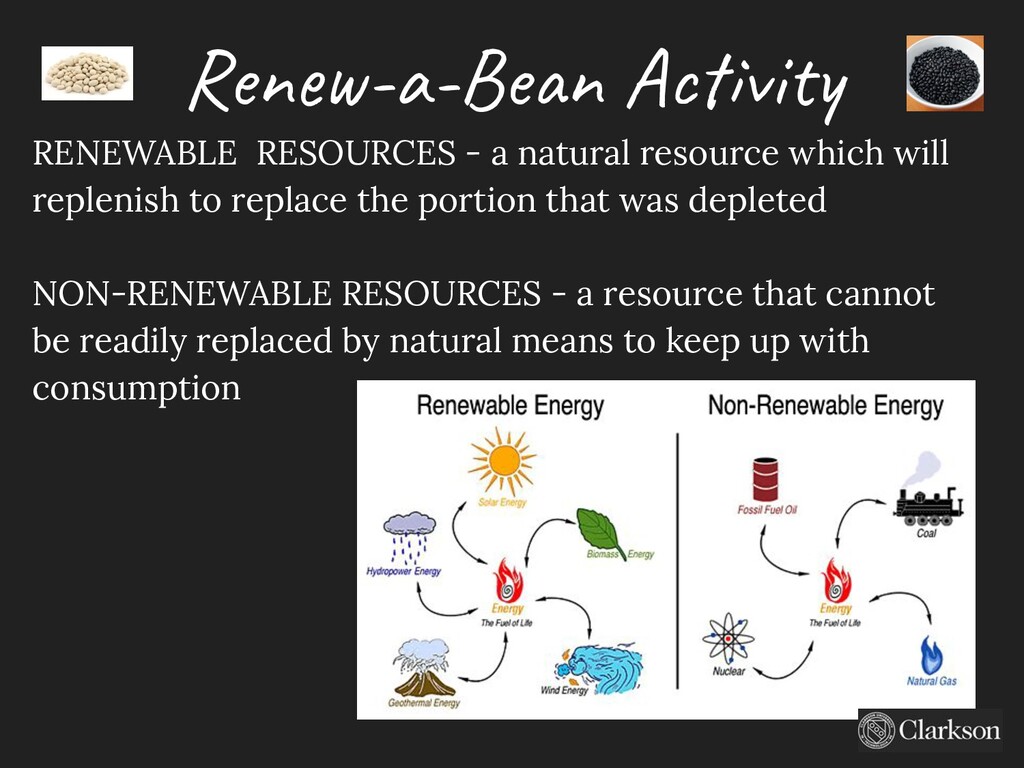
replenish to replace the portion that was depleted NON-RENEWABLE RESOURCES - a resource that cannot be readily replaced by natural means to keep up with consumption
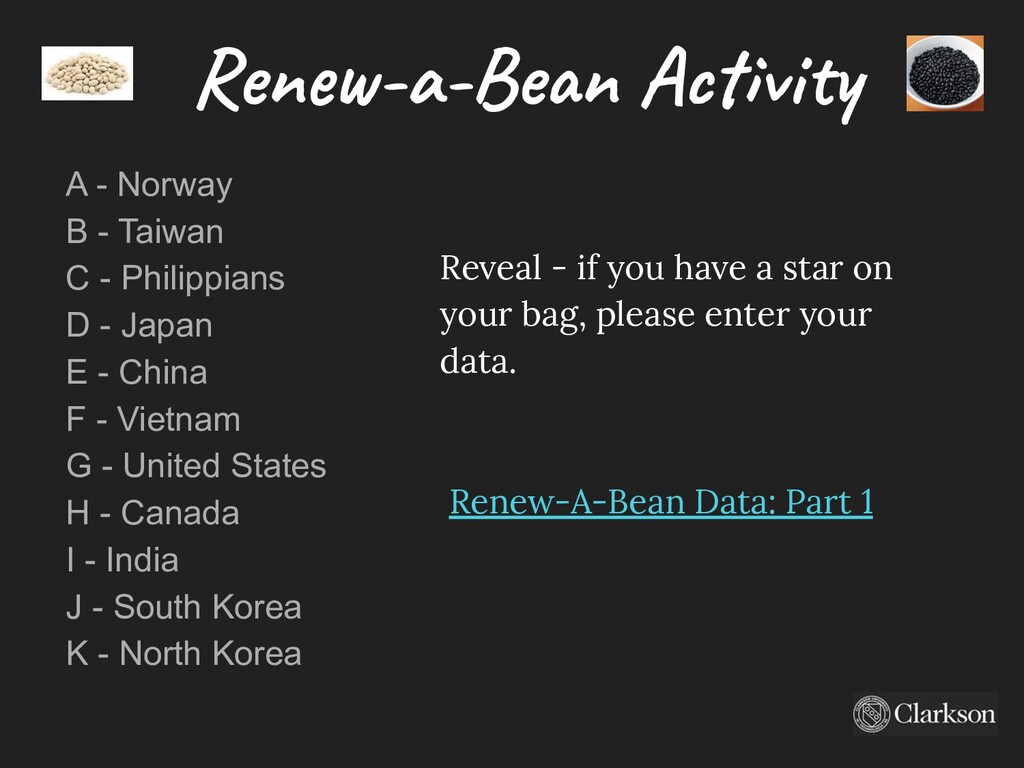
please enter your data. Renew-A-Bean Data: Part 1 Renew-a-Bean Activity A - Norway B - Taiwan C - Philippians D - Japan E - China F - Vietnam G - United States H - Canada I - India J - South Korea K - North Korea
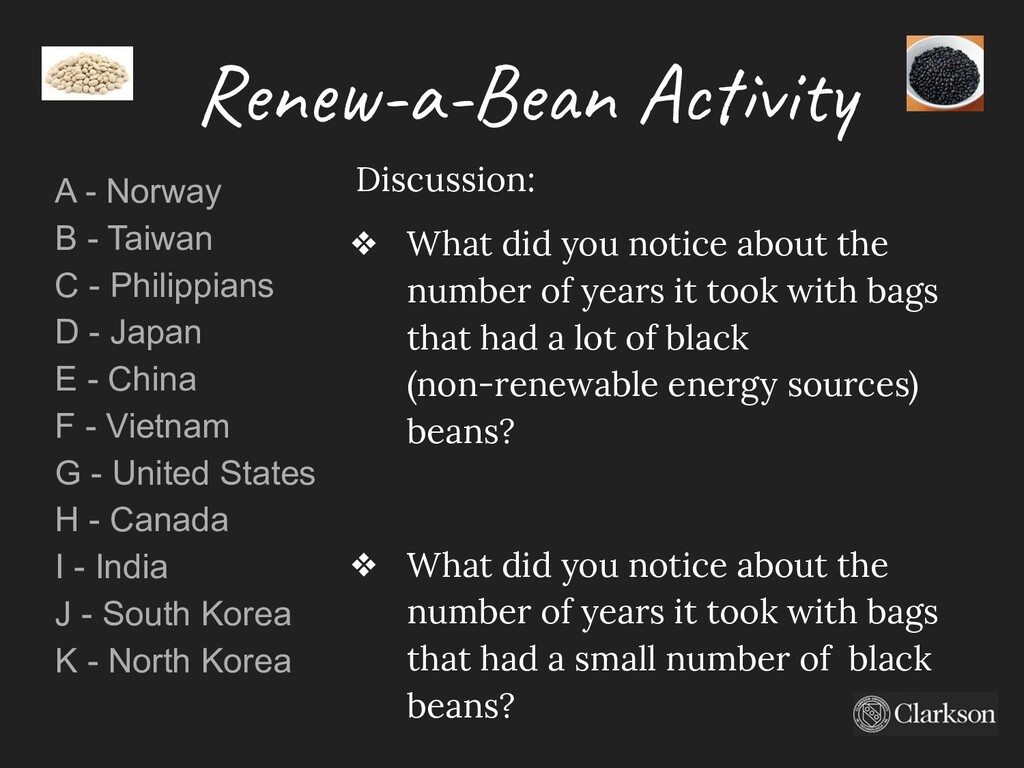
years it took with bags that had a lot of black (non-renewable energy sources) beans? ❖ What did you notice about the number of years it took with bags that had a small number of black beans? Renew-a-Bean Activity A - Norway B - Taiwan C - Philippians D - Japan E - China F - Vietnam G - United States H - Canada I - India J - South Korea K - North Korea
A Norway 98 2 B Taiwan 4 96 C Philippinas 24 76 D Japan 15 85 E China 25 75 F Vietnam 39 61 G United States 15 85 H Canada 65 35 I India 17 83 J South Korea 3 97 K North Korea 76 24 Let’s put that in order ……….…..
2 K North Korea 76 24 H Canada 65 35 F Vietnam 39 61 E China 25 75 C Philippians 24 76 I India 17 83 D Japan 15 85 G United States 15 85 B Taiwan 4 96 J South Korea 3 97
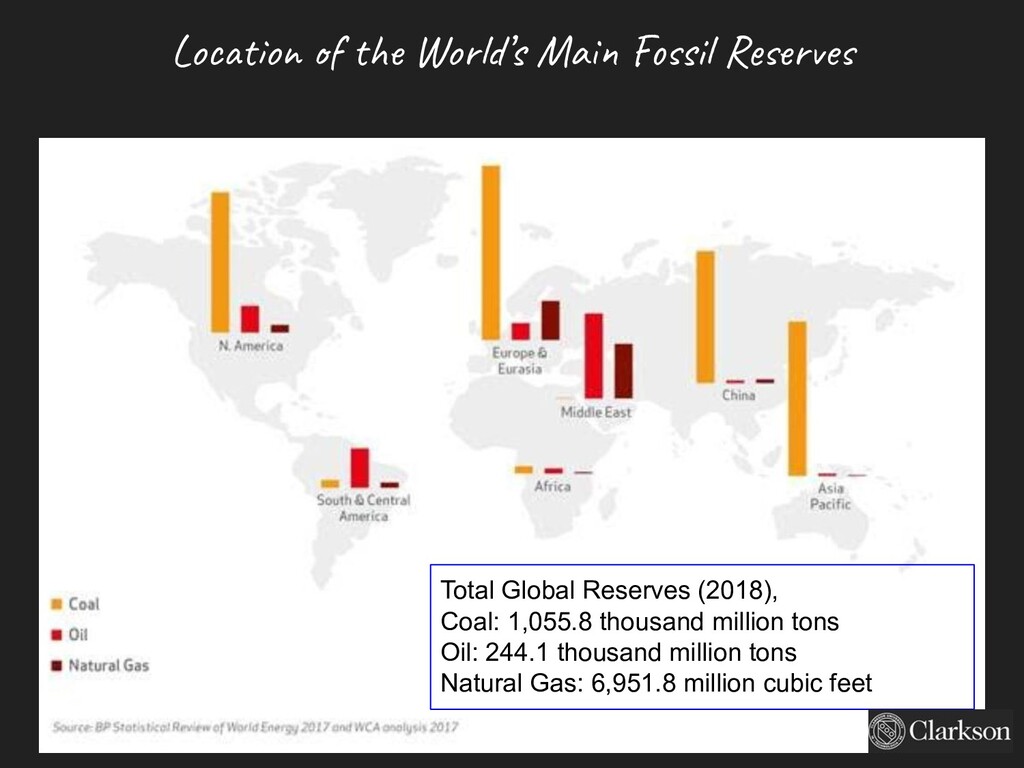
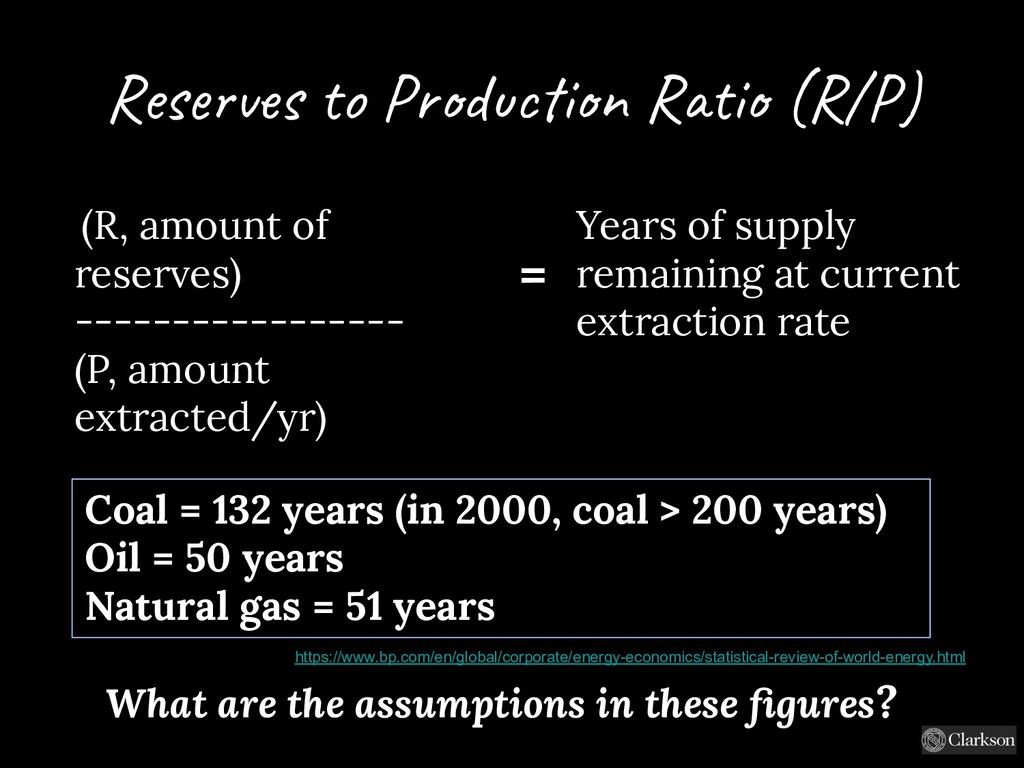
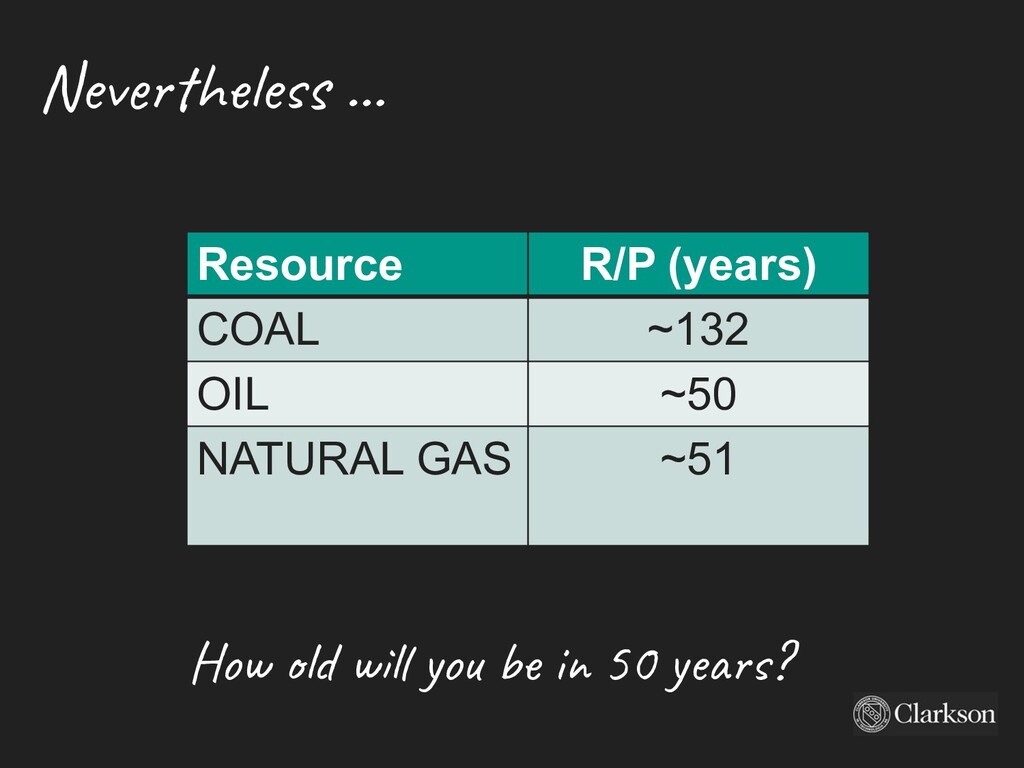
(P, amount extracted/yr) Years of supply remaining at current extraction rate = Coal = 132 years (in 2000, coal > 200 years) Oil = 50 years Natural gas = 51 years What are the assumptions in these figures? https://www.bp.com/en/global/corporate/energy-economics/statistical-review-of-world-energy.html
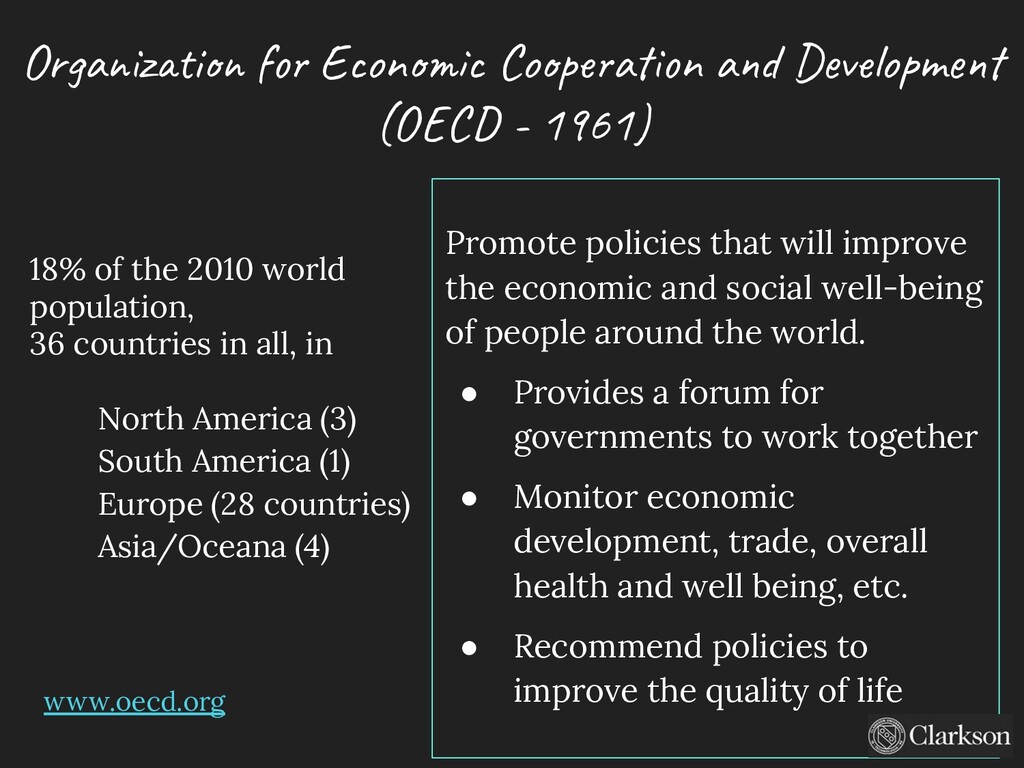
of the 2010 world population, 36 countries in all, in North America (3) South America (1) Europe (28 countries) Asia/Oceana (4) Promote policies that will improve the economic and social well-being of people around the world. • Provides a forum for governments to work together • Monitor economic development, trade, overall health and well being, etc. • Recommend policies to improve the quality of life www.oecd.org
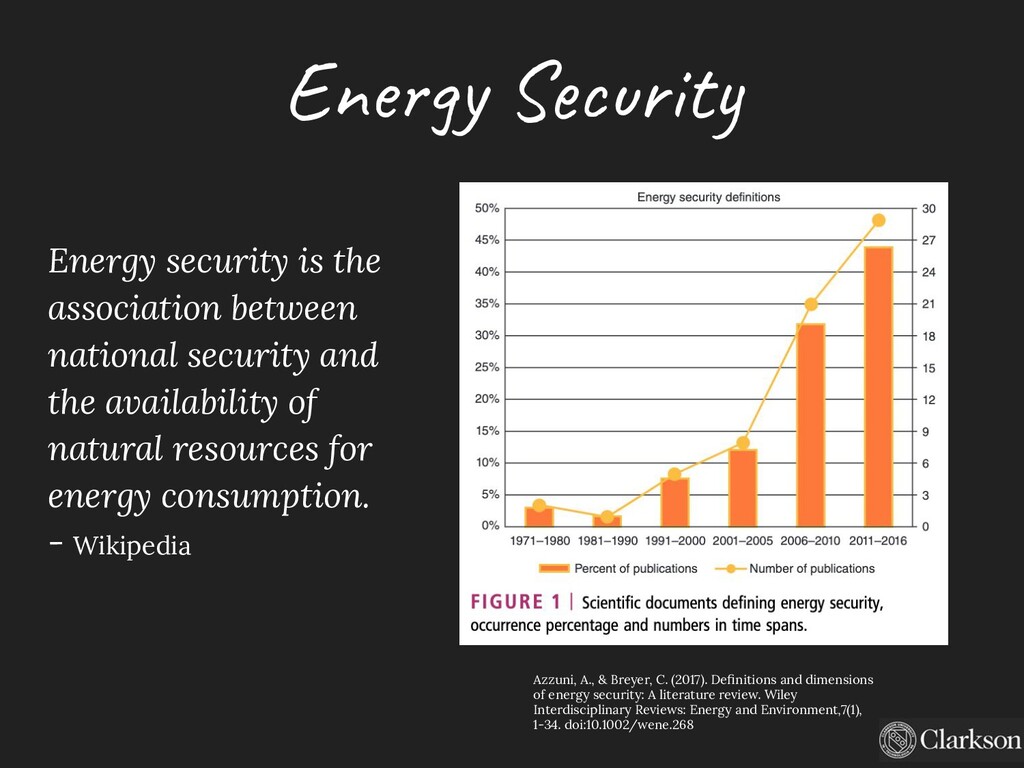
and the availability of natural resources for energy consumption. - Wikipedia Azzuni, A., & Breyer, C. (2017). Definitions and dimensions of energy security: A literature review. Wiley Interdisciplinary Reviews: Energy and Environment,7(1), 1-34. doi:10.1002/wene.268
Environment Health Culture Literacy Employment Policy Military Dimensions & Parameters Azzuni, A., & Breyer, C. (2017). Definitions and dimensions of energy security: A literature review. Wiley Interdisciplinary Reviews: Energy and Environment,7(1), 1-34. doi:10.1002/wene.268
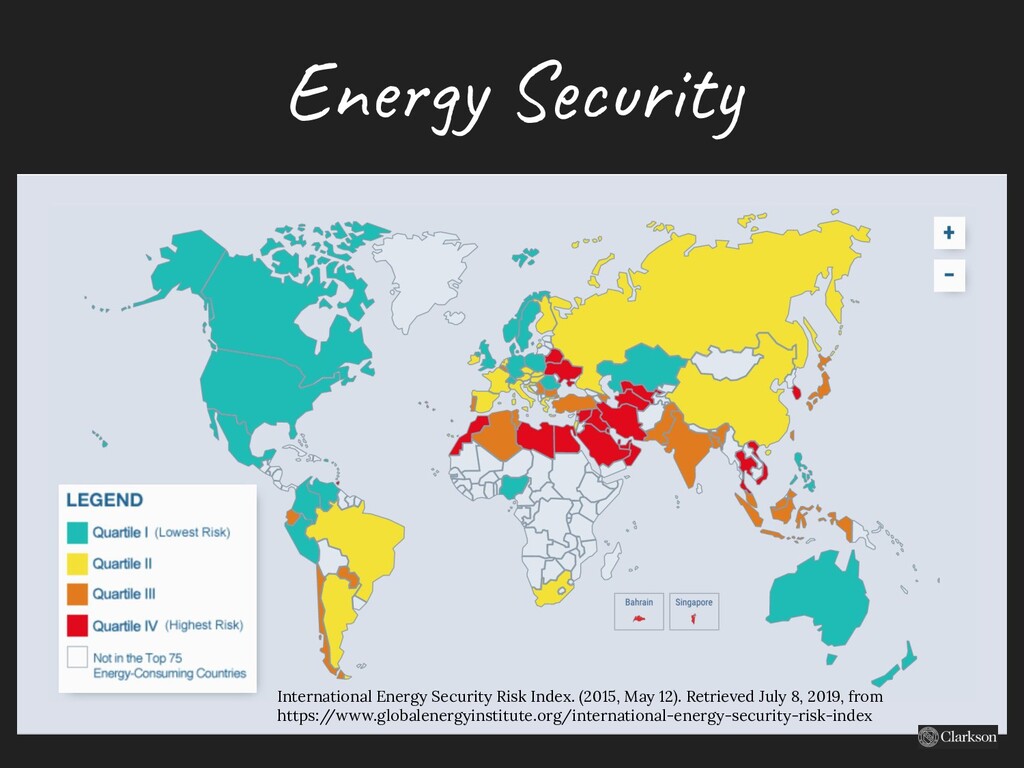
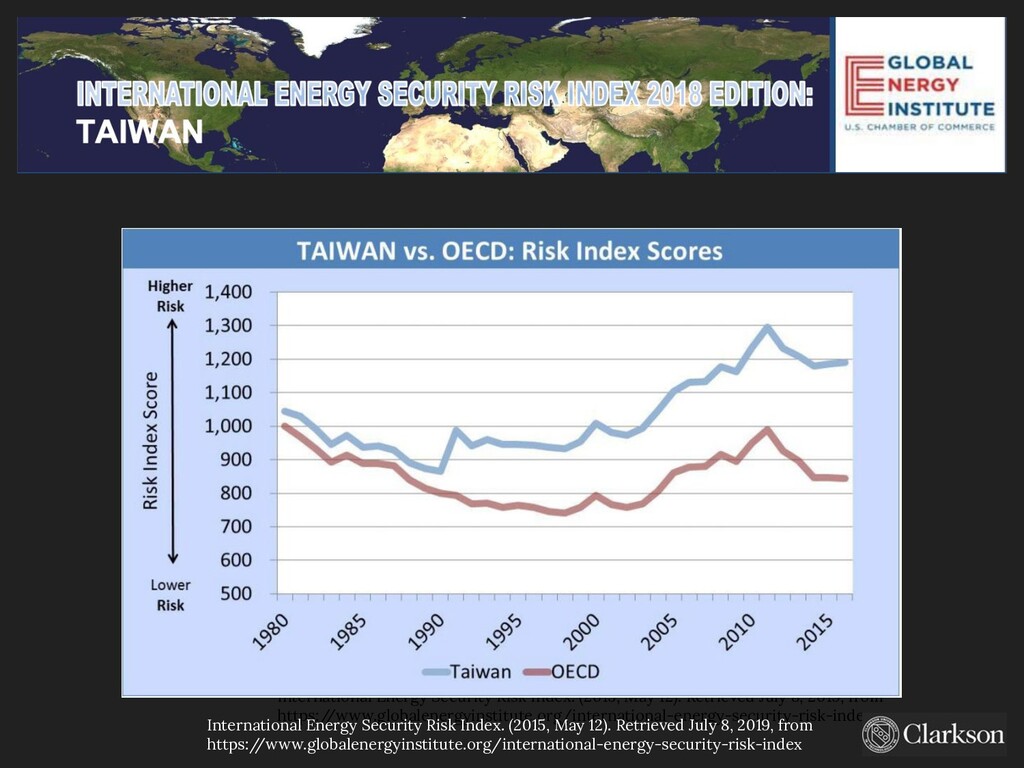
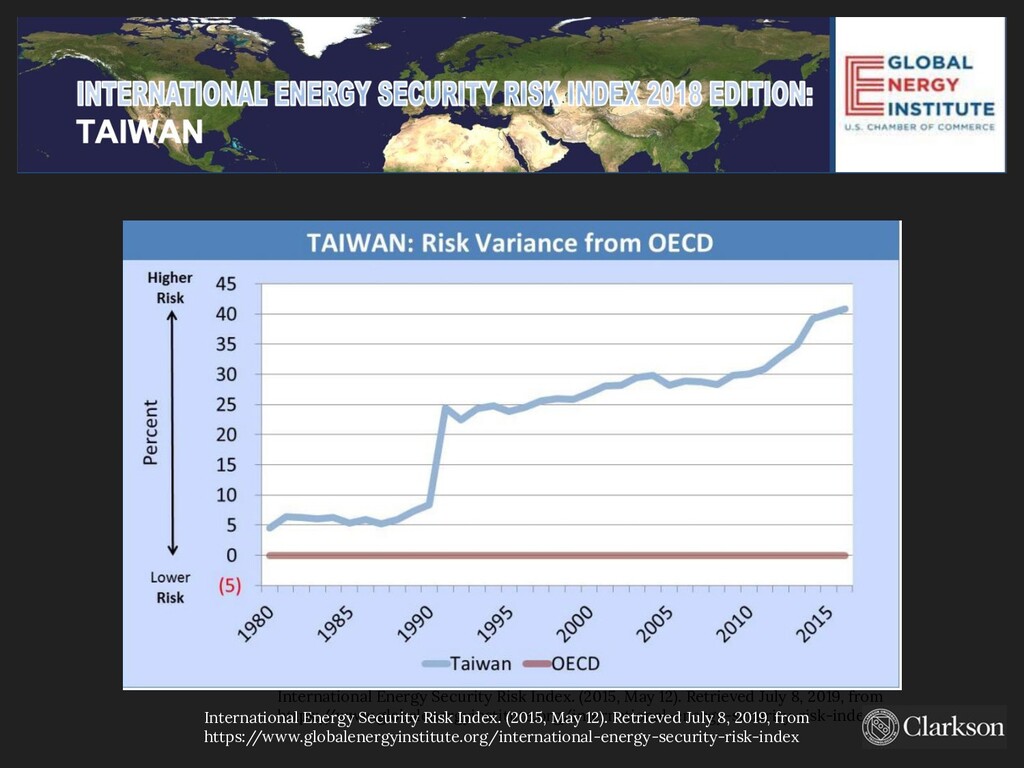
8, 2019, from https:/ /www.globalenergyinstitute.org/international-energy-security-risk-index International Energy Security Risk Index. (2015, May 12). Retrieved July 8, 2019, from https:/ /www.globalenergyinstitute.org/international-energy-security-risk-index
8, 2019, from https:/ /www.globalenergyinstitute.org/international-energy-security-risk-index International Energy Security Risk Index. (2015, May 12). Retrieved July 8, 2019, from https:/ /www.globalenergyinstitute.org/international-energy-security-risk-index
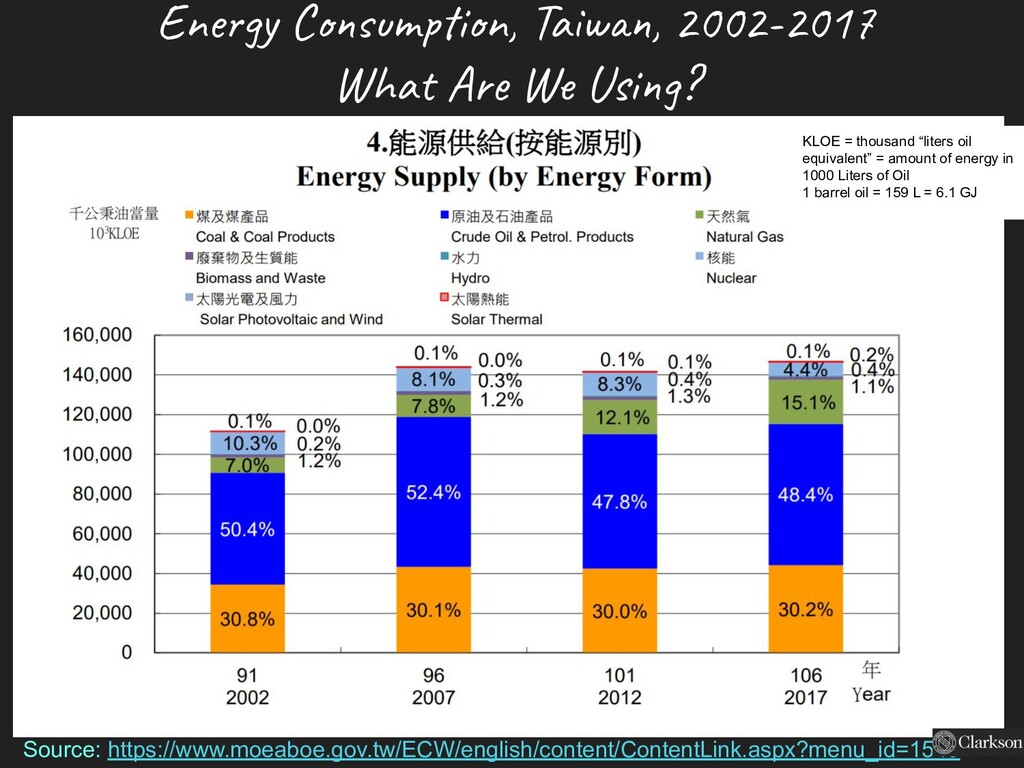
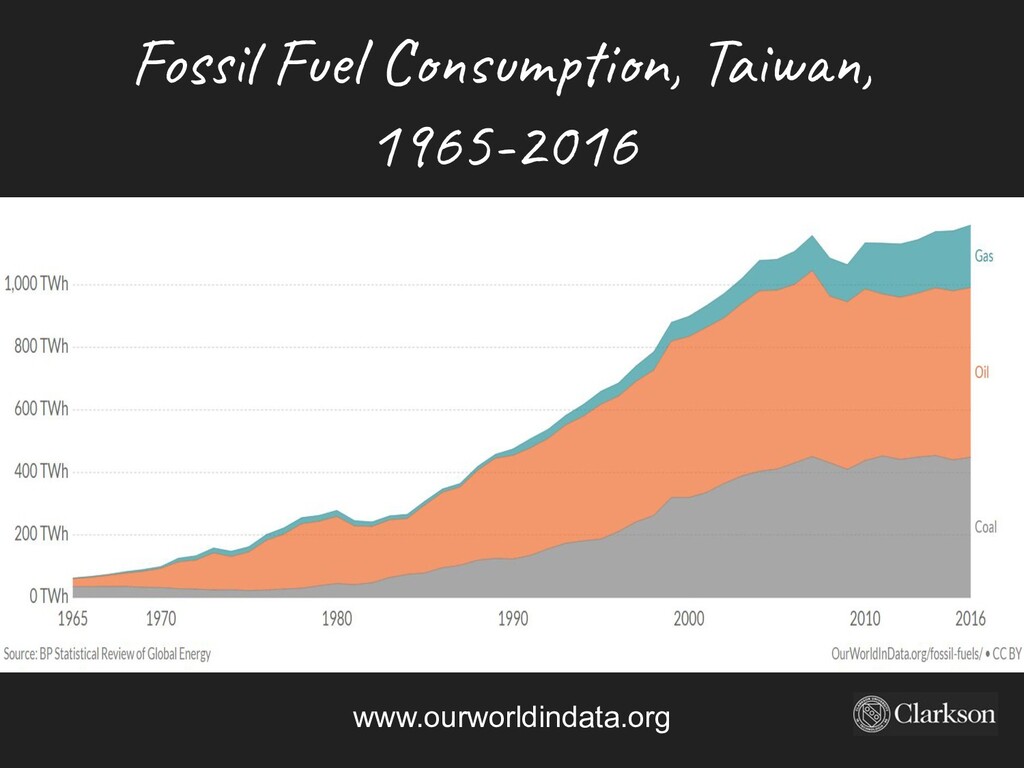
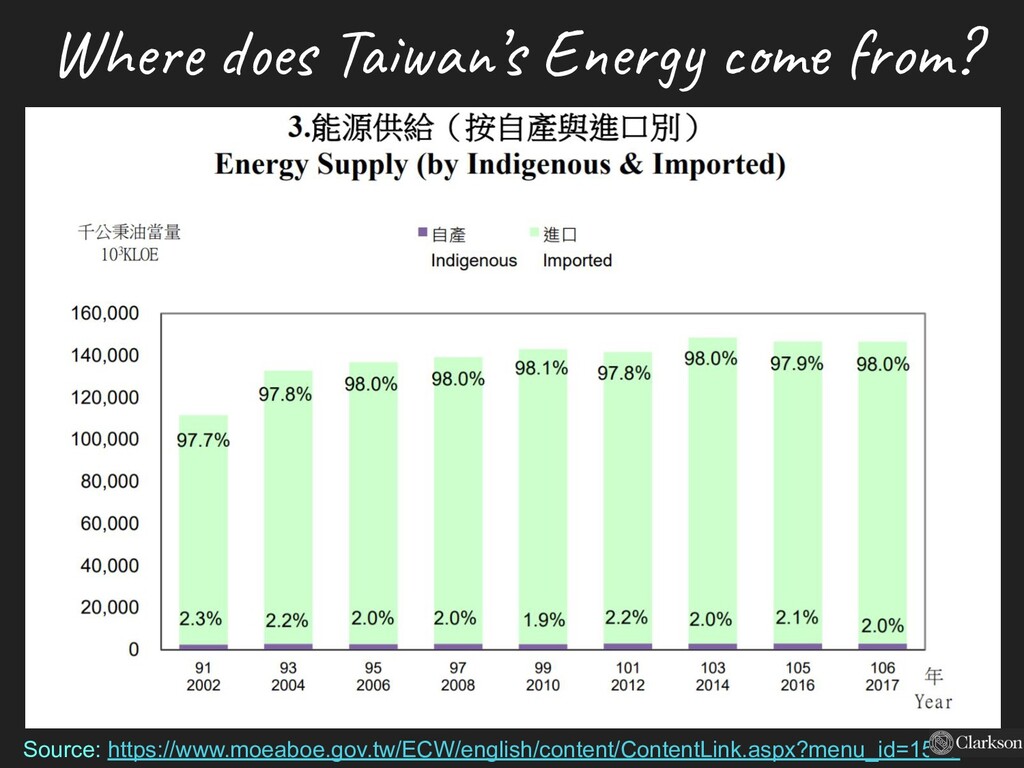
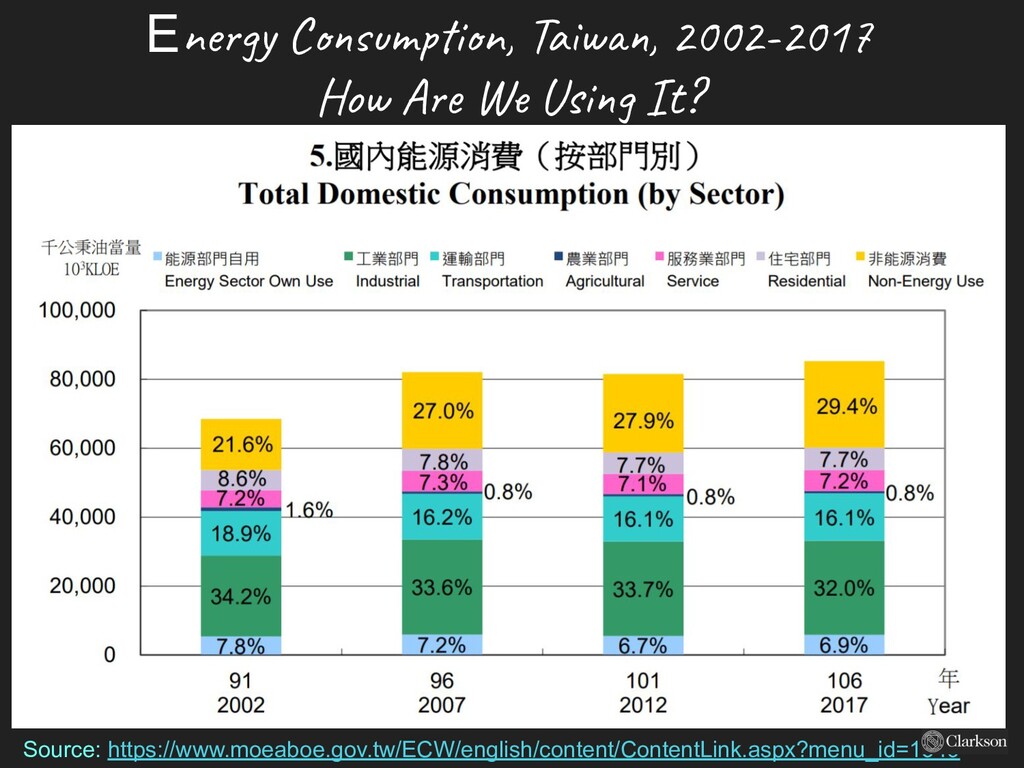
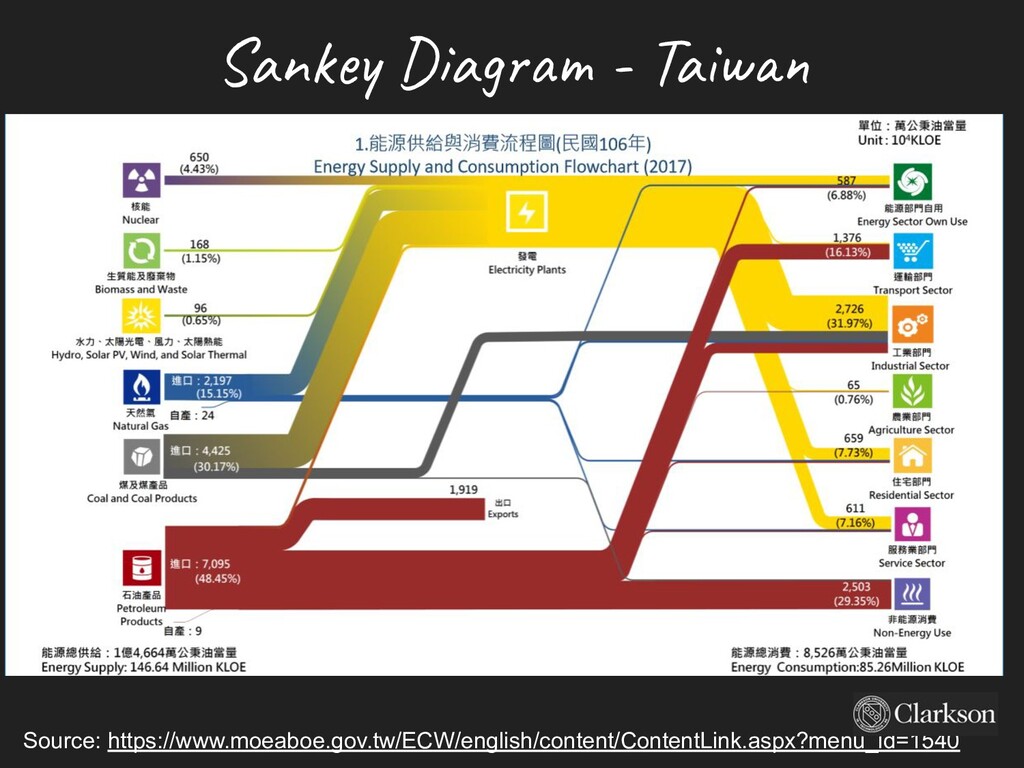
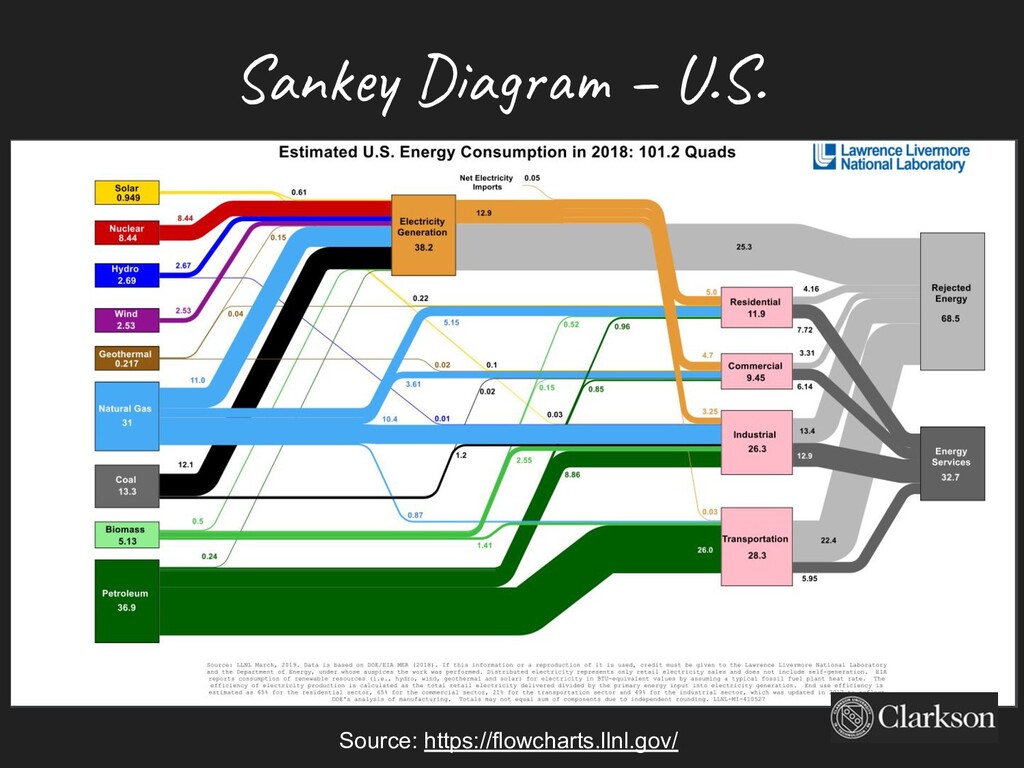
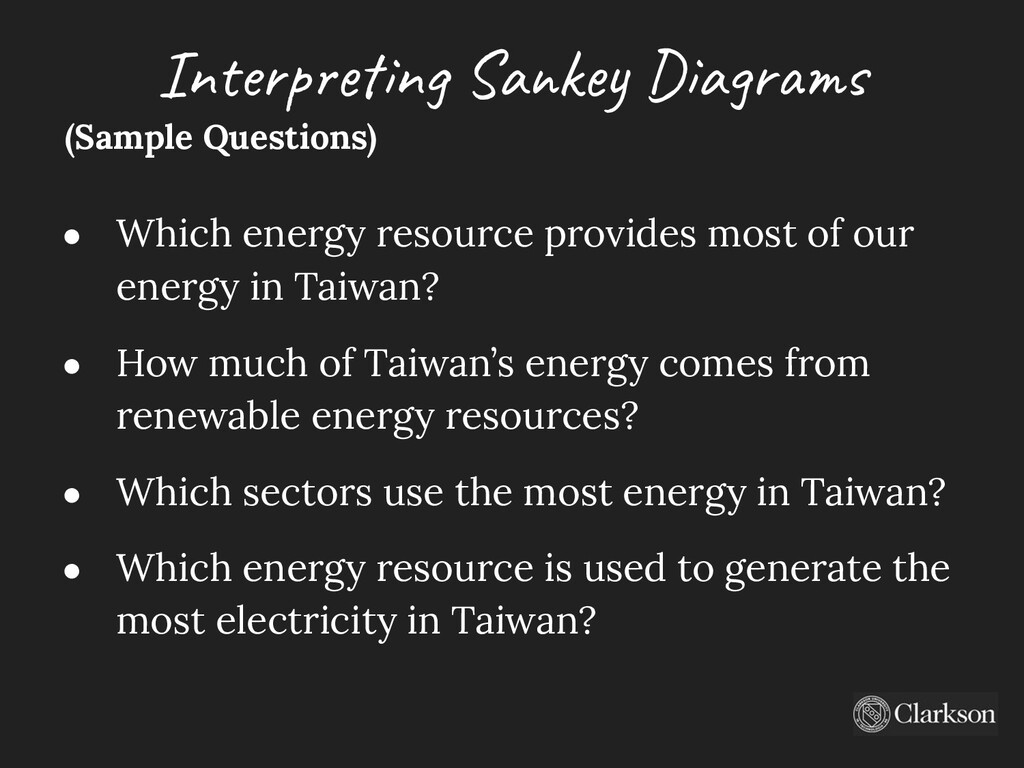
most of our energy in Taiwan? • How much of Taiwan’s energy comes from renewable energy resources? • Which sectors use the most energy in Taiwan? • Which energy resource is used to generate the most electricity in Taiwan?
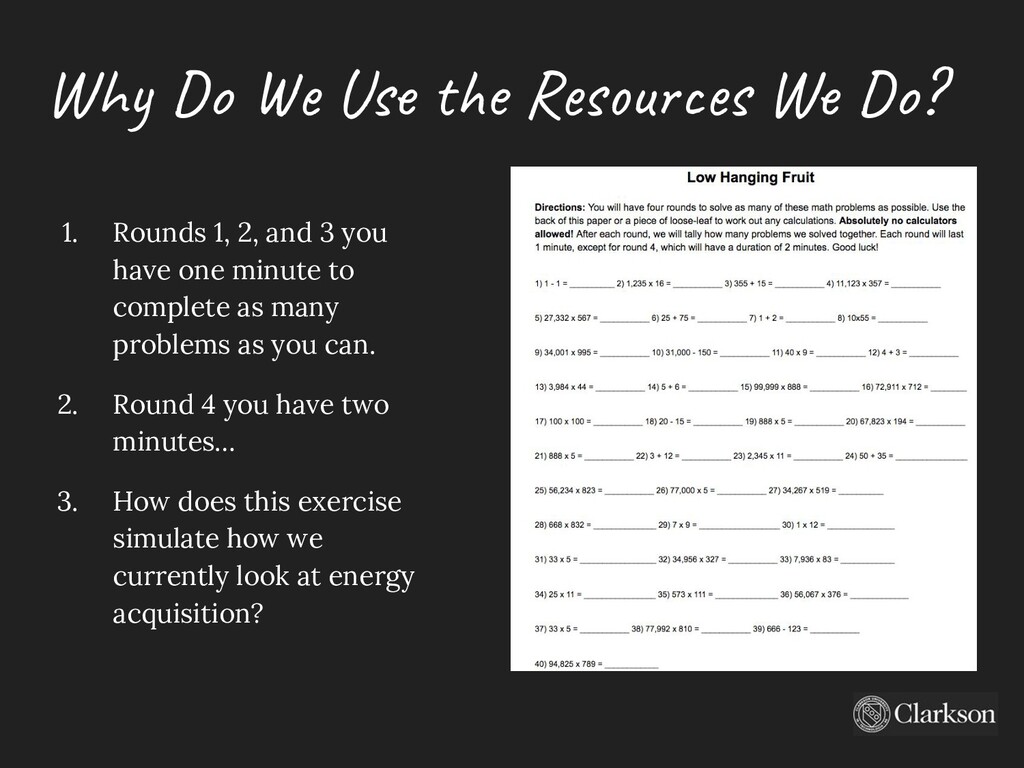
1, 2, and 3 you have one minute to complete as many problems as you can. 2. Round 4 you have two minutes… 3. How does this exercise simulate how we currently look at energy acquisition?
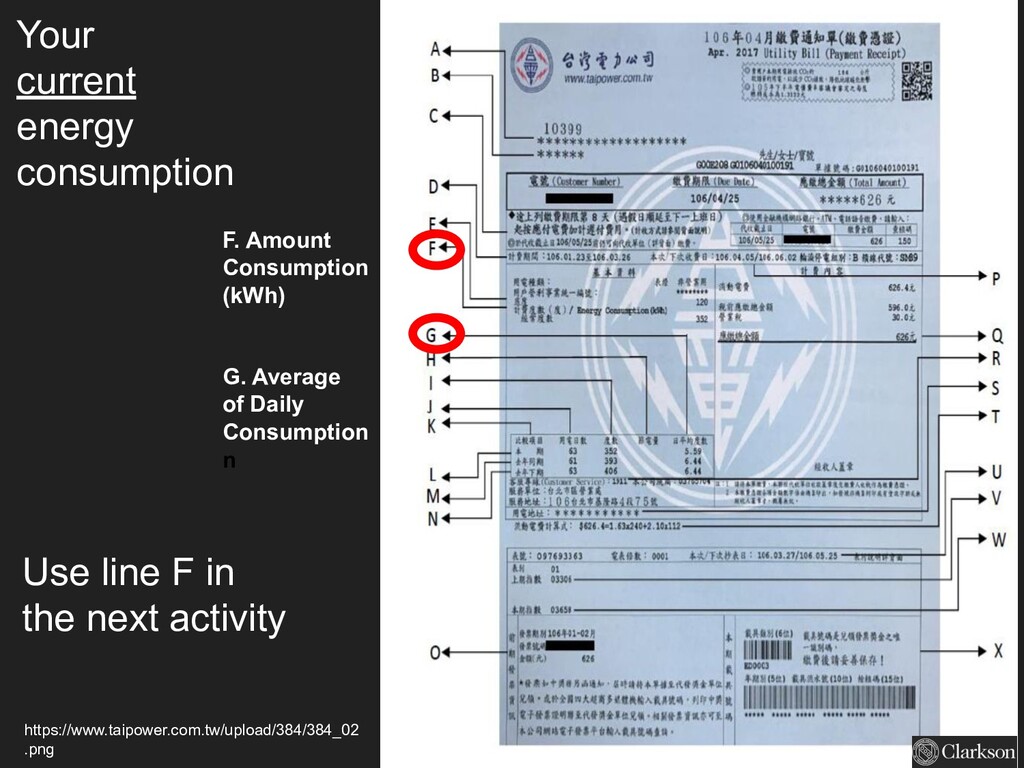
you brought from home. 2. Look at lines F and G. 3. The Taiwan Power Company has helpful links on their website to help you understand your electricity consumption. https:/ /www.taipower.com.tw /en/page.aspx?mid=393
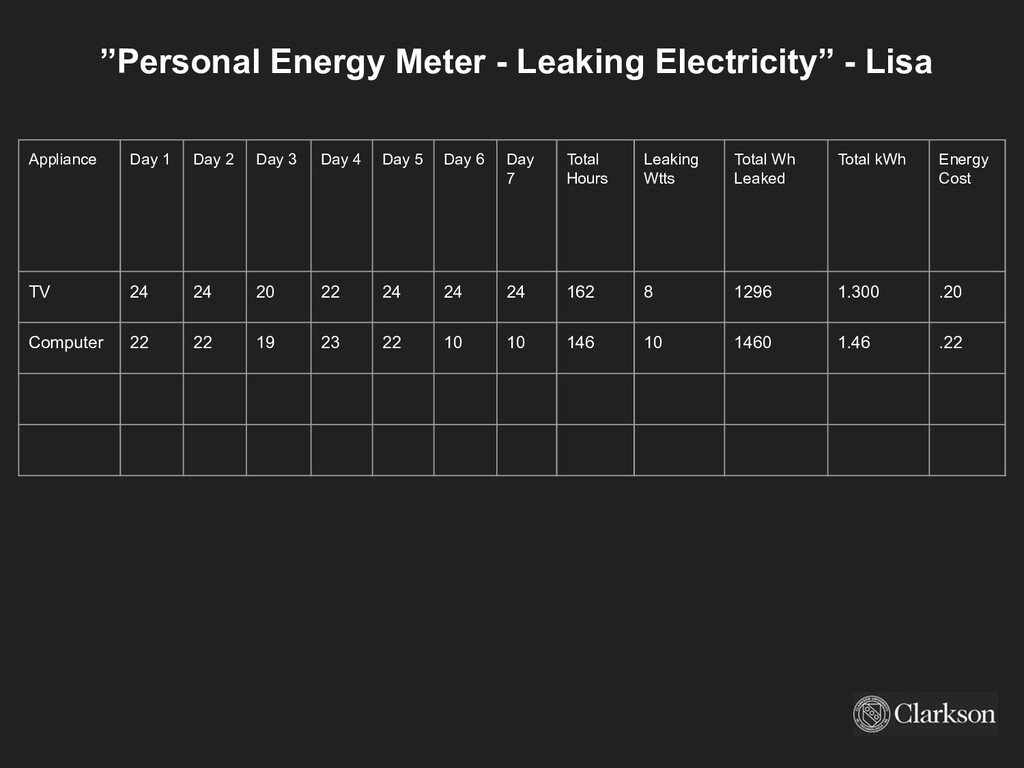
1 Day 2 Day 3 Day 4 Day 5 Day 6 Day 7 Total Hours Leaking Wtts Total Wh Leaked Total kWh Energy Cost TV 24 24 20 22 24 24 24 162 8 1296 1.300 .20 Computer 22 22 19 23 22 10 10 146 10 1460 1.46 .22
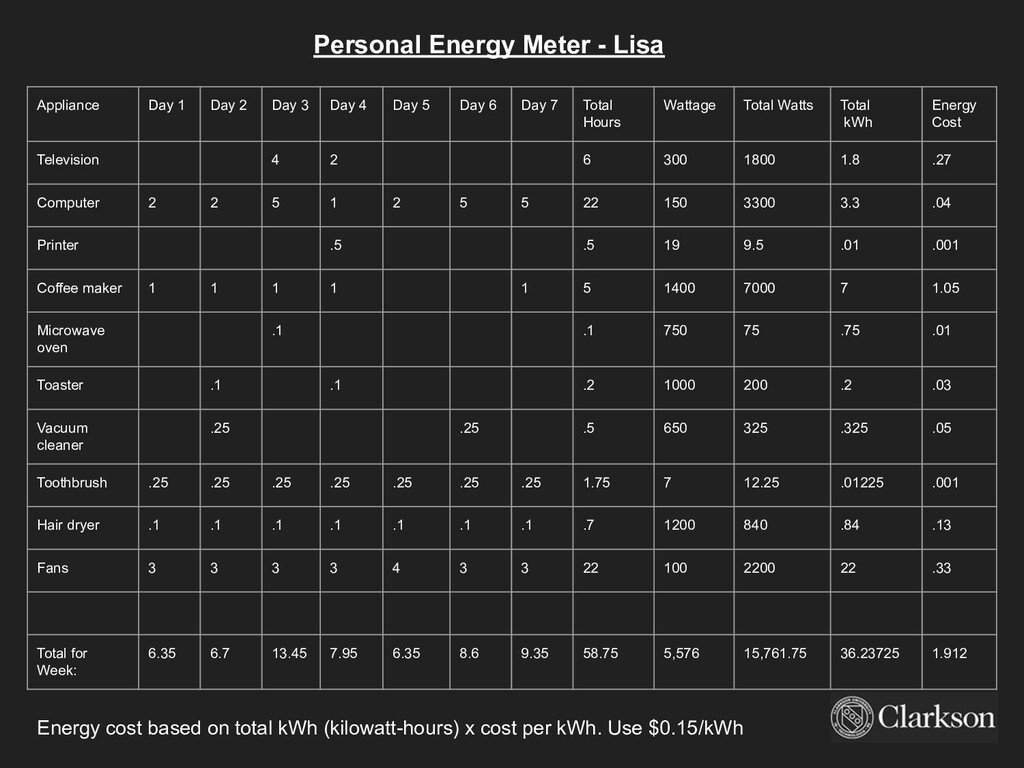
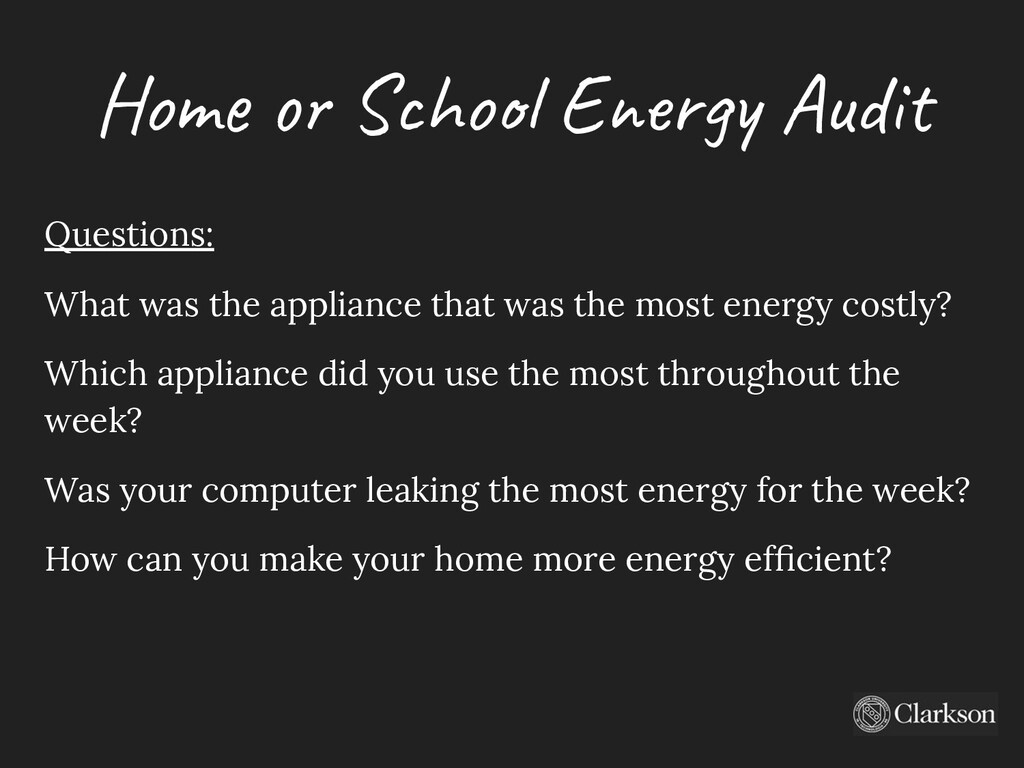
that was the most energy costly? Which appliance did you use the most throughout the week? Was your computer leaking the most energy for the week? How can you make your home more energy efficient?