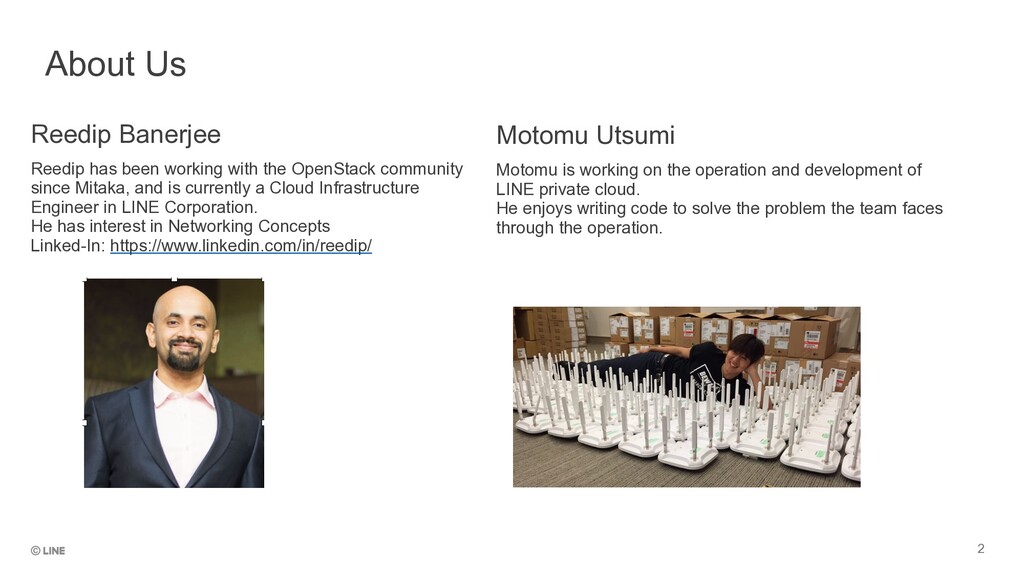
development of LINE private cloud. He enjoys writing code to solve the problem the team faces through the operation. Reedip Banerjee Reedip has been working with the OpenStack community since Mitaka, and is currently a Cloud Infrastructure Engineer in LINE Corporation. He has interest in Networking Concepts Linked-In: https://www.linkedin.com/in/reedip/ About Us
faced in LINE 3. What can be done to improve the situation 2. Introduction to oslo.metrics 1. What is oslo.metrics 2. Architecture 3. How we are using oslo.metrics 1. Metrics Visualisation 2. Troubleshooting 3. Metrics trend monitoring 3
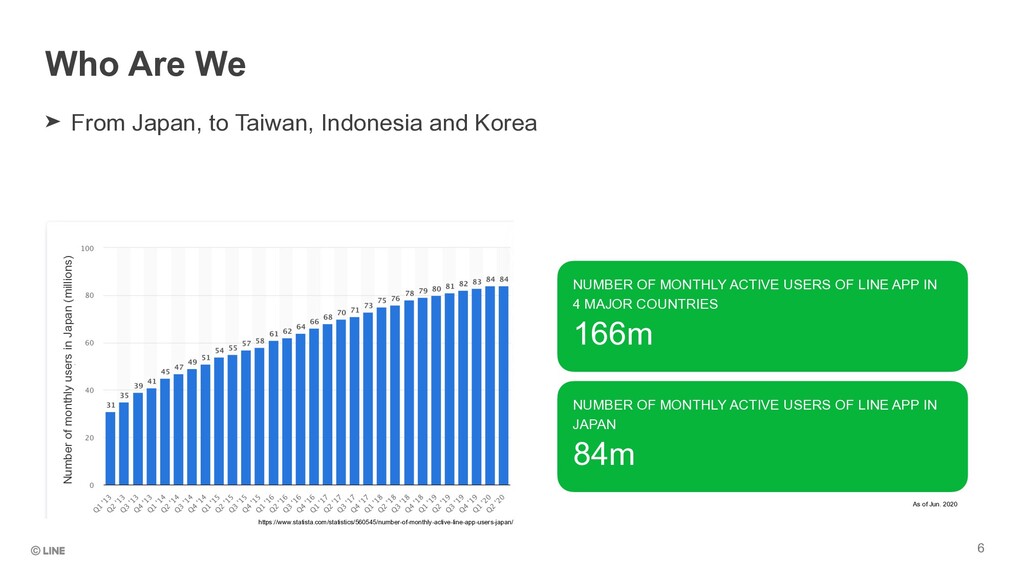
Korea 6 https://www.statista.com/statistics/560545/number-of-monthly-active-line-app-users-japan/ As of Jun. 2020 NUMBER OF MONTHLY ACTIVE USERS OF LINE APP IN 4 MAJOR COUNTRIES 166m NUMBER OF MONTHLY ACTIVE USERS OF LINE APP IN JAPAN 84m Number of monthly users in Japan (millions)
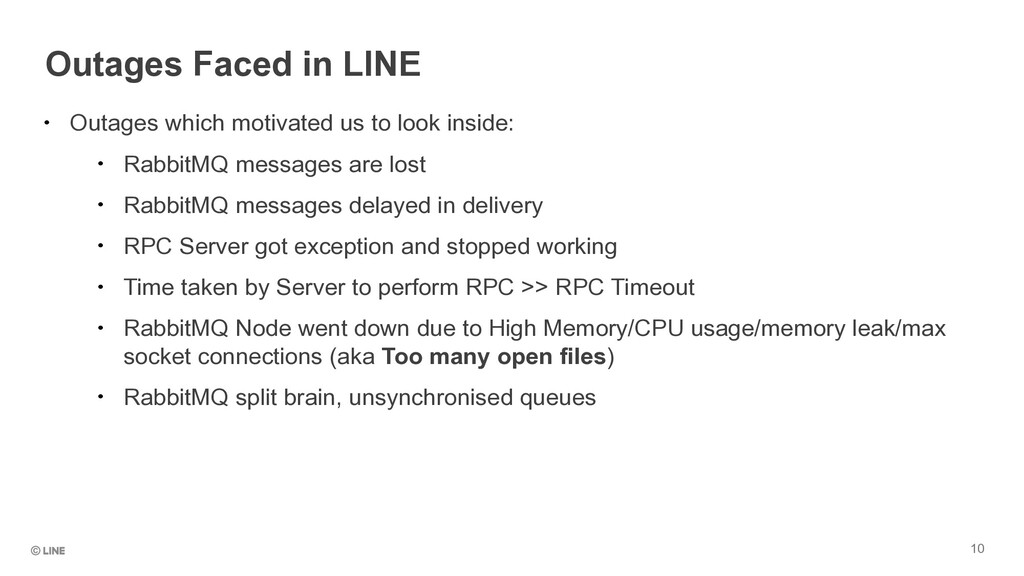
look inside: • RabbitMQ messages are lost • RabbitMQ messages delayed in delivery • RPC Server got exception and stopped working • Time taken by Server to perform RPC >> RPC Timeout • RabbitMQ Node went down due to High Memory/CPU usage/memory leak/max socket connections (aka Too many open files) • RabbitMQ split brain, unsynchronised queues 10
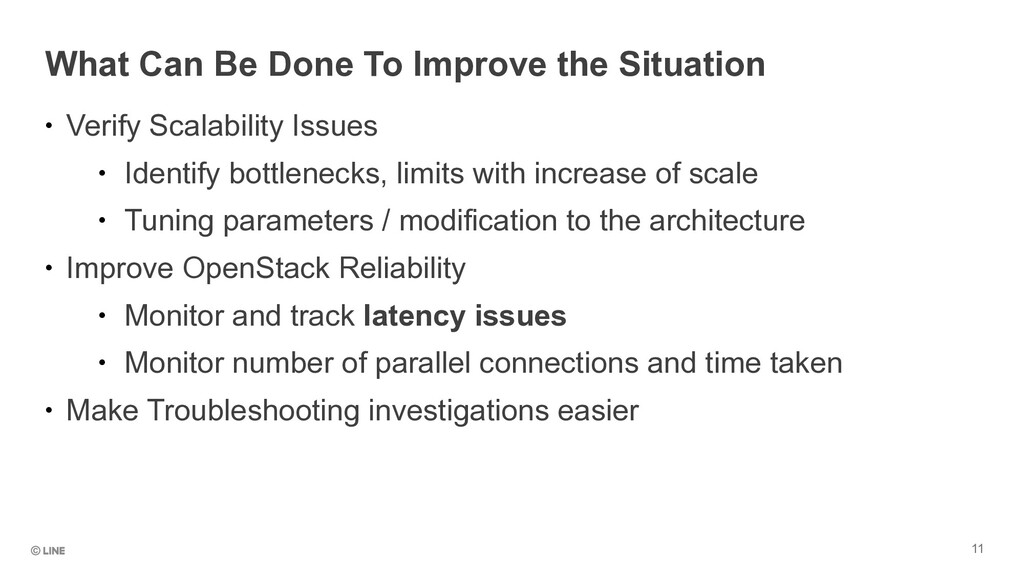
Scalability Issues • Identify bottlenecks, limits with increase of scale • Tuning parameters / modification to the architecture • Improve OpenStack Reliability • Monitor and track latency issues • Monitor number of parallel connections and time taken • Make Troubleshooting investigations easier 11
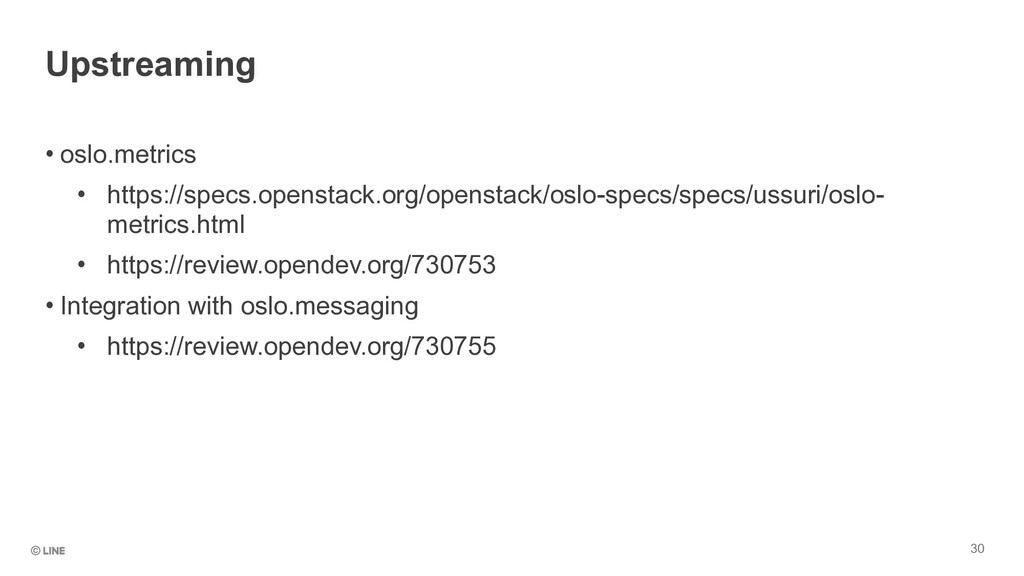
by the internal Oslo libraries ( oslo.messaging, oslo.db ) • Monitor Usage of Oslo libraries by Admin and Operators • Information of the number of RPC calls /API call • delta Change in the RPC calls/ delta Change in RPC time with increase/decrease in API Servers/Clients. • Similar to rpc_monitor’s implementation for oslo.messaging, but adaptable to other Oslo libraries as well 13
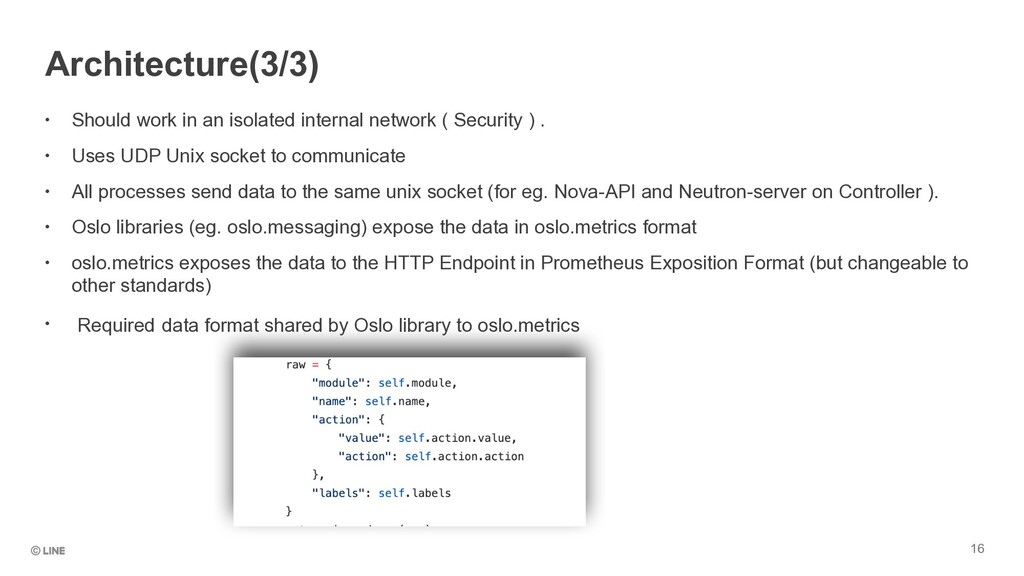
Security ) . • Uses UDP Unix socket to communicate • All processes send data to the same unix socket (for eg. Nova-API and Neutron-server on Controller ). • Oslo libraries (eg. oslo.messaging) expose the data in oslo.metrics format • oslo.metrics exposes the data to the HTTP Endpoint in Prometheus Exposition Format (but changeable to other standards) • Required data format shared by Oslo library to oslo.metrics 16
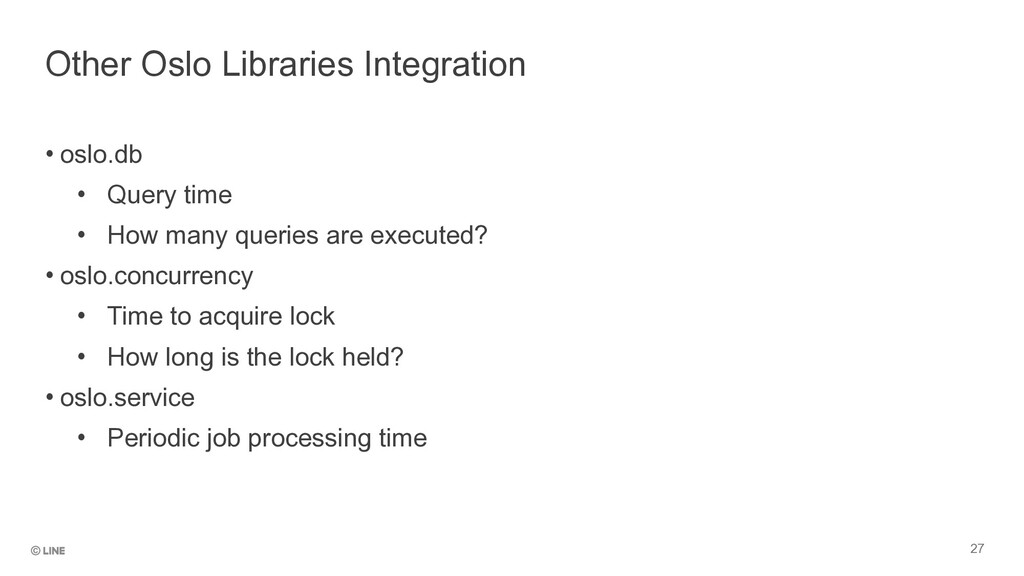
executed? • oslo.concurrency • Time to acquire lock • How long is the lock held? • oslo.service • Periodic job processing time 27 Other Oslo Libraries Integration
![Architecture(1/3) • Oslo libraries -> oslo.metrics -> Prometheus [1] 14](https://files.speakerdeck.com/presentations/51b884066b424853a4751eeefa7fa7e1/slide_13.jpg)