Upgrade to Pro — share decks privately, control downloads, hide ads and more …

Benchmarking Pusher using Node.js

Benchmarking Pusher using Node.js

London Node.js User Group

Paweł Ledwoń

November 28, 2012
Tweet

More Decks by Paweł Ledwoń

Other Decks in Programming

Transcript

  1. OVERVIEW Why we do this Evolution of our approach Architecture

    of our framework What we learned about Node.js No Memes
  2. FIND LIMITS ESTIMATE HARDWARE NEEDS CHECK HIGH-LOAD STABILITY TEST SOFTWARE

    UPDATES FIND OPTIMAL HARDWARE GAIN MORE CONFIDENCE GET NUMBERS FOR CUSTOMERS
  3. THIS IS HOW MOST TESTS LOOK LIKE 1. write a

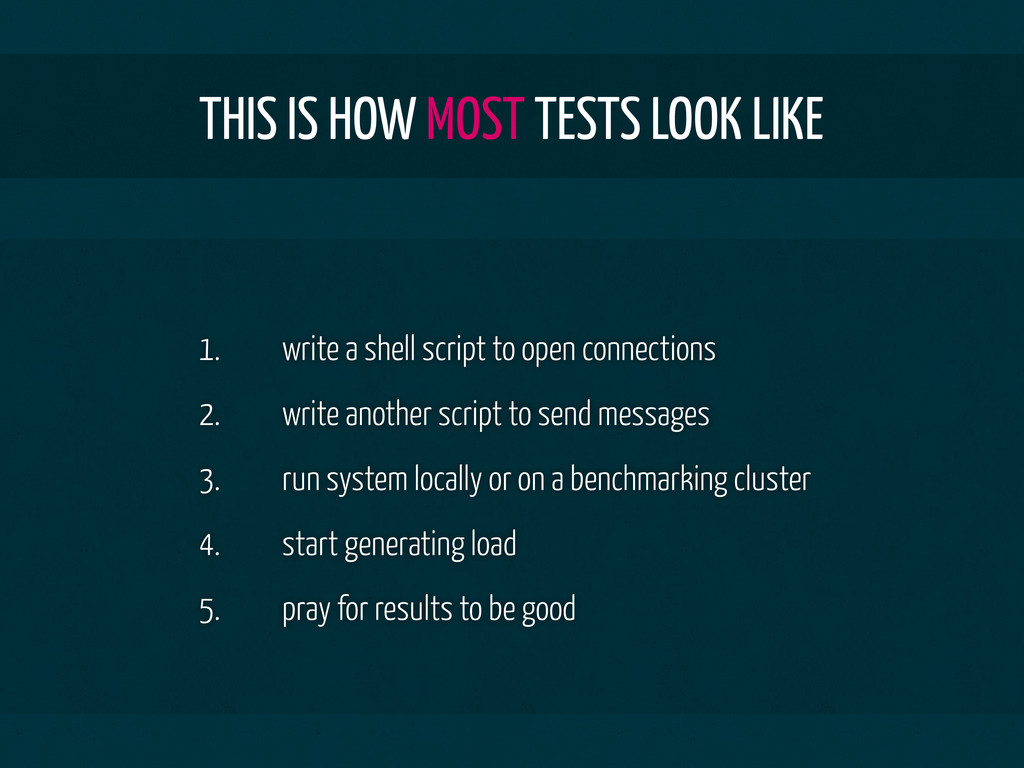
    shell script to open connections 2. write another script to send messages 3. run system locally or on a benchmarking cluster 4. start generating load 5. pray for results to be good
  4. WHAT IF SOMETHING BREAKS? 1. first thought: what happened? 2.

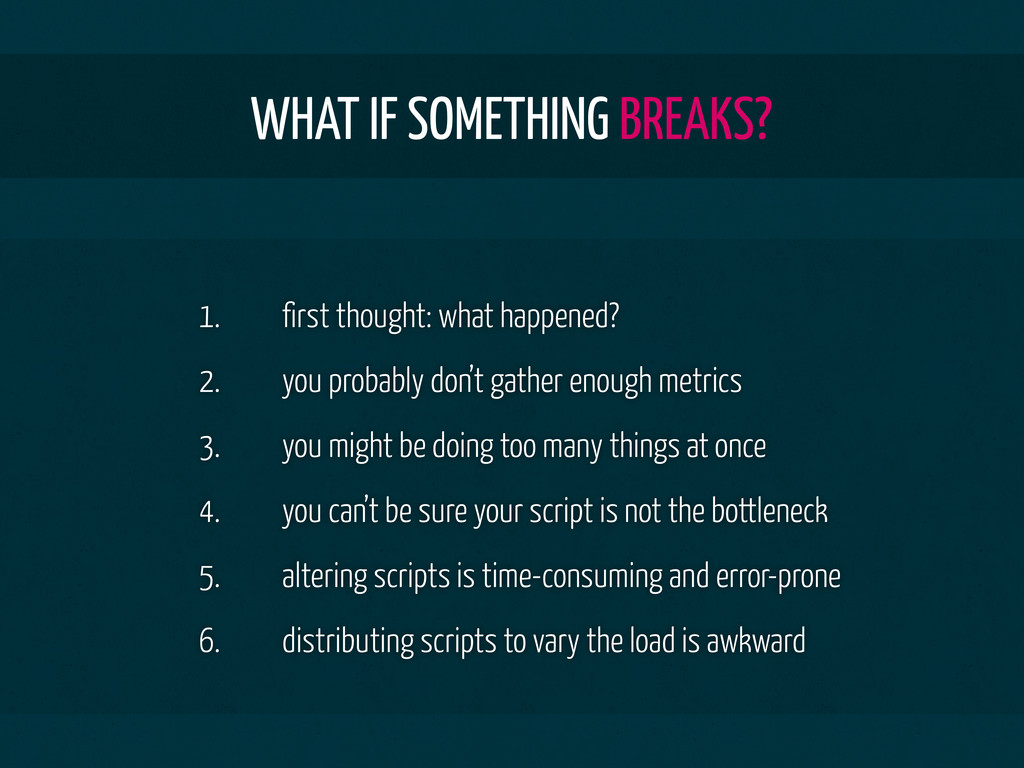
    you probably don’t gather enough metrics 3. you might be doing too many things at once 4. you can’t be sure your script is not the bottleneck 5. altering scripts is time-consuming and error-prone 6. distributing scripts to vary the load is awkward
  5. SO MANY THINGS TO GO WRONG EC2 PERFORMANCE NODE.JS ISSUES

    CRAPPY IO GARBAGE COLLECTION SPOFS LOAD BALANCERS MISCONFIGURATION SLOW LIBRARIES BAD DAY LOGGING RUBY DAEMONS BUGS KERNEL …
  6. HOW CAN WE DEAL WITH ISSUES? unit testing integration testing

    micro-benchmarking macro-benchmarking ~ ~ we know a bit about testing software, right?
  7. MICRO-BENCHMARKS prove that components work avoid dependencies are usually quick

    and simple are use-case specific don’t test glue code don’t catch side-effects
  8. MACRO-BENCHMARKS show that whole system performs test dependencies and side-effects

    can show things you never expected are difficult and time-consuming need systematic approach make finding some issues difficult
  9. EVOLUTION monolithic script ran manually local micro-benchmarks and spreadsheets distributed

    version of micro-benchmarks supervised workers automatic metric recording more types of benchmarks implementing indexer ???
  10. GOOD PRACTICES start with micro-benchmarks build them up to proper

    integration tests when in trouble, profile change one variable at a time monitor everything you can, seriously work on your graphs, text sucks
  11. WORKERS do the actual work send api requests listen on

    WebSocket connections gather client metrics have different roles (api, socket) independent of each other live outside of Pusher’s cluster
  12. api api socket socket socket api worker socket worker socket

    worker socket worker socket worker monitor monitor monitor monitor monitor
  13. api api socket socket socket supervisor api worker socket worker

    socket worker socket worker socket worker monitor monitor monitor monitor monitor
  14. api api socket socket socket supervisor api worker socket worker

    socket worker socket worker socket worker monitor monitor monitor monitor monitor
  15. REPORTING METRICS all workers report their data to logs JSON

    objects, basically no schema logs are streamed to a central place currently using just rsyslog
  16. api api socket socket socket supervisor api worker socket worker

    socket worker socket worker socket worker monitor monitor monitor monitor monitor logs
  17. INDEXER reads logs in real-time extracts and aggregates data stores

    indexed metrics in db… …which temporarily is Redis can update graphs using Pusher
  18. api api socket socket socket supervisor api worker socket worker

    socket worker socket worker socket worker monitor monitor monitor monitor monitor indexer logs
  19. BENCHMARK SPECIFICATION benchmark name number of connections number of channels

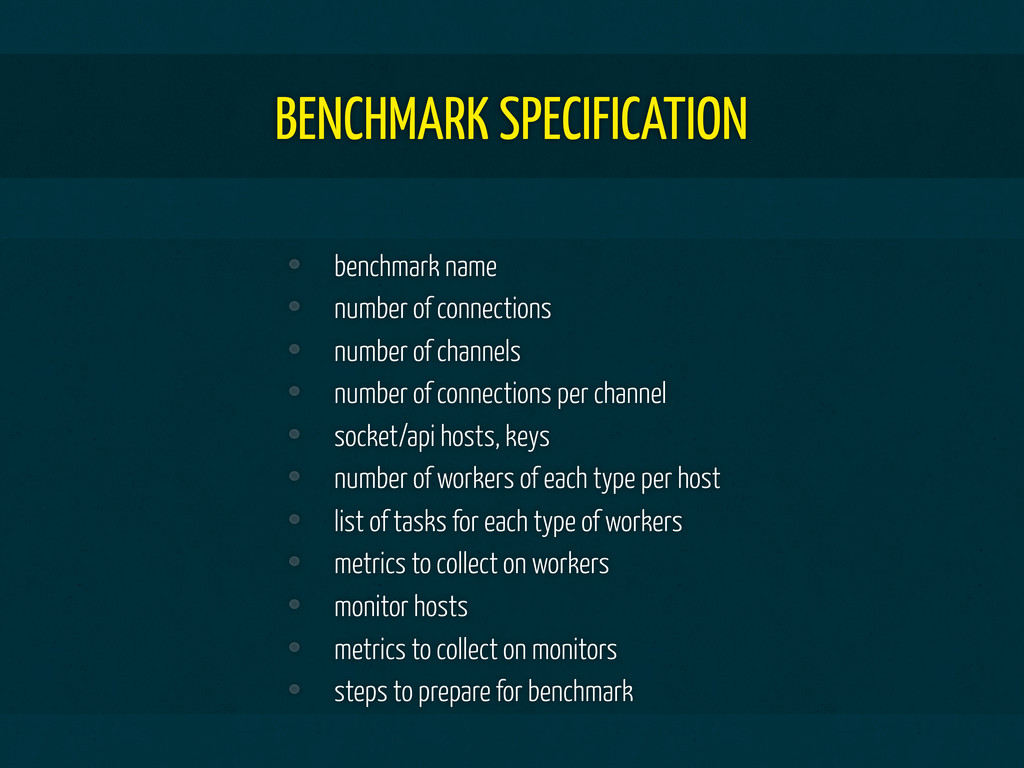
    number of connections per channel socket/api hosts, keys number of workers of each type per host list of tasks for each type of workers metrics to collect on workers monitor hosts metrics to collect on monitors steps to prepare for benchmark
  20. GOALS store benchmarks as cheaply as possible potentially gigabytes of

    data per run separate data storage from load generation allow adding metric views without: changing benchmarking code re-running benchmarks
  21. METRIC CACHE represents smallest piece of aggregated data benchmark-wide: start/finish

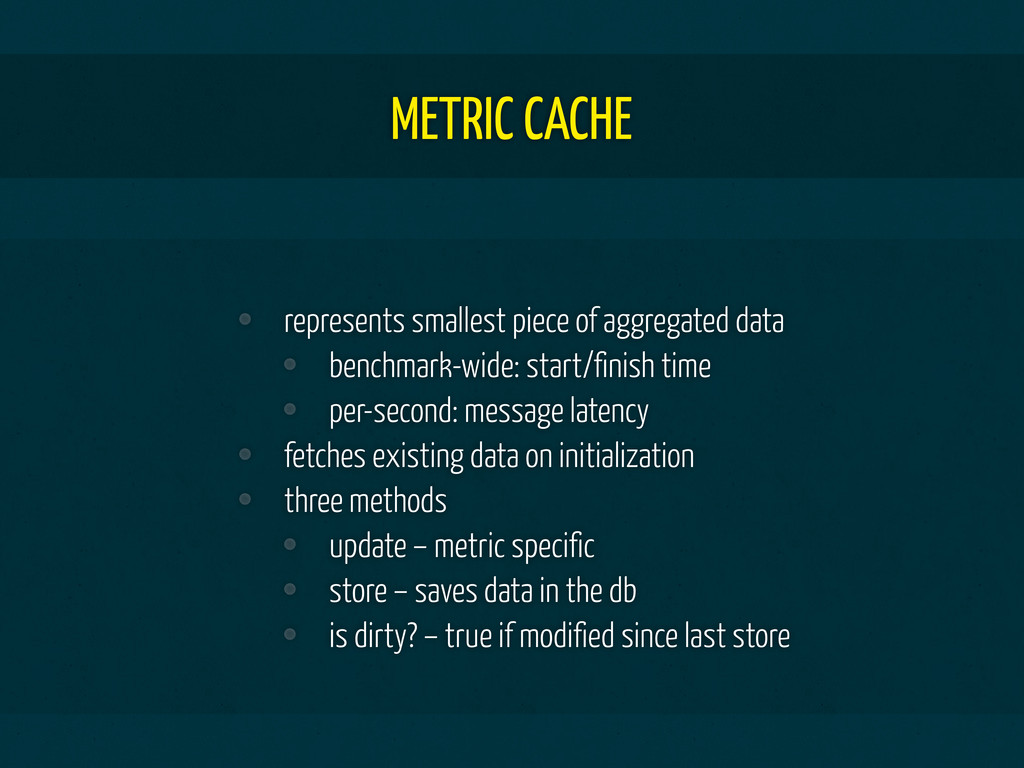
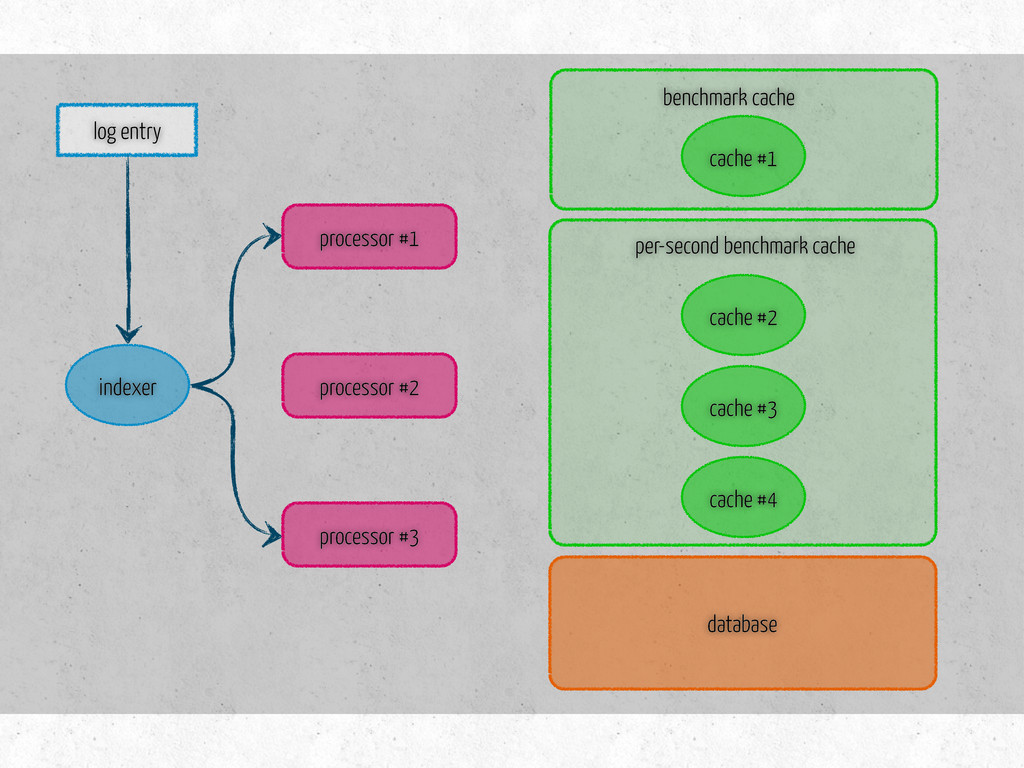
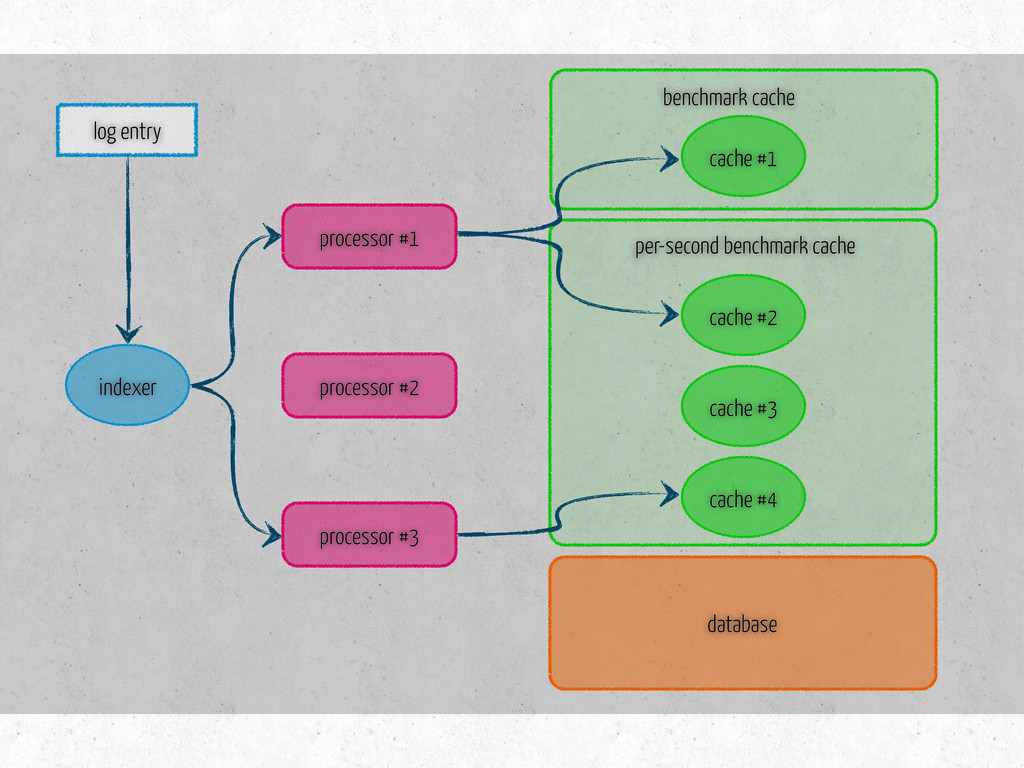
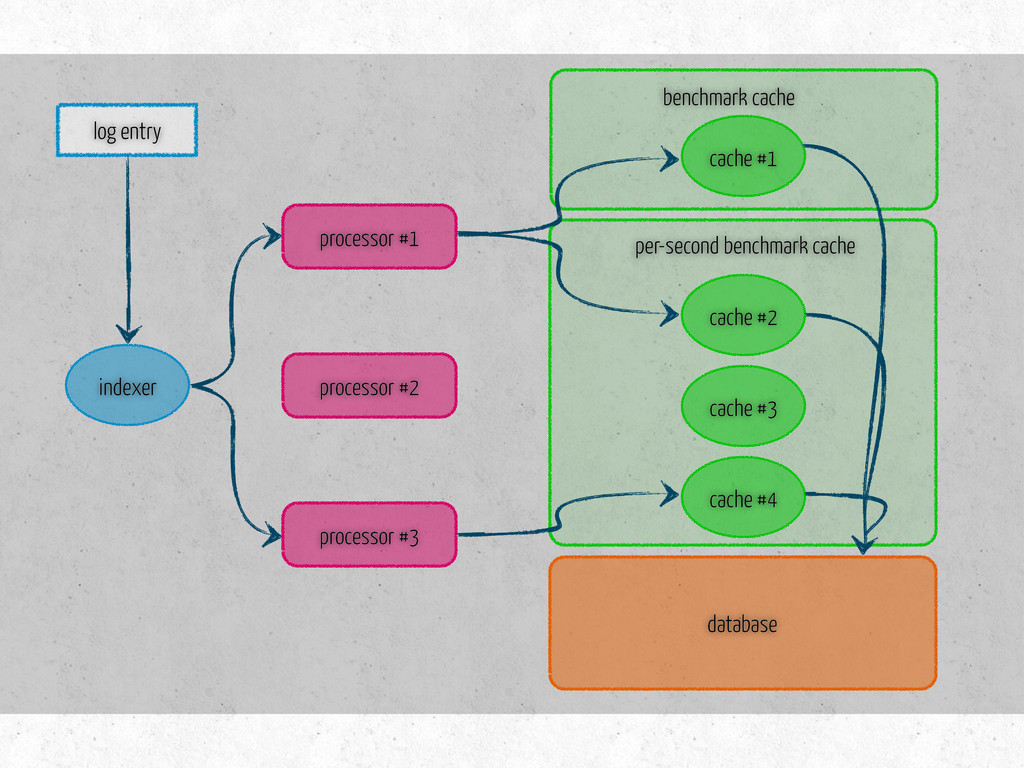
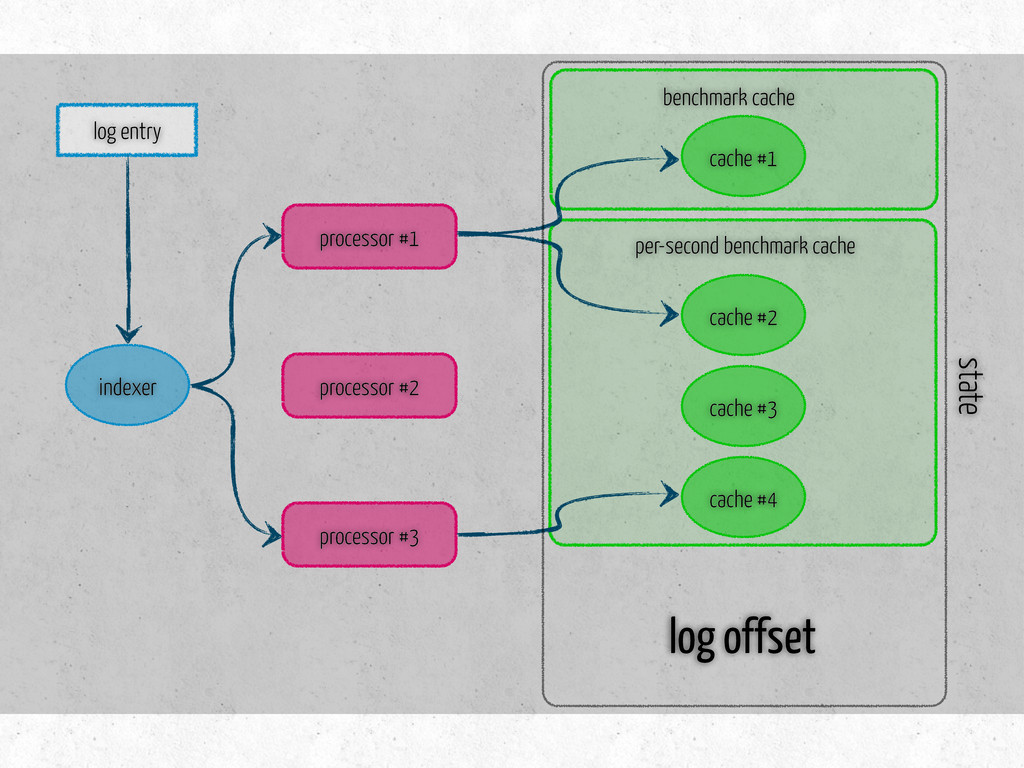
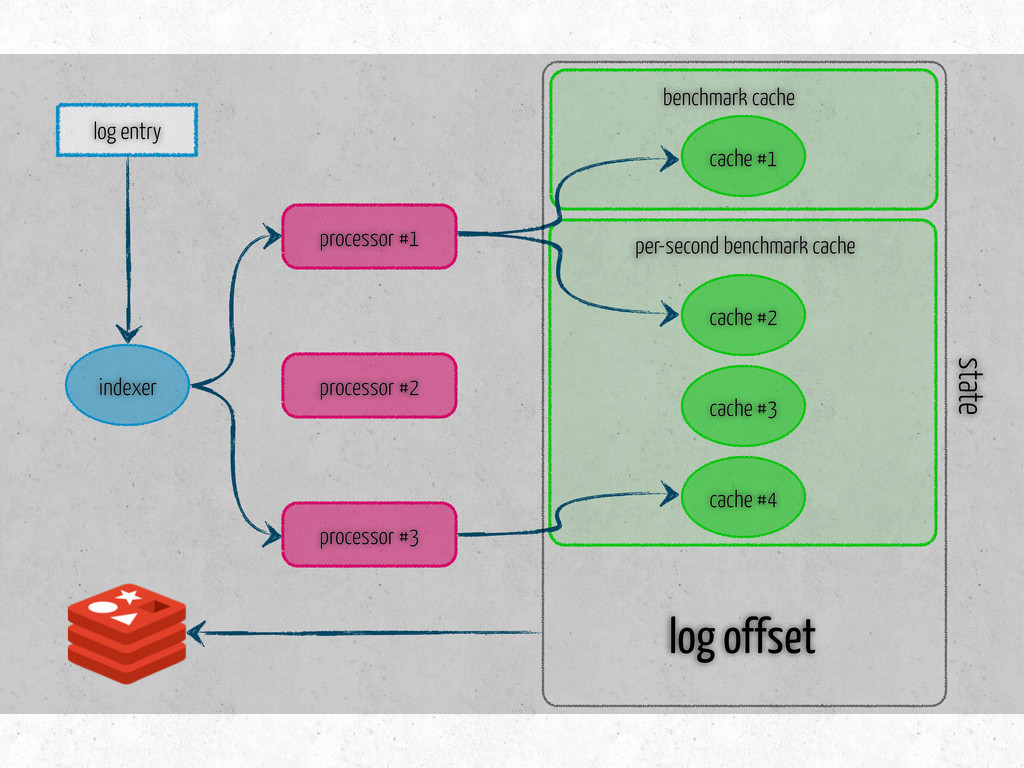
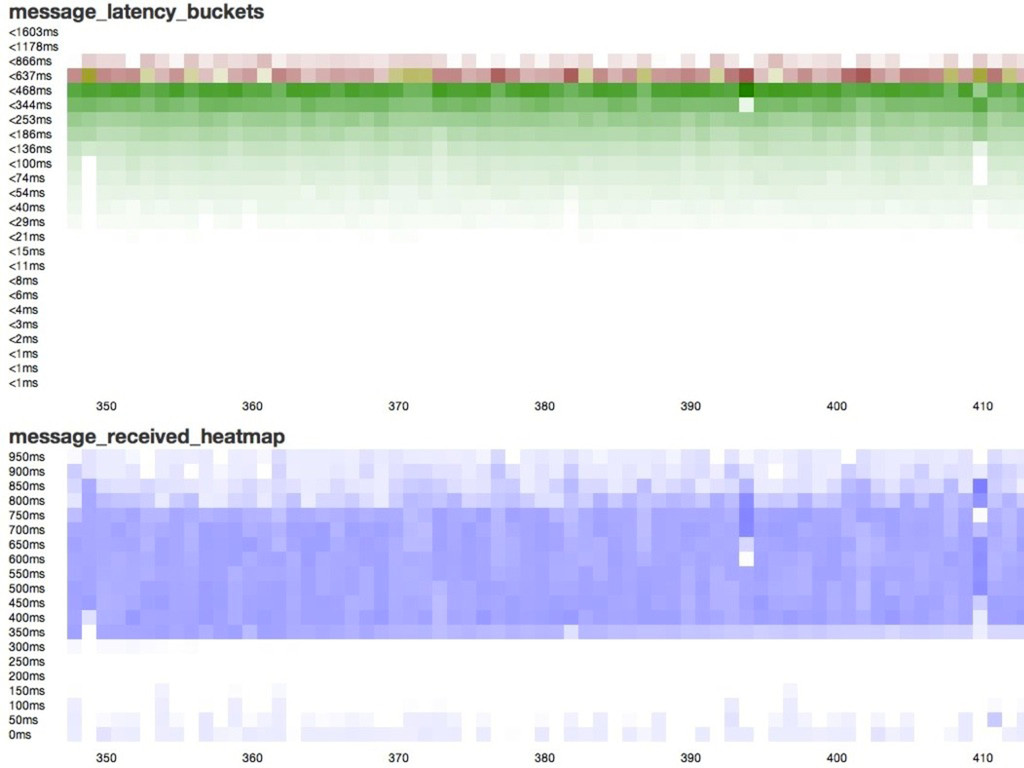
    time per-second: message latency fetches existing data on initialization three methods update – metric specific store – saves data in the db is dirty? – true if modified since last store
  22. indexer log entry processor #1 processor #2 processor #3 cache

    #1 cache #2 cache #3 cache #4 benchmark cache per-second benchmark cache database
  23. indexer log entry processor #1 processor #2 processor #3 cache

    #1 cache #2 cache #3 cache #4 benchmark cache per-second benchmark cache database
  24. indexer log entry processor #1 processor #2 processor #3 cache

    #1 cache #2 cache #3 cache #4 benchmark cache per-second benchmark cache database
  25. indexer log entry processor #1 processor #2 processor #3 cache

    #1 cache #2 cache #3 cache #4 benchmark cache per-second benchmark cache database
  26. FAULT TOLERANCE what if indexer fails in the middle of

    file? file is potentially several GB of size re-indexing is not an option what if logs are being delayed?
  27. indexer log entry processor #1 processor #2 processor #3 cache

    #1 cache #2 cache #3 cache #4 benchmark cache per-second benchmark cache log offset state
  28. indexer log entry processor #1 processor #2 processor #3 cache

    #1 cache #2 cache #3 cache #4 benchmark cache per-second benchmark cache log offset state
  29. RECOVERY 1. start the process 2. fetch whole state from

    Redis 3. restore caches 4. start reading from saved offset
  30. DOS AND DON’TS use short-living objects minimize # of long-living

    objects profile gc (--trace_gc, etc.) premature optimization buffer pools on V8 heap
  31. V8 performance of v8 is decent writing JS is much

    easier… …not to mention debugging see Felix Geisendörfer’s talk C++ is premature optimization
  32. 1 SECOND IS NOT GRANULAR ENOUGH we can send messages

    with few ms latency aggregates hide some issues garbage collection specific code inefficiencies care about percentiles, not averages
  33. SIMPLE TRICK 1. use setInterval with 10ms delay 2. every

    tick increment value of current time window 3. show on a graph like 2 slides before visualize delays as a sub-second heatmap
  34. FUTURE store more metrics test for more use-cases update graphs

    in real-time run benchmarks continuously generate reports automatically easier setup