Why is the system too slow? + Does everything work fine? + What’s the main bottleneck of our system? + What did happen at 10:00 AM this morning that made a lot of customers complain? + What’s the average time the user has to wait until they get the notification? + etc.
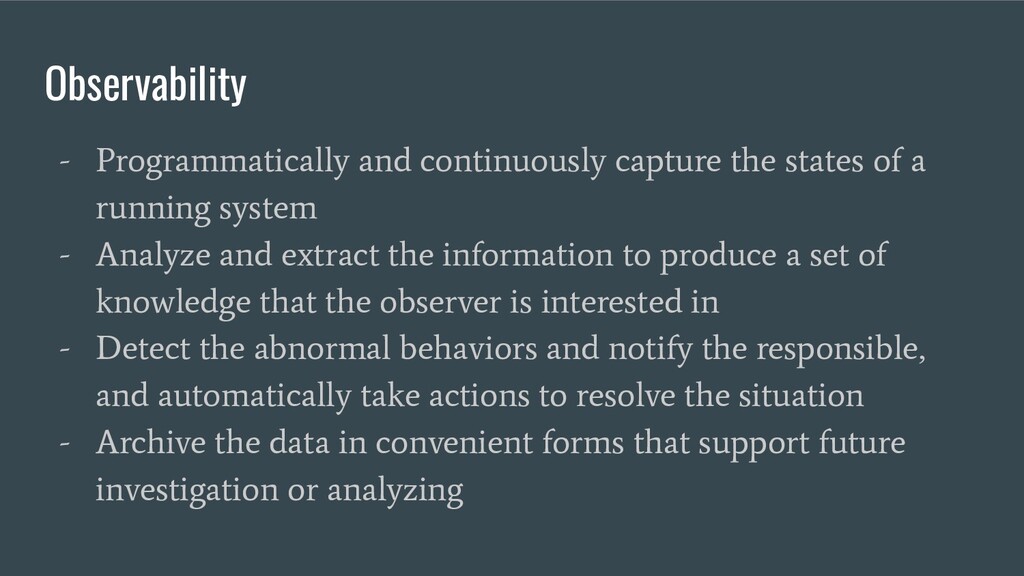
running system - Analyze and extract the information to produce a set of knowledge that the observer is interested in - Detect the abnormal behaviors and notify the responsible, and automatically take actions to resolve the situation - Archive the data in convenient forms that support future investigation or analyzing
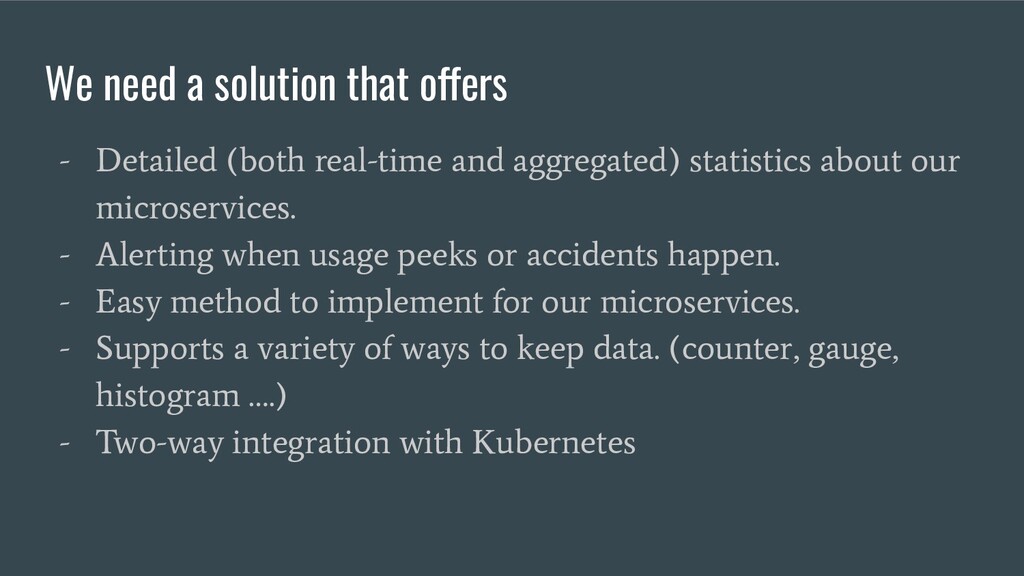
and aggregated) statistics about our microservices. - Alerting when usage peeks or accidents happen. - Easy method to implement for our microservices. - Supports a variety of ways to keep data. (counter, gauge, histogram ….) - Two-way integration with Kubernetes
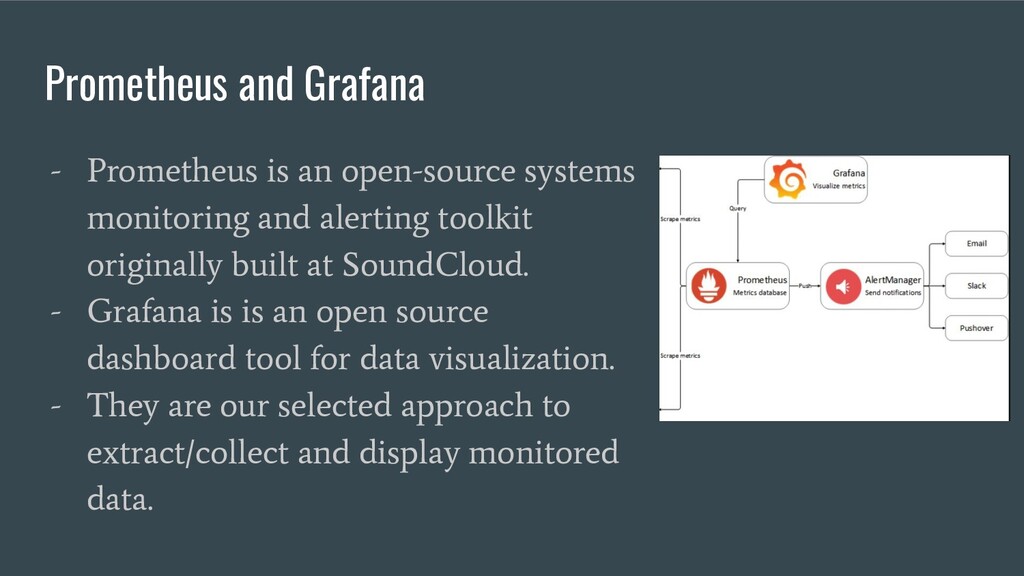
and alerting toolkit originally built at SoundCloud. - Grafana is is an open source dashboard tool for data visualization. - They are our selected approach to extract/collect and display monitored data.