Upgrade to Pro — share decks privately, control downloads, hide ads and more …

Performance Monitoring at Employment Hero

Luong Vo
March 06, 2020

Performance Monitoring at Employment Hero

part 1 of a series about Performance Management and Optimisation. Talks are held at Employment Hero to share the mindset of caring about application performance.

Luong Vo

March 06, 2020
Tweet

More Decks by Luong Vo

Other Decks in Technology

Transcript

  1. Today’s Agenda 1. Why ? 2. Why measure? 3. Why

    monitor? 4. What to monitor? 5. How to monitor?
  2. Today’s Goals Everyone leaves with at least one idea about

    performance management. Everyone knows where and what to look for in performance monitoring.
  3. 1. Why ? Pinterest increased search engine traffic and sign-ups

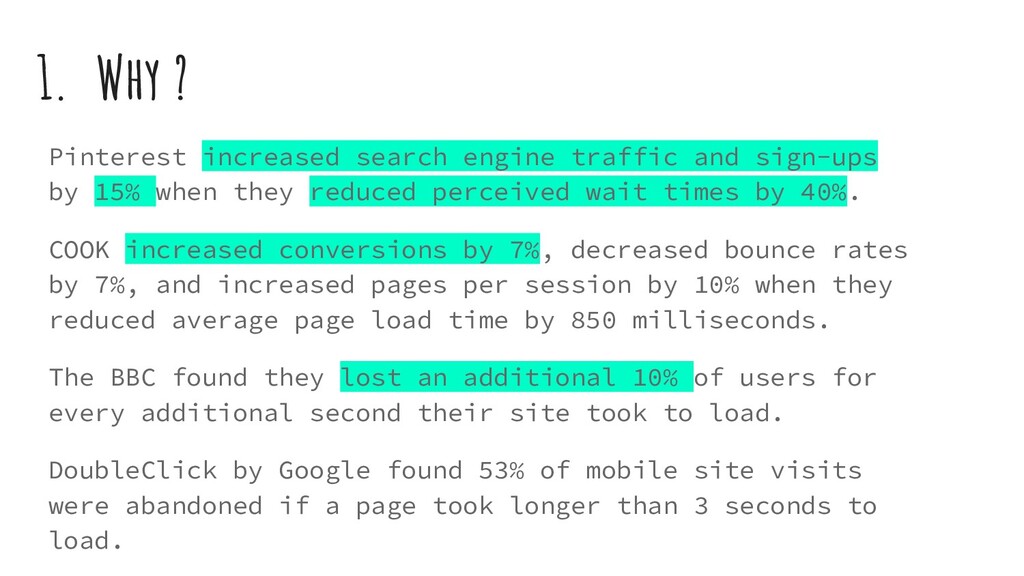
    by 15% when they reduced perceived wait times by 40%. COOK increased conversions by 7%, decreased bounce rates by 7%, and increased pages per session by 10% when they reduced average page load time by 850 milliseconds. The BBC found they lost an additional 10% of users for every additional second their site took to load. DoubleClick by Google found 53% of mobile site visits were abandoned if a page took longer than 3 seconds to load.
  4. 1. Why ? It’s about users , expenses, outages Then

    business, income, adoption, retention…. Source: https://idlewords.com/talks/website_obesity.htm , https://developers.google.com/web/fundamentals/performance/why-performance-matters
  5. 2. Why measure? Measure the actual performance of your application,

    and focus on the 20% of your code that is the worst performance offender. If you're applying equal effort to all areas, you are wasting your time.
  6. 2. Why Monitor? Random boss in AU: “The site feels

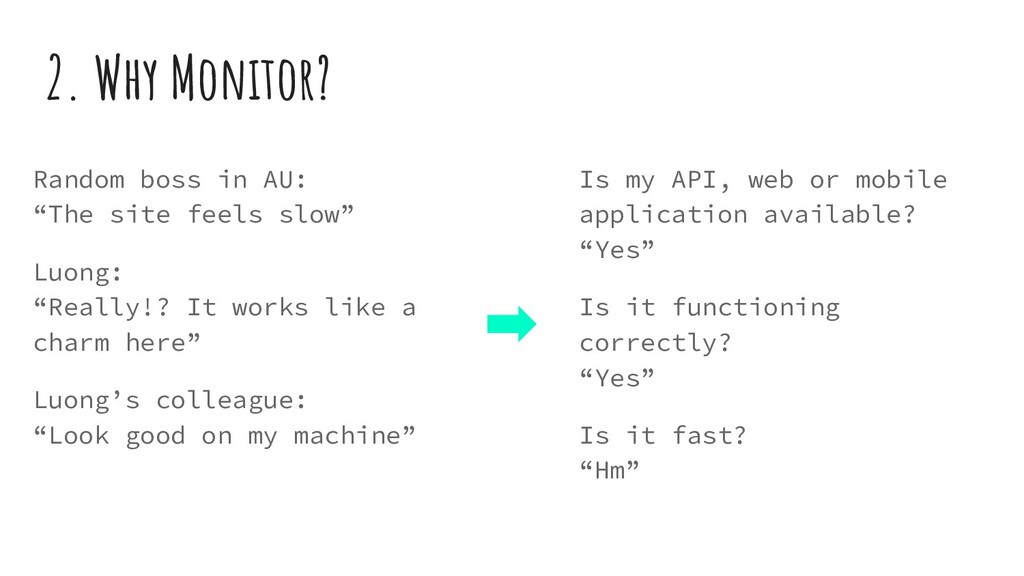
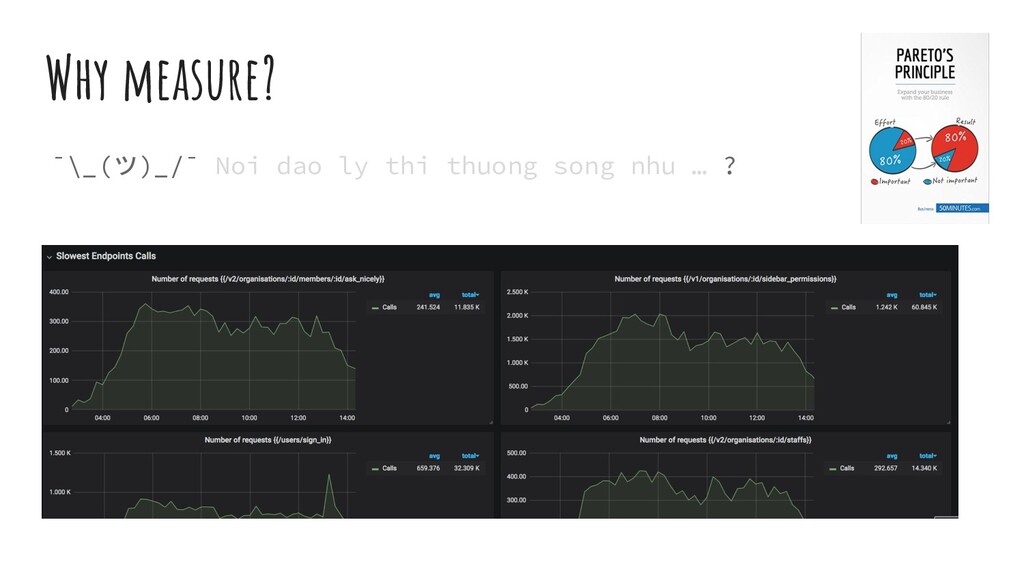
    slow” Luong: “Really!? It works like a charm here” Luong’s colleague: “Look good on my machine” Is my API, web or mobile application available? “Yes” Is it functioning correctly? “Yes” Is it fast? “Hm”
  7. 3. WHat to monitor? External metrics: latency, throughput, error rate.

    Internal metrics: CPU, Load Average, Memory, Network.
  8. Individual Brainstorming: Scenario 1 What will we look for if

    some of our users tell us that the app is slow ?
  9. Individual Brainstorming: Scenario 3 How do we know how many

    servers we need or how much load we can handle in peak time?
  10. 4. How to Monitor? Mindset: - Calculate - Store -

    Query - Which layer? - How to integrate? Tools: - Stackify - Datadog - New Relic - Prometheus - ...
  11. 4.2. Instrument your application Step 1: Decide which type of

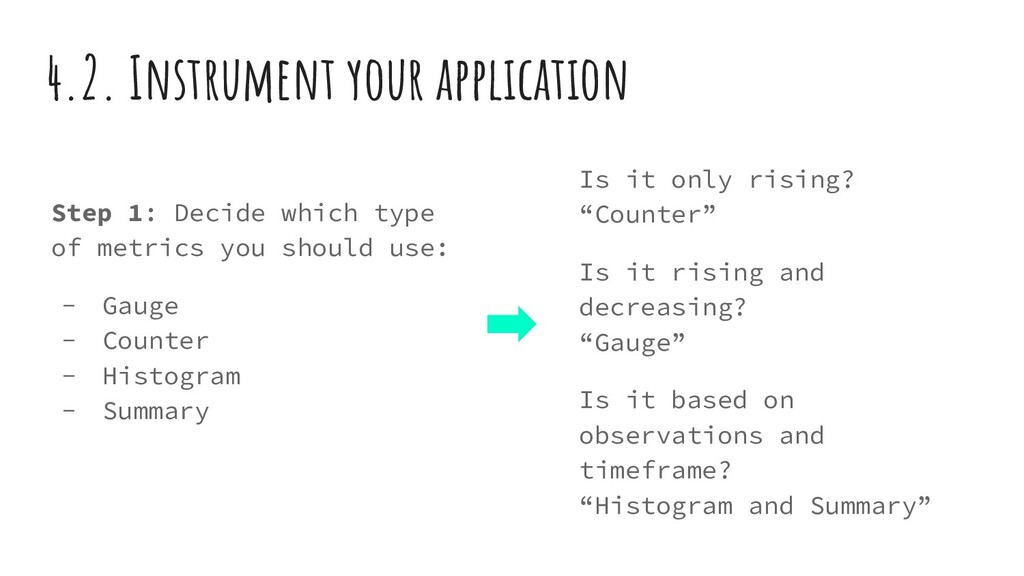
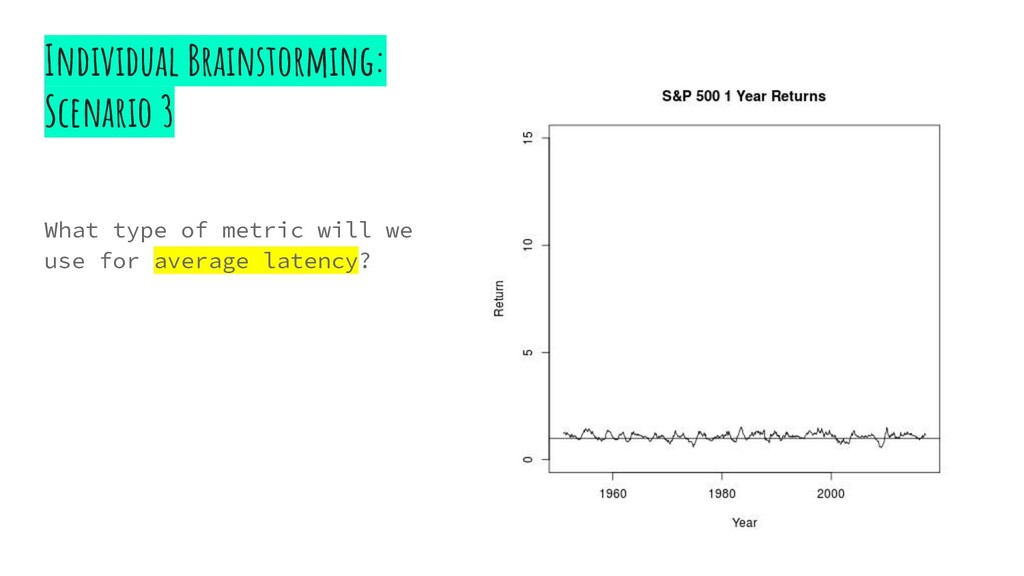
    metrics you should use: - Gauge - Counter - Histogram - Summary Is it only rising? “Counter” Is it rising and decreasing? “Gauge” Is it based on observations and timeframe? “Histogram and Summary”
  12. 4.2. Instrument your application Or: Integrate with your application -

    Eh Monitoring - Middleware - Required files - Hooks - Metric container We wrap Ruby Prometheus library to handle labeling and automatic integrations with rails, sinatra, sequel, active record….
  13. 4.2. Instrument your application Step 3: Start Querying - PromQL

    - Metric name http://prometheus.ehrocks.com http://prometheus.staging.ehrock s.com
  14. Always set your Goals. Make sure you got the right

    metrics to back it up (because reality sucks)