Upgrade to Pro — share decks privately, control downloads, hide ads and more …

Disaster Averted

Disaster Averted

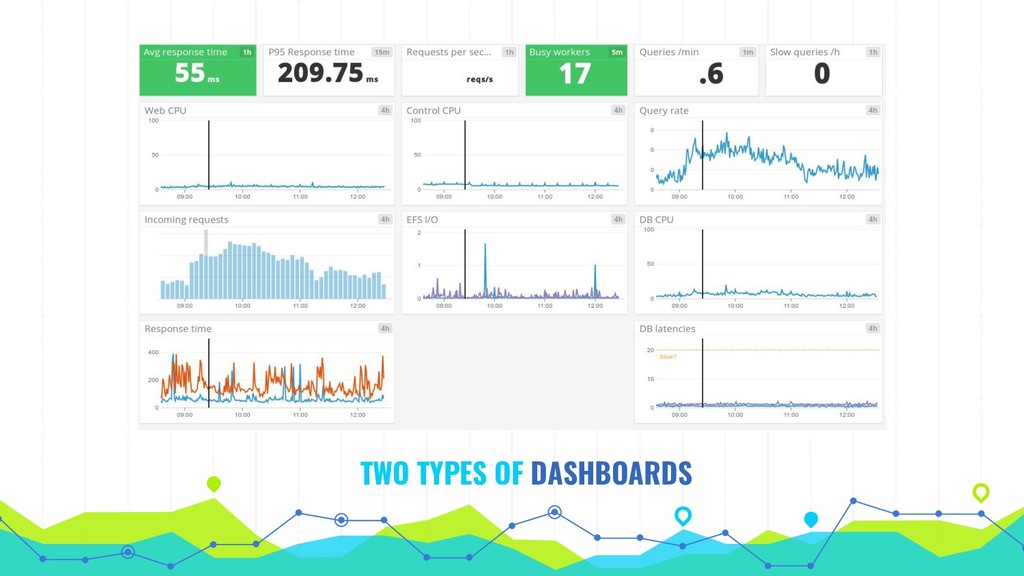
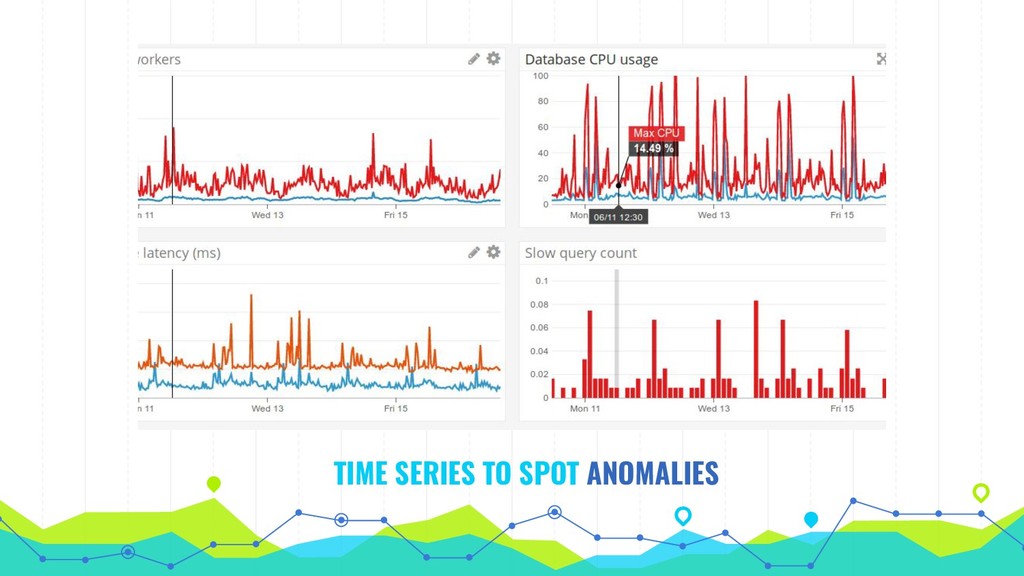
Fix problems before they happen with maximum visibility into your application, with practical steps on monitoring, metric collection, tracing & log analysis. To prevent and fix problems it's important to see how your application works from macro down to micro scale. This can be achieved using a variety of free and paid tools from multiple vendors.

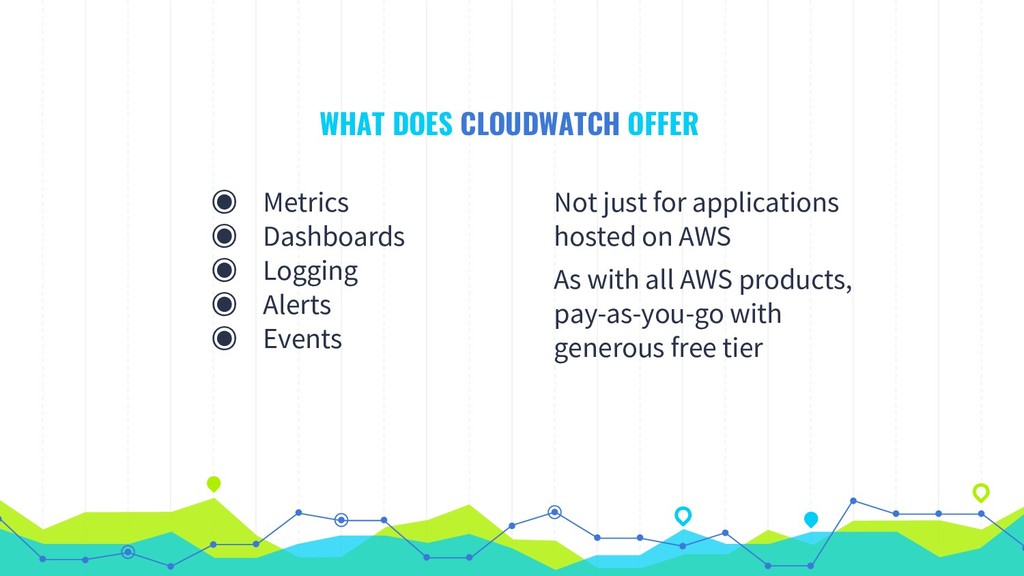
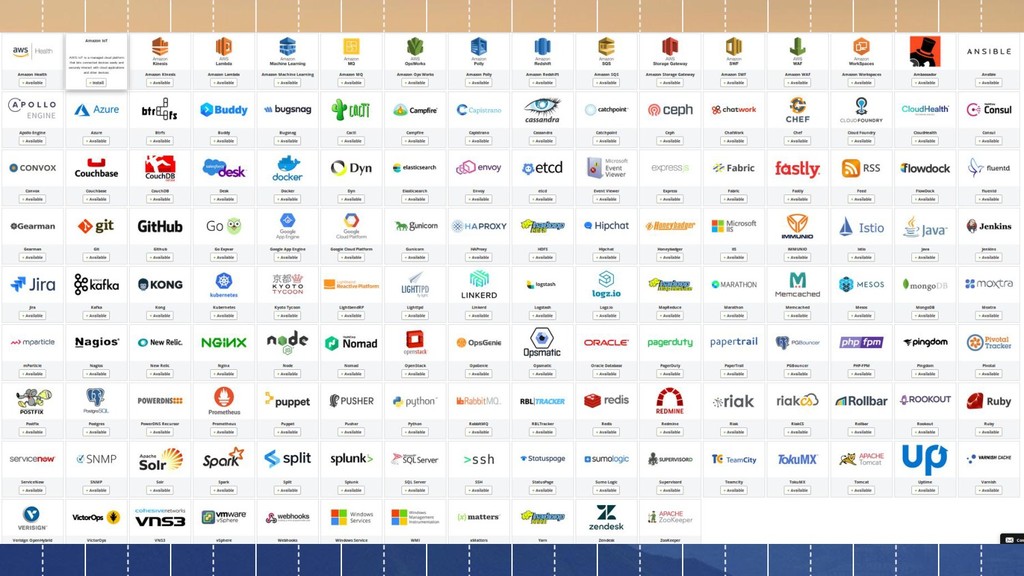
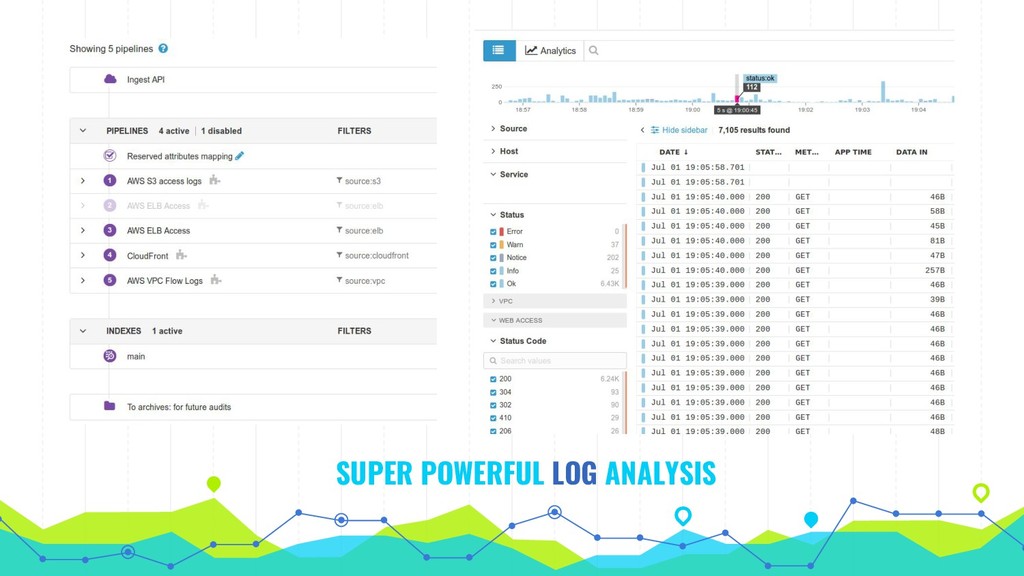
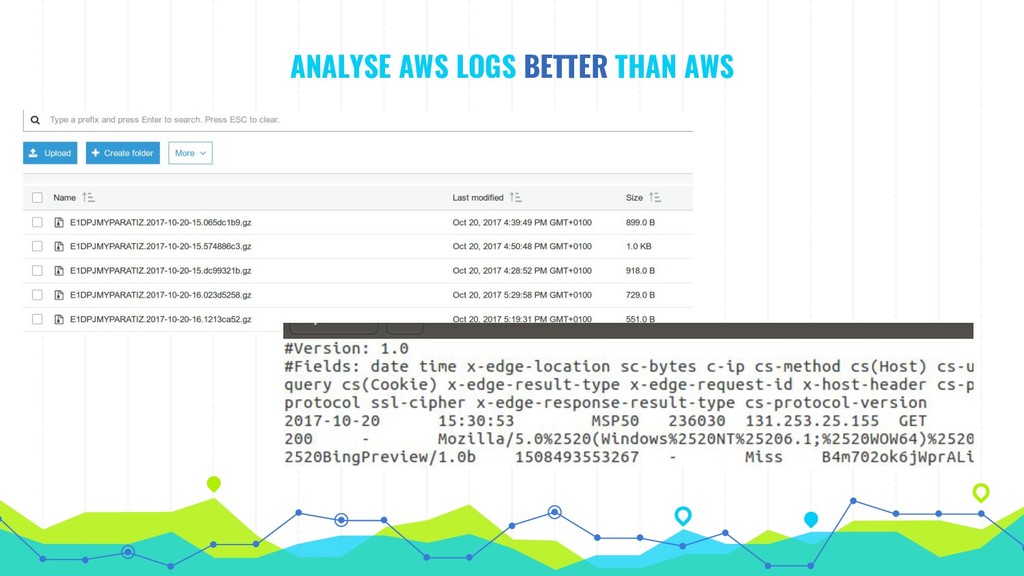
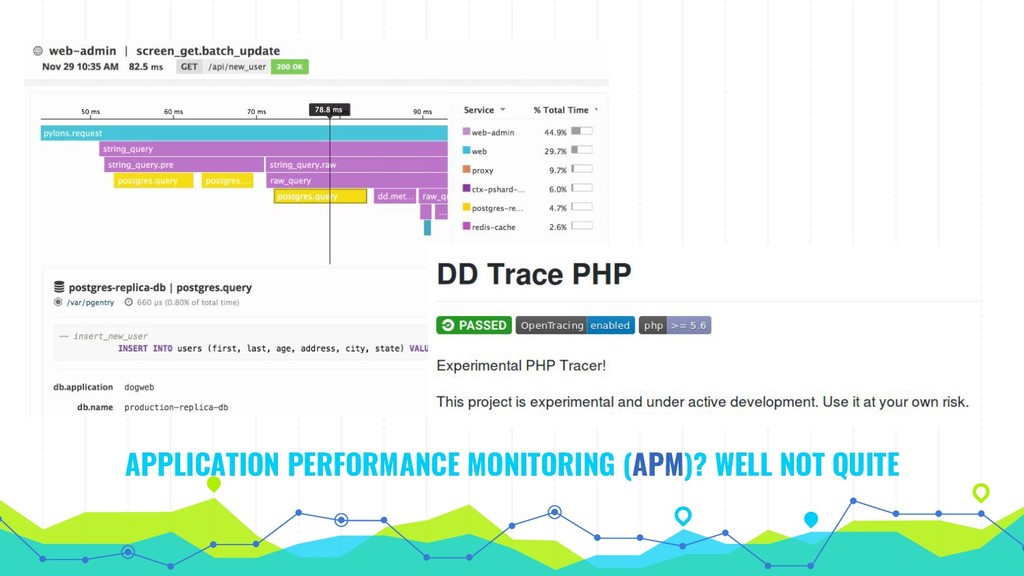
The talk explores practical use of AWS CloudWatch, Datadog & New Relic, all of which can be applied across different cloud or on-premises providers as well as an overview of other available products such as Pagerduty, Loggly, Sentry and Tideways.

Mike Lehan

July 02, 2018
Tweet

More Decks by Mike Lehan

Other Decks in Technology

Transcript

  1. Disaster Averted:
    Tools to increase visibility & solve problems

    View Slide

  2. HELLO!
    I’m Mike Lehan
    Software engineer, CTO of StuRents.com, skydiver, northerner
    Follow me on Twitter @M1ke

    View Slide

  3. Lets Recap
    What are we trying to achieve?
    0

    View Slide

  4. WHAT DISASTERS ARE WE DESIGNING FOR
    ◉ Spotting issues
    ◉ Availability
    ◉ Data consistency
    ◉ Security
    Assuming good practice is
    already followed in:
    ◉ Testing
    ◉ Backups
    ◉ Authentication

    View Slide

  5. Awareness
    We need to know if there’s an
    incident going on, spot if there
    are conditions leading up to an
    incident, and assure that things
    are working as expected
    WE WANT TOOLS WHICH PROVIDE US WITH
    Visibility
    If something isn’t right we need
    ways to isolate affected parts of
    the application, review relevant
    history, and deep-dive into
    specific areas to find the problem

    View Slide

  6. AWARENESS: THE EVERYTHING’S OK ALARM
    An alarm that doesn’t
    alarm isn’t a good alarm
    How often do you test
    your alarms?

    View Slide

  7. VISIBILITY: THE TOILET DOOR PROBLEM
    Did you actually
    lock the door?
    Does the lock
    work as intended?
    What we can’t
    see should make
    us nervous!

    View Slide

  8. Logging
    Usually aimed at providing Visibility, some tools use these to add Awareness
    Metrics
    Primarily give us Awareness, but can add to Visibility

    View Slide

  9. Alerting
    All about Awareness, require prior knowledge of what might go wrong
    Dashboards
    Generally about Awareness, can be used for Visibility
    Tracing/APM
    Next level Visibility beyond logs - see exactly what happened

    View Slide

  10. AWS CloudWatch
    Complex, comprehensive, available and low cost
    1

    View Slide

  11. WHAT DOES CLOUDWATCH OFFER
    ◉ Metrics
    ◉ Dashboards
    ◉ Logging
    ◉ Alerts
    ◉ Events
    Not just for applications
    hosted on AWS
    As with all AWS products,
    pay-as-you-go with
    generous free tier

    View Slide

  12. “SIMPLE” PRICING?
    Only for those with a
    degree in WTF

    View Slide

  13. GRAPH YOUR METRICS
    ◉ Stores data down to minute or second resolution
    ◉ 15 months retention, but less granular over time
    ◉ Map up to 1440 points per graph, aggregate Max, Min, Avg, Count,
    Sum and Percentiles
    Bonus: Let’s you play games to find unrelated metrics which correlate

    View Slide

  14. USEFUL METRICS FOR AWS USERS
    Load balancers
    Number of requests
    Target response times
    Number of 5xx codes
    EC2
    Average/Max CPU
    utilization
    CPU credit balance
    RAM Usage? Er, nope...
    Autoscaling
    Number of instances
    (enable this as a
    special option)
    RDS
    CPU utilization
    Swap usage
    Burst credits (!!!)
    CPU credit balance
    EFS
    Disk I/O credits
    Size stored (costly!)
    Cloudfront
    Number of requests
    Bytes transferred
    Cache misses
    Number of 4xx codes

    View Slide

  15. Cloudwatch Agent
    Installs as a service on
    Linux servers - EC2 or your
    own server
    Configured to collect
    system level metrics - CPU,
    RAM, Disk, Network
    SYSTEM & APPLICATION METRICS
    PUT metrics API
    Accessible via “awscli” or
    SDK in PHP
    Submit custom metrics
    with your own namespace
    Requests can be made
    async

    View Slide

  16. APPLICATION METRICS ARE POWERFUL
    Constants
    What happens
    lots in your
    application that
    indicates things
    are basically
    working?
    Critical
    Are there key
    transactions that
    have a large
    bearing on your
    business case?
    Errors
    Generally the
    place of logs
    rather than
    metrics
    Can we turn error
    logs into metrics?

    View Slide

  17. APPLICATION METRICS ARE NOT JUST FOR ENGINEERS
    Business analysis
    Does your
    company use BA
    tools?
    Metrics can be
    better & cheaper
    Market research
    You may have
    valuable data
    that you’re not
    even aware of
    Fun
    Every team
    benefits from a
    chance to see
    what their
    application is
    doing.

    View Slide

  18. LOG AGGREGATION
    ◉ Log groups and streams - split by use and entity
    ◉ Automatic expiration - save money and reduce search overhead
    ◉ Search by text and date - across all streams in a group
    ◉ Filters turn logs into metrics - by pattern matching

    View Slide

  19. WHERE DO LOGS COME FROM?
    Internal AWS
    Most AWS services
    don’t provide logs in
    Cloudwatch
    RDS lets you export
    default logs
    Lambda logs natively
    CloudWatch Agent
    Two confusingly
    named agents
    Config file chooses
    files or directories to
    stream as logs
    Auto-rewrite config
    file to find new log
    files
    API/SDK
    You can push log
    entries directly.
    Not the best
    experience; API is
    intended to be used
    to push logs in
    batches

    View Slide

  20. WHICH LOGS ARE IMPORTANT?
    Awareness
    ◉ Auth log
    ◉ Apache error log
    ◉ MySQL error log
    ◉ MySQL audit log
    Visibility
    ◉ Syslog
    ◉ Dmesg / messages
    ◉ MySQL general log
    Both
    ◉ Apache access log
    ◉ MySQL slow query log
    ◉ Your application logs

    View Slide

  21. WATCH YOUR METRICS WITH DASHBOARDS

    View Slide

  22. DON’T MISS A THING
    We have metrics &
    logs to provide us
    with awareness
    If someone isn’t
    watching our
    dashboards 24/7
    we can still miss
    something

    View Slide

  23. ALERTS NEED YOU TO PREDICT WHAT MIGHT INDICATE WRONGNESS

    View Slide

  24. LIKE MUCH OF AWS ALERT HANDLING IS SELF-SERVICE
    ◉ Simple Notification Service
    ◉ Notifications by email, SMS, webhook
    ◉ Emails & SMS are basic
    ◉ Notifications are one time
    ◉ Alerts are cheap - basically free for low volume
    ◉ Webhooks can send to external tools

    View Slide

  25. Datadog
    A leader in monitoring tools, simple pricing, loads of integrations
    2

    View Slide

  26. WANT BIG IMPACT?
    USE BIG IMAGE.

    View Slide

  27. GENERAL RULE DATADOG vs CLOUDWATCH
    ◉ If Cloudwatch does it: Datadog does it & more
    ◉ Exception: metrics from AWS’ own services
    ◉ Different approach to log aggregation
    Cloudwatch Agent <-> Dogstatsd (Based on Statsd)

    View Slide

  28. SIMPLER PRICING
    Generally higher cost

    View Slide

  29. SIMPLER PRICING
    Still kind of confusing...

    View Slide

  30. TWO TYPES OF DASHBOARDS

    View Slide

  31. TIME SERIES TO SPOT ANOMALIES

    View Slide

  32. SUPER POWERFUL LOG ANALYSIS

    View Slide

  33. ANALYSE AWS LOGS BETTER THAN AWS

    View Slide

  34. ALERTS THAT LEARN

    View Slide

  35. APPLICATION PERFORMANCE MONITORING (APM)? WELL NOT QUITE

    View Slide

  36. KEEN TO SEE OFF THE COMPETITION

    View Slide

  37. New Relic
    The one with the free t-shirts
    3

    View Slide

  38. SUPER PRICEY APM
    Oddly cheap infrastructure

    View Slide

  39. PHP APM WITH BONUS JARGON

    View Slide

  40. EASY APM TO INTEGRATE
    Name your route and go

    View Slide

  41. HOW NEW RELIC COMPARES
    ◉ Most established tool but might be struggling to keep up
    ◉ All about the APM; no logging
    ◉ Similar agent approach to Datadog
    ◉ Clunky interface
    ◉ Also includes error monitoring as part of APM

    View Slide

  42. Sentry
    Super simple error monitor
    4

    View Slide

  43. NEVER HEARD OF THIS ONE?
    ◉ Most single-use tool so far - just does error monitoring
    ◉ Logs via HTTP calls so would add minor overhead
    ◉ Integrates into PHP with composer
    ◉ Also integrates with JS via front end script

    View Slide

  44. RECORDS AND GROUPS ERRORS

    View Slide

  45. DETAILED ERROR INFO STACK TRACES & BREADCRUMBS

    View Slide

  46. GOOD PRICING TO START
    PAYG in between tiers

    View Slide

  47. WHERE DOES THIS FIT IN?
    ◉ Can be used to observe ongoing errors
    ◉ Assist handling of errors by the application
    ◉ Allows alerting
    ◉ Can feed event data into Datadog for unified dashboards

    View Slide

  48. and the rest
    No end of tools or ways to combine them
    5

    View Slide

  49. ◉ Pure logging tool, can stream logs and understand AWS logs
    ◉ Cool online tail feature allows log observation in real time

    View Slide

  50. ◉ Alert managing tool, can feed from other alert platforms
    ◉ Escalate and analyse responses to alerts

    View Slide

  51. ◉ PHP APM based on
    Xhprof extension
    ◉ Safe to run in
    production
    ◉ Runs basic call logging
    and can manually log
    more detailed traces

    View Slide

  52. In summary
    Will these tools actually help us avert disaster?
    6

    View Slide

  53. AVERTING DISASTERS
    ◉ Gain awareness into what’s happening with our application
    ◉ Observe passively (dashboards) or actively (alerts)
    ◉ Ensure we have visibility to fix problems
    ◉ Be sensible about what you collect
    ◉ Remember security risks of 3rd party services

    View Slide

  54. THANKS!
    Any questions?
    You can find me at
    @M1ke / Slack: #phpnw & #og-aws
    StuRents is hiring!
    Useful links
    https://speakerdeck.com/m1ke/disaster-averted
    https://github.com/M1ke/aws-log-checker
    https://github.com/jorgebastida/awslogs
    Bonus: would you be interested in a live
    demo/workshop on monitoring tools at a
    conference or user group?
    Presentation template by SlidesCarnival

    View Slide