Upgrade to Pro — share decks privately, control downloads, hide ads and more …

"Colouring redshift and velocity: a novel visual cue to inspect volumetric data in Astronomy"

Dany Vohl
September 26, 2016

"Colouring redshift and velocity: a novel visual cue to inspect volumetric data in Astronomy"

Talk presented at the Perspective of GPU computing in Science, Sapienza Università di Roma, Rome, Italy on 26 September 2016.

Dany Vohl

September 26, 2016
Tweet

More Decks by Dany Vohl

Other Decks in Science

Transcript

  1. Colouring redshift and velocity a novel visual cue to inspect

    volumetric data in astronomy Dany Vohl | GPU2016 | @danyvohl In collaboration with Christopher J. Fluke, Amr H. Hassan and David G. Barnes
  2. Brief history and challenges of visualisation & spectroscopy in astronomy

    @danyvohl Dany Vohl | GPU2016 | ~1670 : Newton
 1802 : Wollaston
 1859 : Kirchoff & Bunson 1802 : Doppler
 (Doppler effect)
  3. Brief history and challenges of visualisation & spectroscopy in astronomy

    @danyvohl Dany Vohl | GPU2016 | Source: interestastrophysics.blogspot.ca
  4. Brief history and challenges of visualisation & spectroscopy in astronomy

    @danyvohl Dany Vohl | GPU2016 | Sources: MaNGA, Marc White (RSSA-ANU) 
 & ASKAP Spectral cube
  5. Brief history and challenges of visualisation & spectroscopy in astronomy

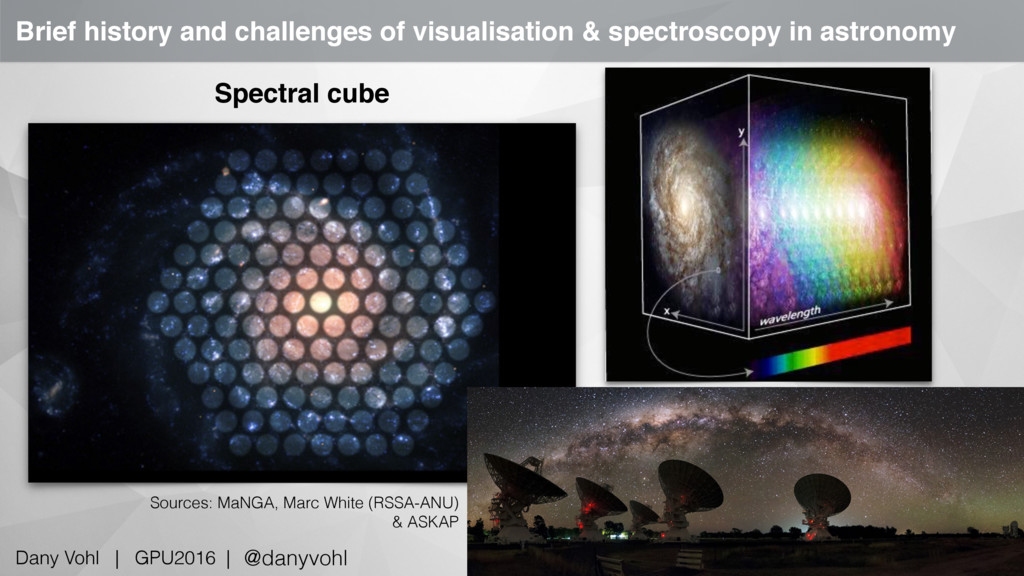
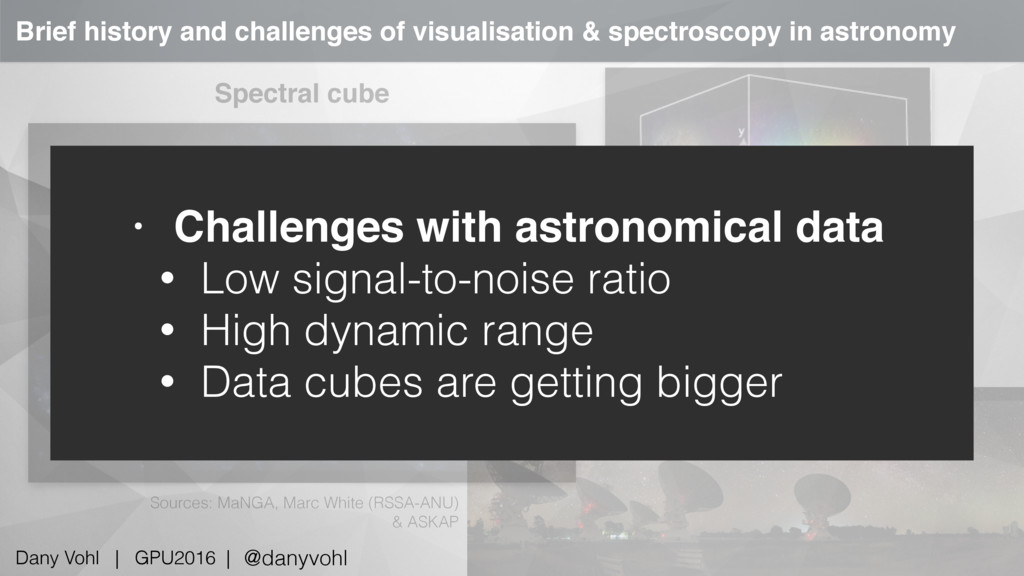
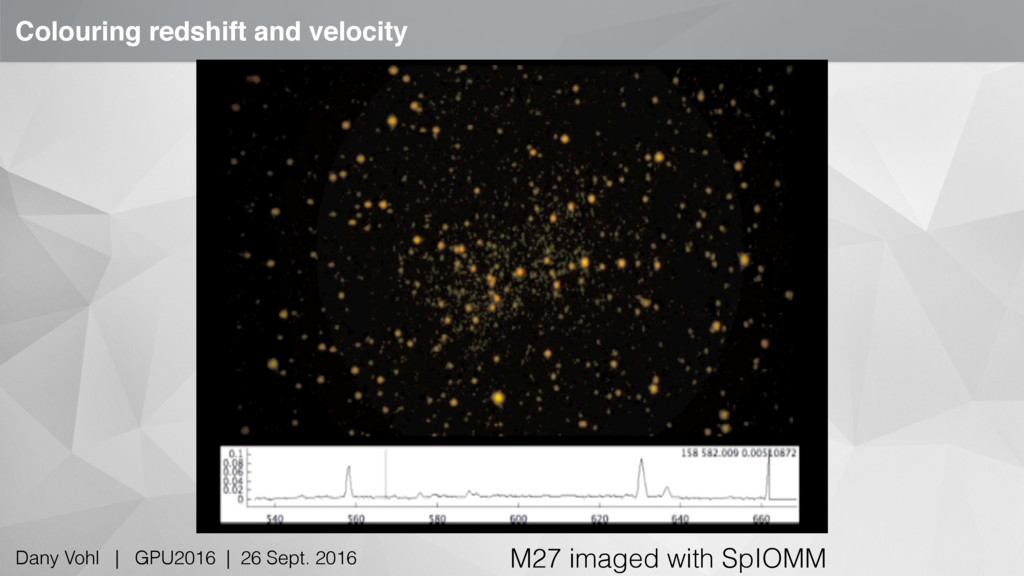
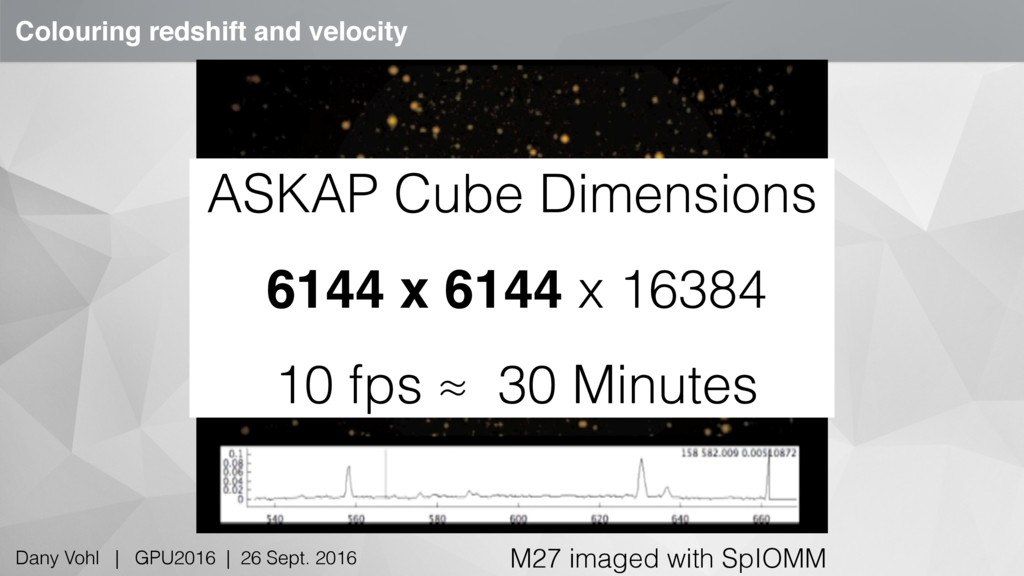
    @danyvohl Dany Vohl | GPU2016 | Sources: MaNGA, Marc White (RSSA-ANU) 
 & ASKAP Spectral cube • Challenges with astronomical data • Low signal-to-noise ratio • High dynamic range • Data cubes are getting bigger
  6. Brief history and challenges of visualisation & spectroscopy in astronomy

    @danyvohl Dany Vohl | GPU2016 | Sources: MaNGA, Marc White (RSSA-ANU) 
 & ASKAP Spectral cube Challenge #3 [We propose]
  7. Brief history and challenges of visualisation & spectroscopy in astronomy

    @danyvohl Dany Vohl | GPU2016 | Sources: MaNGA, Marc White (RSSA-ANU) 
 & ASKAP Spectral cube How can we visualize and analyze these data cubes?
  8. Colouring redshift and velocity Dany Vohl | GPU2016 | 26

    Sept. 2016 M27 imaged with SpIOMM ASKAP Cube Dimensions 6144 x 6144 x 16384 10 fps ≈ 30 Minutes
  9. Colouring redshift and velocity Dany Vohl | GPU2016 | 26

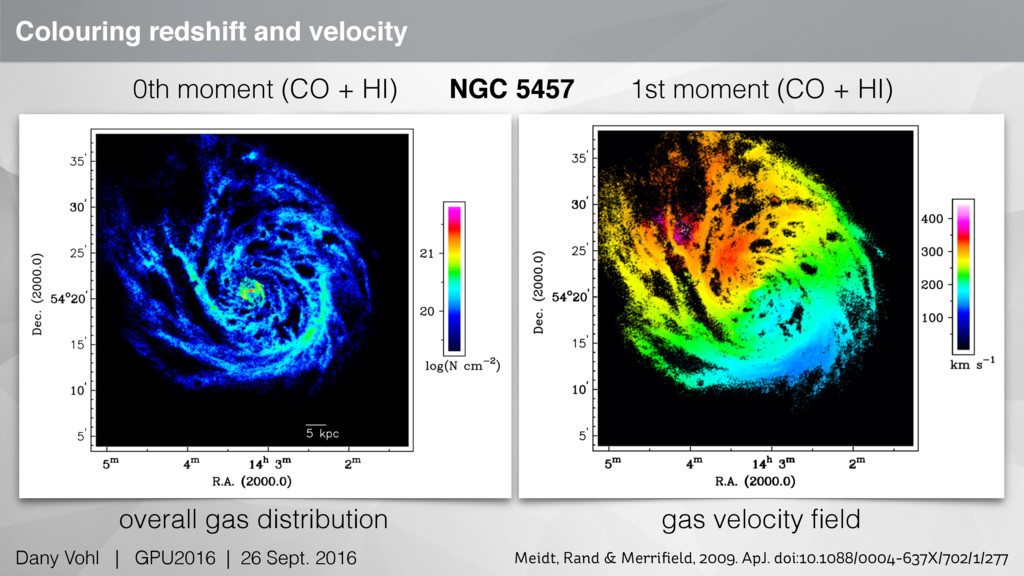
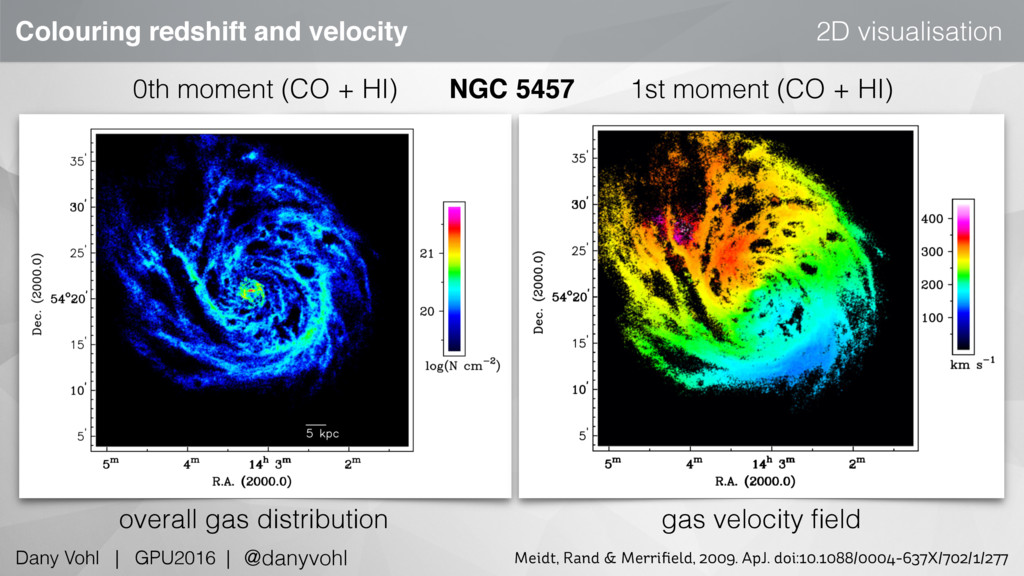
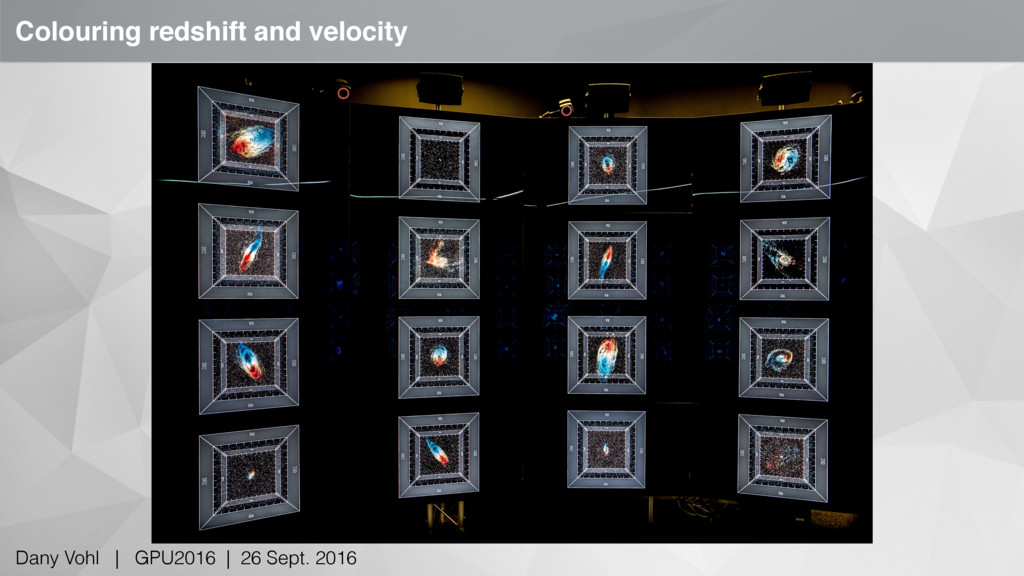
    Sept. 2016 0th moment (CO + HI) 1st moment (CO + HI) NGC 5457 Meidt, Rand & Merrifield, 2009. ApJ. doi:10.1088/0004-637X/702/1/277 overall gas distribution gas velocity field
  10. Colouring redshift and velocity Dany Vohl | GPU2016 | 26

    Sept. 2016 Enters the GPU Source: techspot.com
  11. Colouring redshift and velocity Dany Vohl | GPU2016 | 26

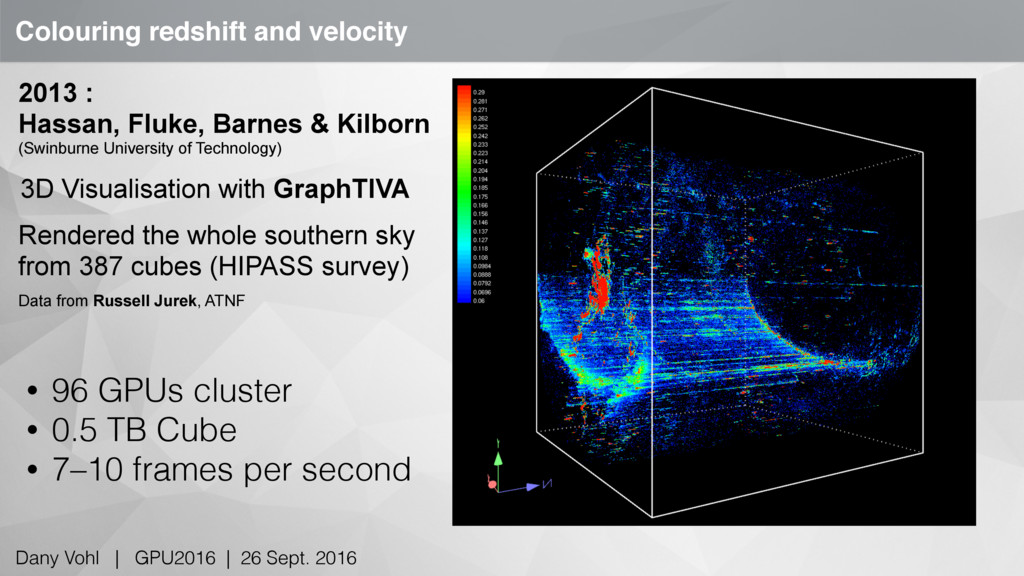
    Sept. 2016 Rendered the whole southern sky 
 from 387 cubes (HIPASS survey) Data from Russell Jurek, ATNF 2013 :
 Hassan, Fluke, Barnes & Kilborn 
 (Swinburne University of Technology) 3D Visualisation with GraphTIVA • 96 GPUs cluster • 0.5 TB Cube • 7–10 frames per second
  12. Colouring redshift and velocity Dany Vohl | GPU2016 | 26

    Sept. 2016 Medical imaging Fluid dynamics Source: Human Connectome Project (MI); COMSOL (FD)
  13. Colouring redshift and velocity Dany Vohl | GPU2016 | 26

    Sept. 2016 Graphics pipeline 
 the Stream Programming Model Source: Nielsen (2007)
  14. Colouring redshift and velocity Dany Vohl | GPU2016 | 26

    Sept. 2016 Graphics pipeline 
 the Stream Programming Model Source: Nielsen (2007)
  15. Colouring redshift and velocity Dany Vohl | GPU2016 | 26

    Sept. 2016 OpenGL Shader Language (GLSL)
  16. Colouring redshift and velocity 2D visualisation @danyvohl Dany Vohl |

    GPU2016 | 0th moment (CO + HI) 1st moment (CO + HI) NGC 5457 Meidt, Rand & Merrifield, 2009. ApJ. doi:10.1088/0004-637X/702/1/277 overall gas distribution gas velocity field
  17. Colouring redshift and velocity at large: encube Dany Vohl |

    GPU2016 | 26 Sept. 2016 • Part immersive visualization environment • 8-meter diameter working area, • 320 degree panoramic display system; • 80 stereo-capable displays • arranged in 20 four-panel columns, • 84 million pixels • Part supercomputer • 40 GPUs • ∼100 TFLOP/s of integrated 
 GPU-based processing power Hybrid 2D/3D reality environment for immersive simulation and information analysis. http://github.com/mivp/encube
  18. Colouring redshift and velocity Dany Vohl | GPU2016 | 26

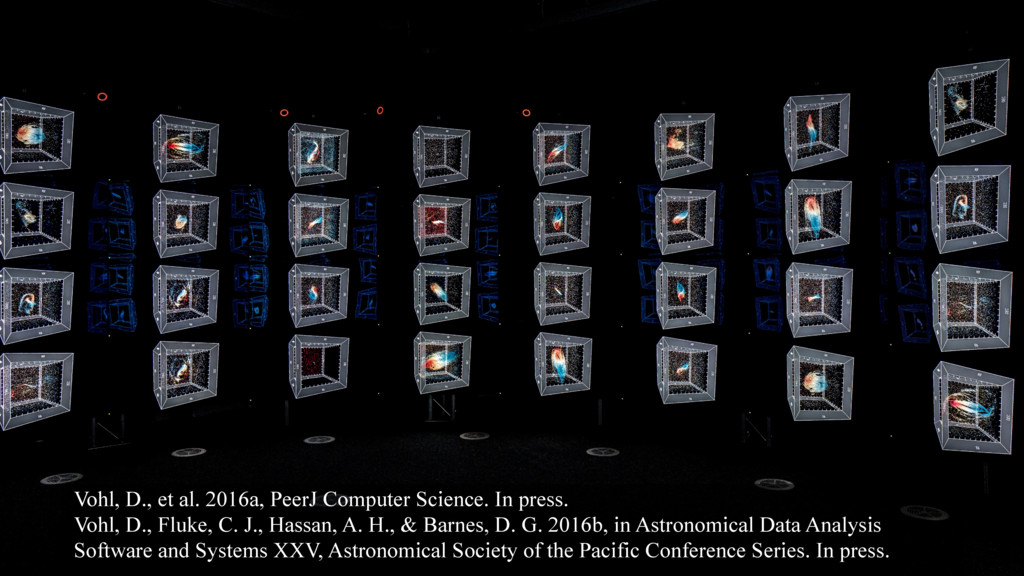
    Sept. 2016 Vohl, D., et al. 2016a, PeerJ Computer Science. In press.
 Vohl, D., Fluke, C. J., Hassan, A. H., & Barnes, D. G. 2016b, in Astronomical Data Analysis Software and Systems XXV, Astronomical Society of the Pacific Conference Series. In press.
  19. Summary @danyvohl Dany Vohl | GPU2016 | • GPU also

    good for fast and high quality visualisation • Utilise GPU to create intuitive visualisation for astronomers • Integrate into encube in CAVE2 • Now, time to put in hands of astronomers 26