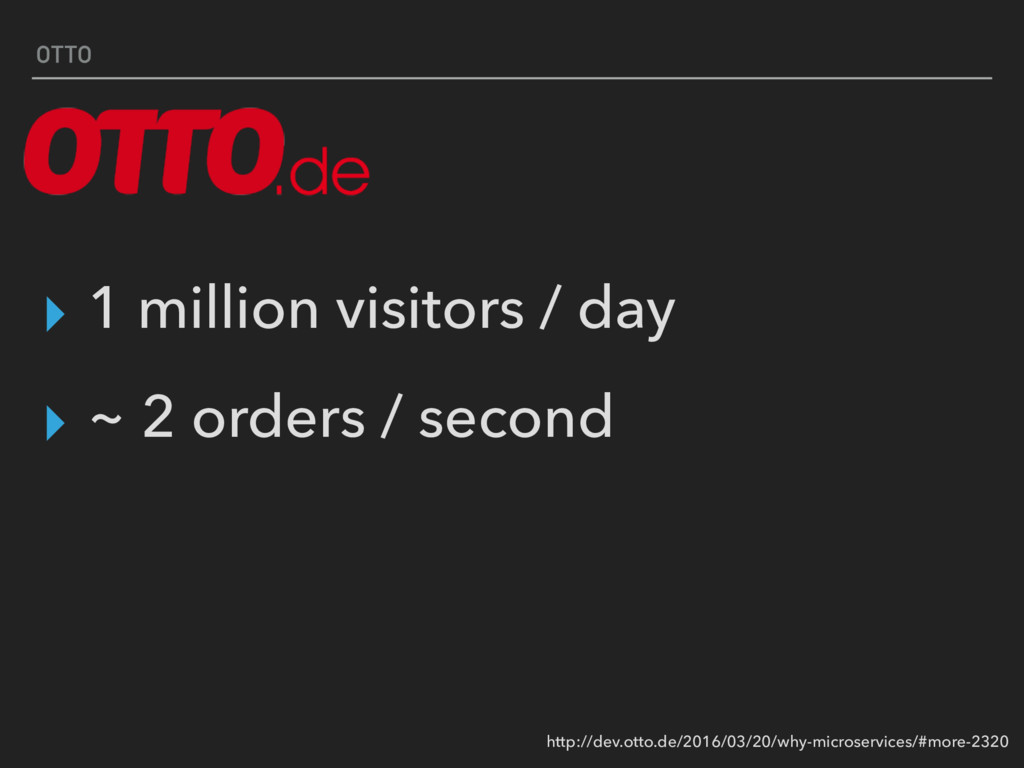
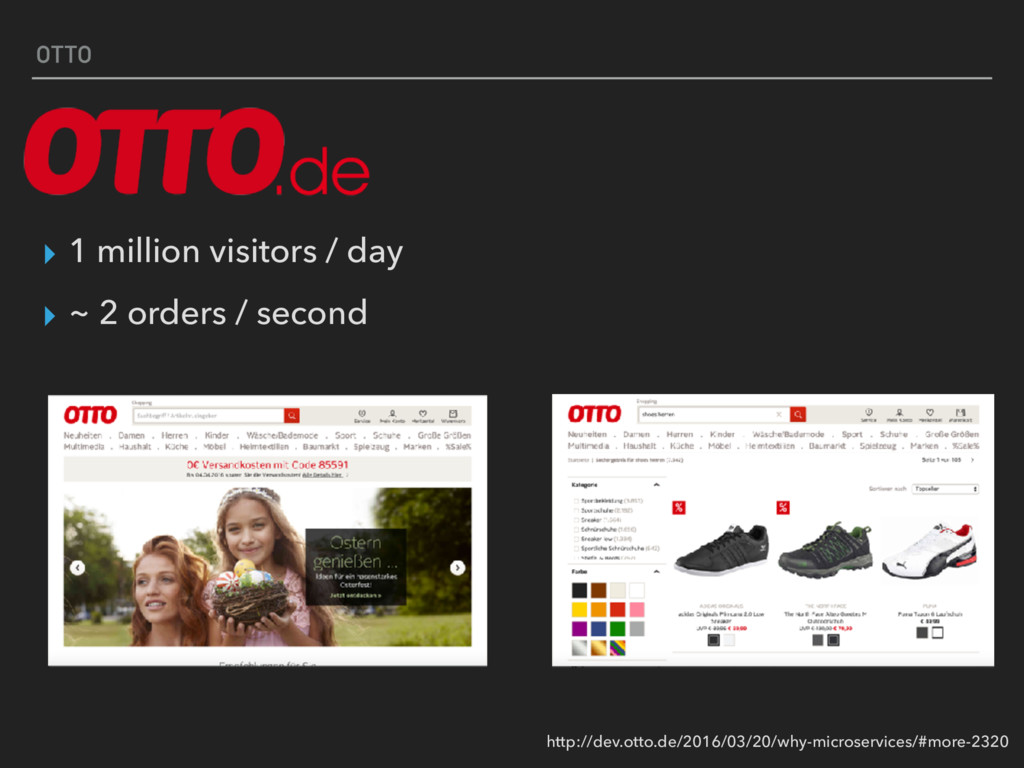
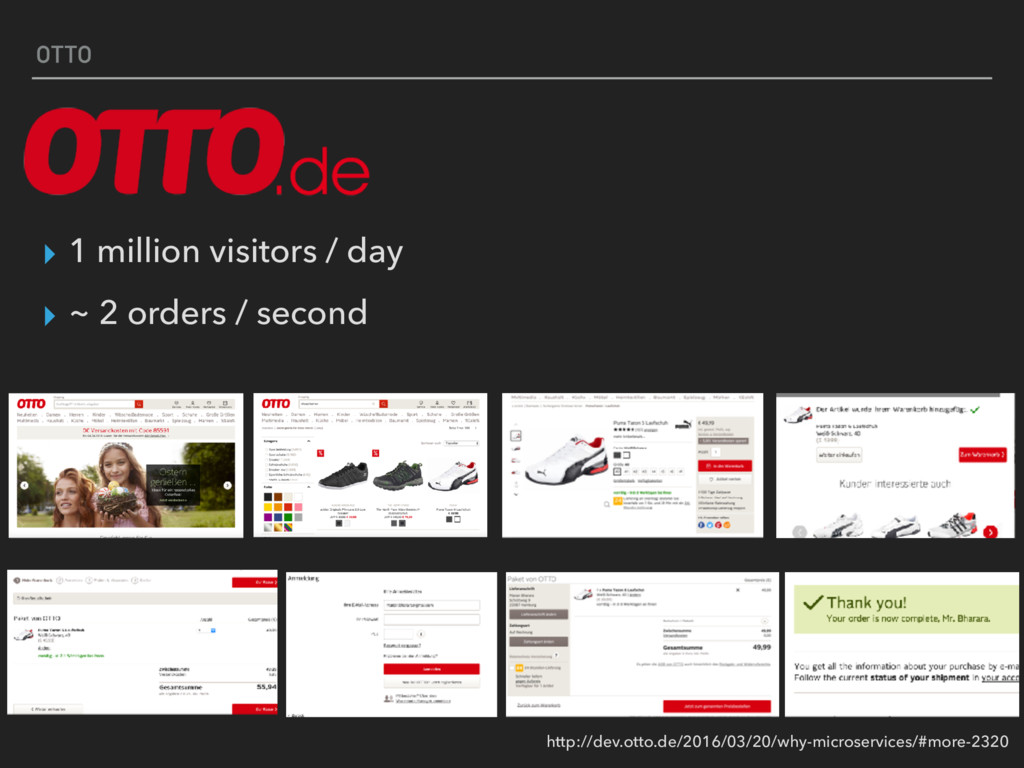
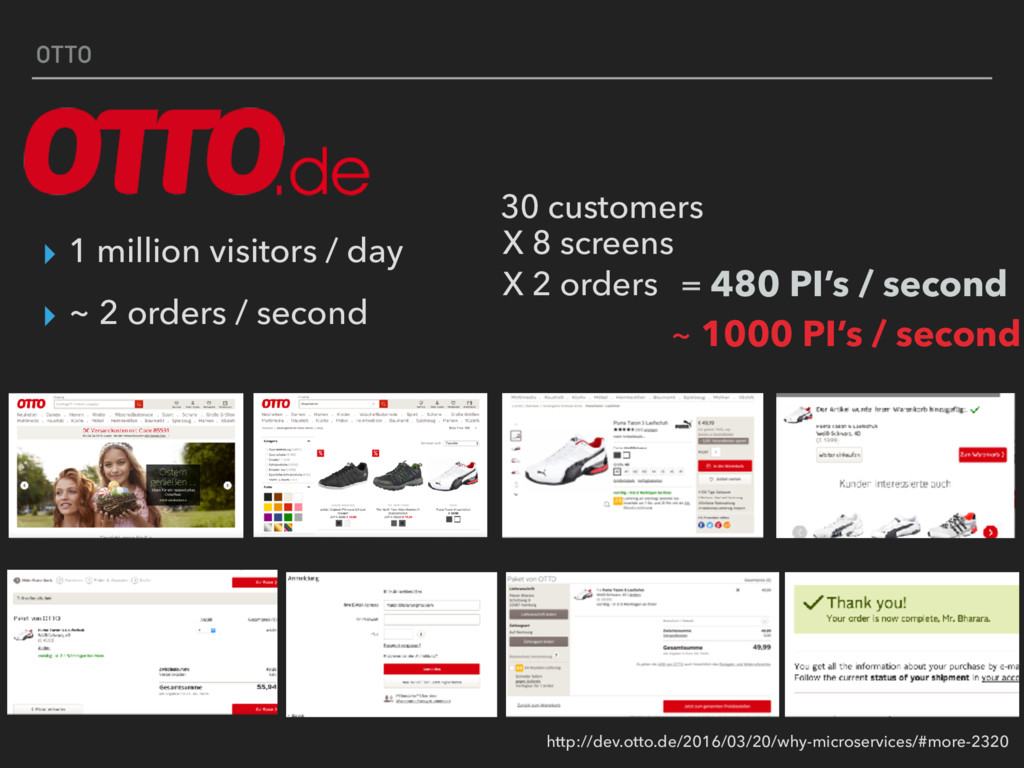
orders / second 30 customers X 8 screens X 2 orders = 480 PI’s / second ~ 1000 PI’s / second http://dev.otto.de/2016/03/20/why-microservices/#more-2320
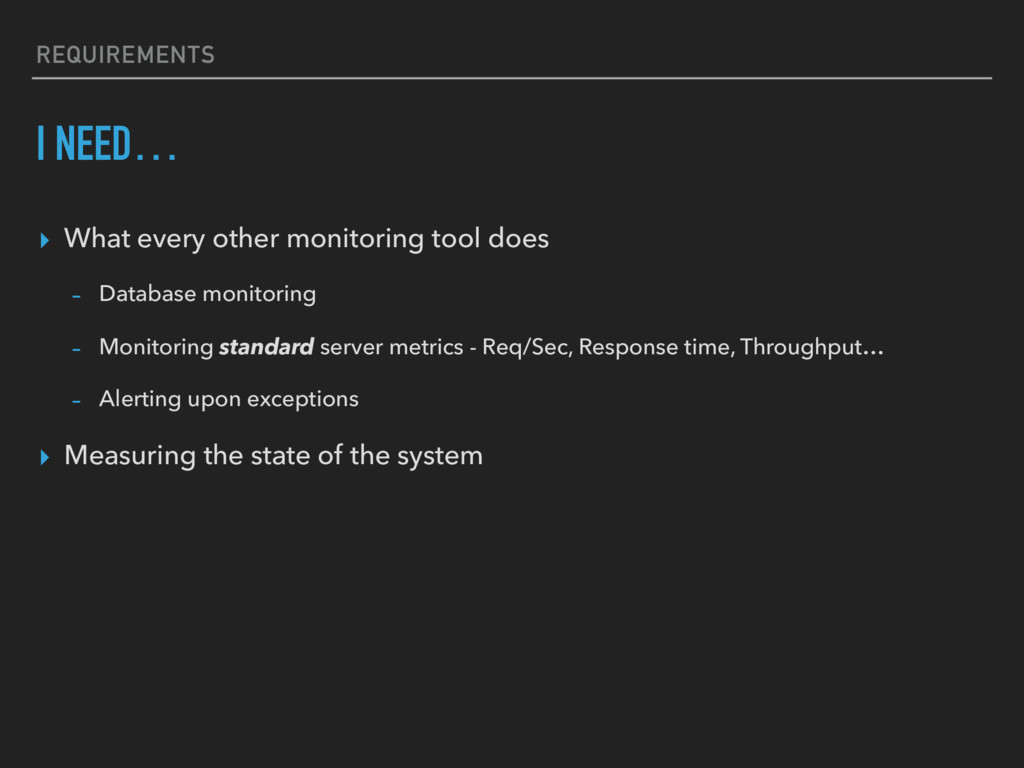
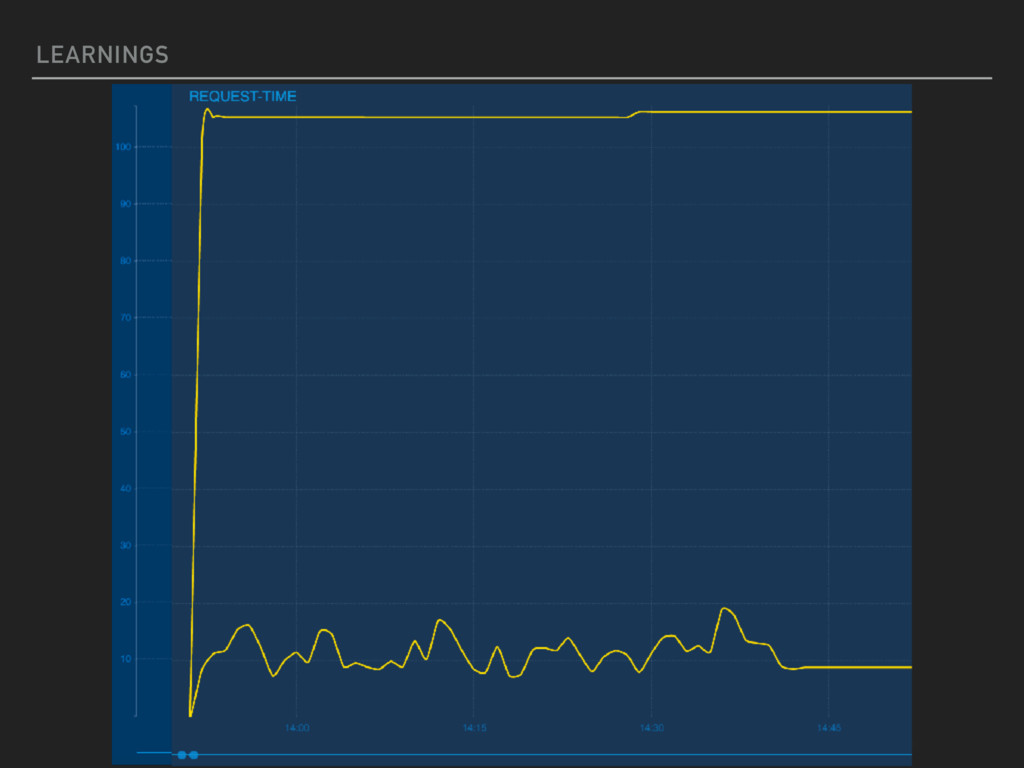
- Database monitoring - Monitoring standard server metrics - Req/Sec, Response time, Throughput… - Alerting upon exceptions ▸ Measuring the state of the system
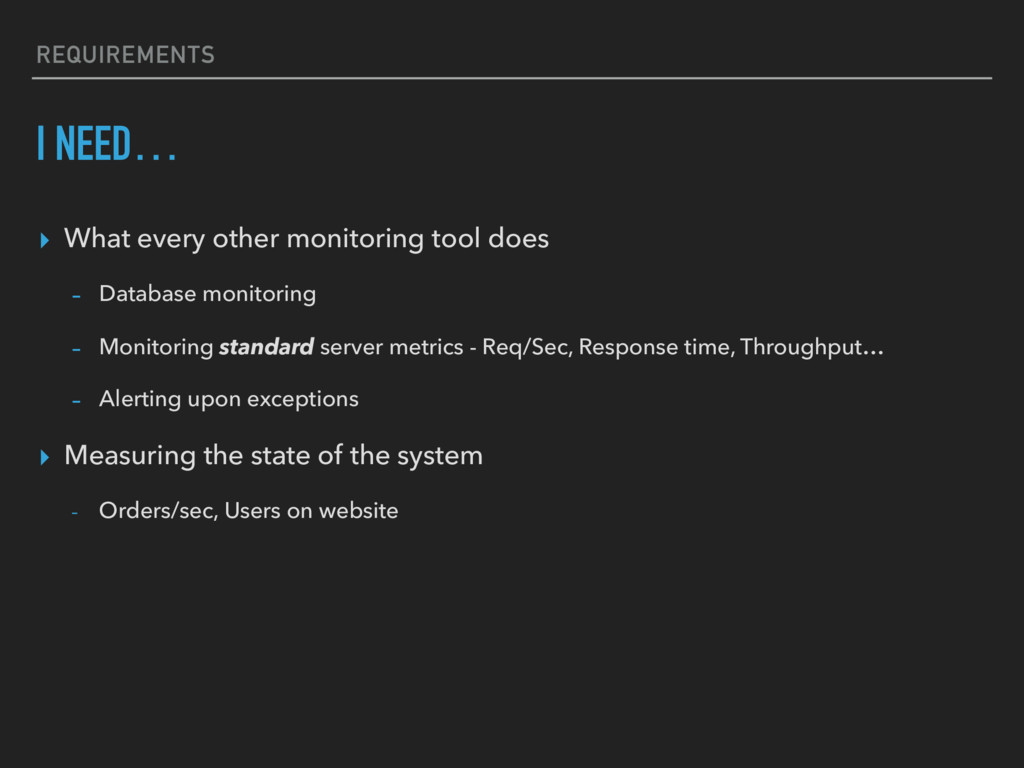
- Database monitoring - Monitoring standard server metrics - Req/Sec, Response time, Throughput… - Alerting upon exceptions ▸ Measuring the state of the system - Orders/sec, Users on website
- Database monitoring - Monitoring standard server metrics - Req/Sec, Response time, Throughput… - Alerting upon exceptions ▸ Measuring the state of the system - Orders/sec, Users on website ▸ Narrow down sources of bottlenecks
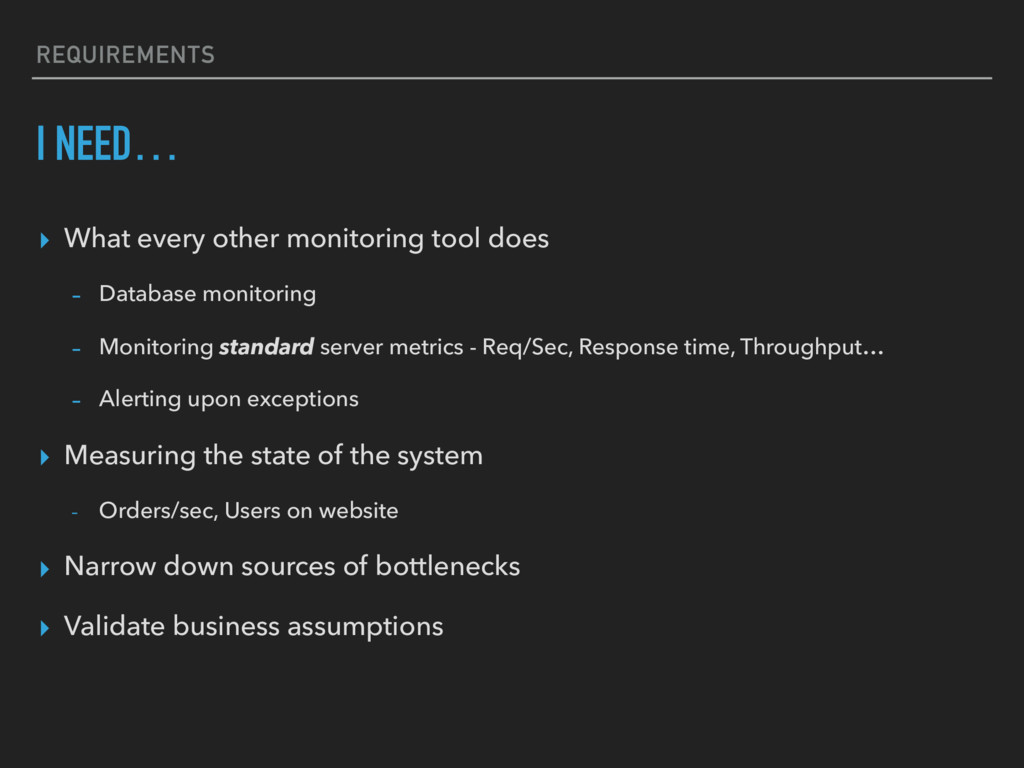
- Database monitoring - Monitoring standard server metrics - Req/Sec, Response time, Throughput… - Alerting upon exceptions ▸ Measuring the state of the system - Orders/sec, Users on website ▸ Narrow down sources of bottlenecks ▸ Validate business assumptions
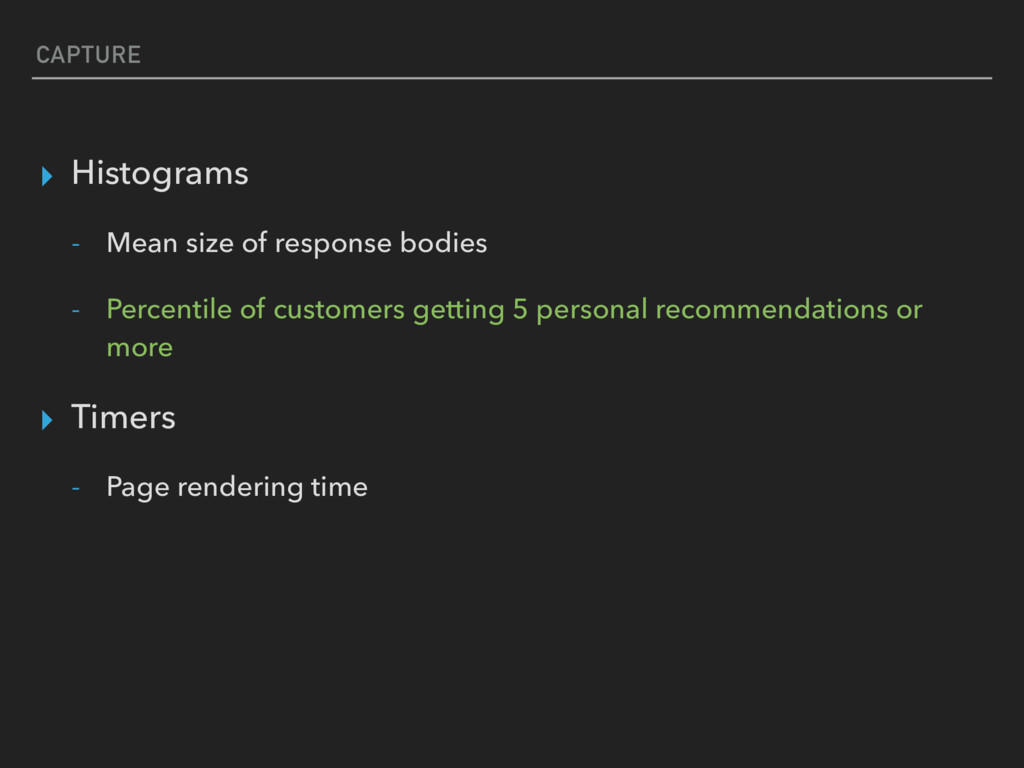
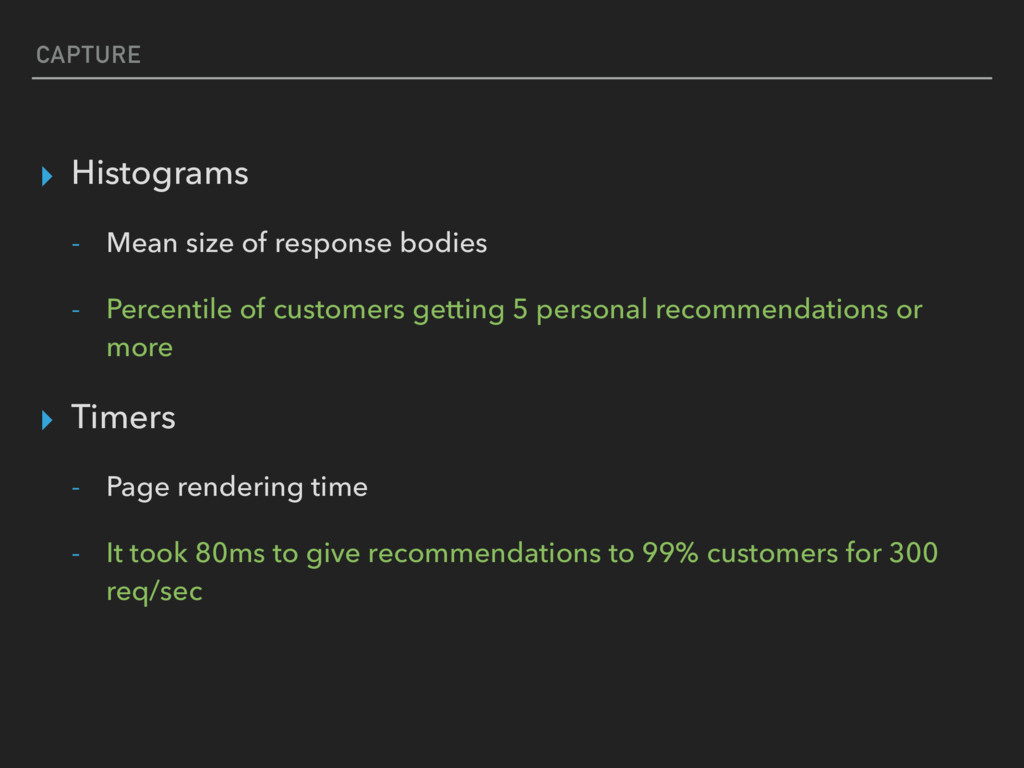
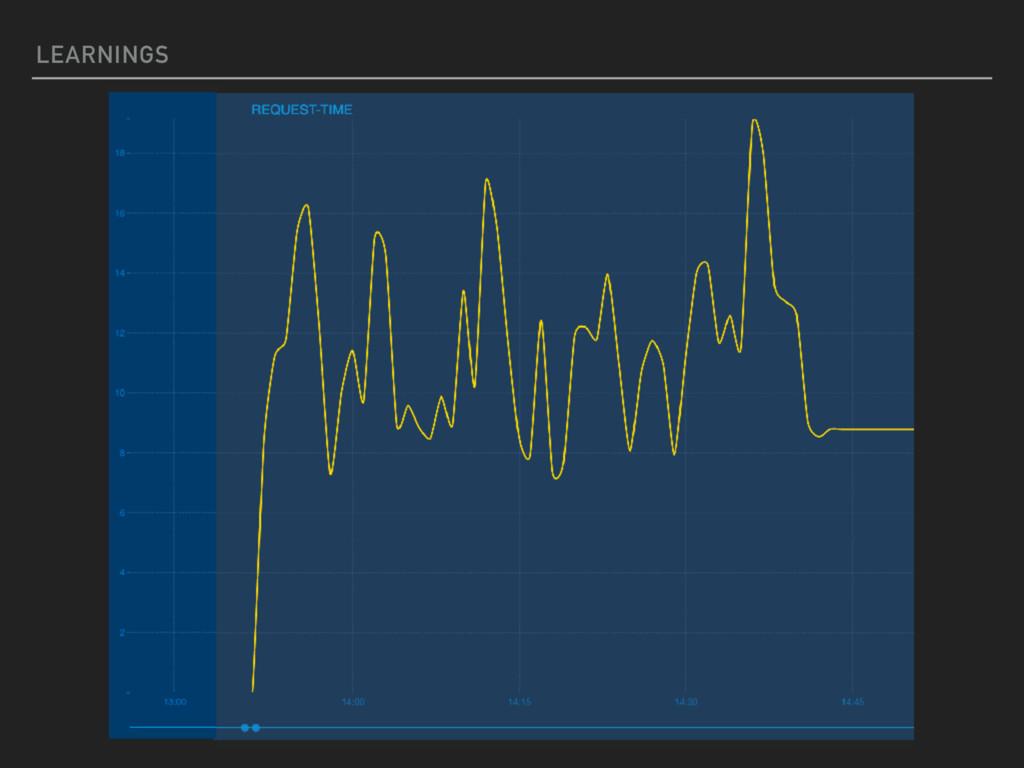
Percentile of customers getting 5 personal recommendations or more ▸ Timers - Page rendering time - It took 80ms to give recommendations to 99% customers for 300 req/sec
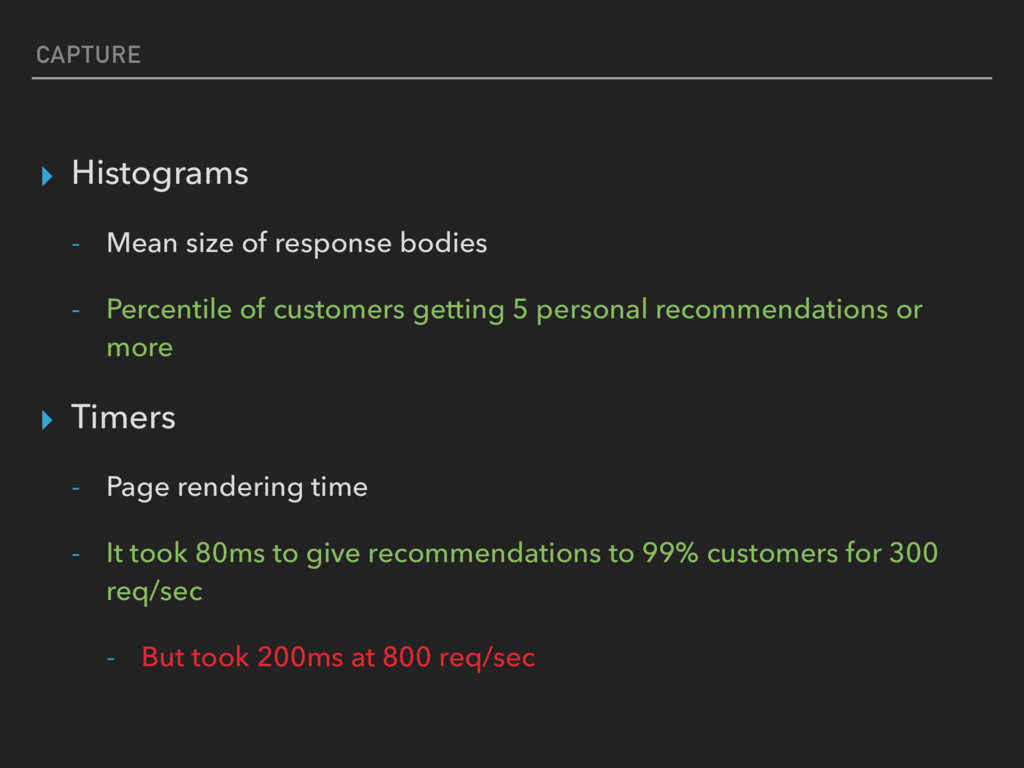
Percentile of customers getting 5 personal recommendations or more ▸ Timers - Page rendering time - It took 80ms to give recommendations to 99% customers for 300 req/sec - But took 200ms at 800 req/sec
Percentile of customers getting 5 personal recommendations or more ▸ Timers - Page rendering time - It took 80ms to give recommendations to 99% customers for 300 req/sec - But took 200ms at 800 req/sec
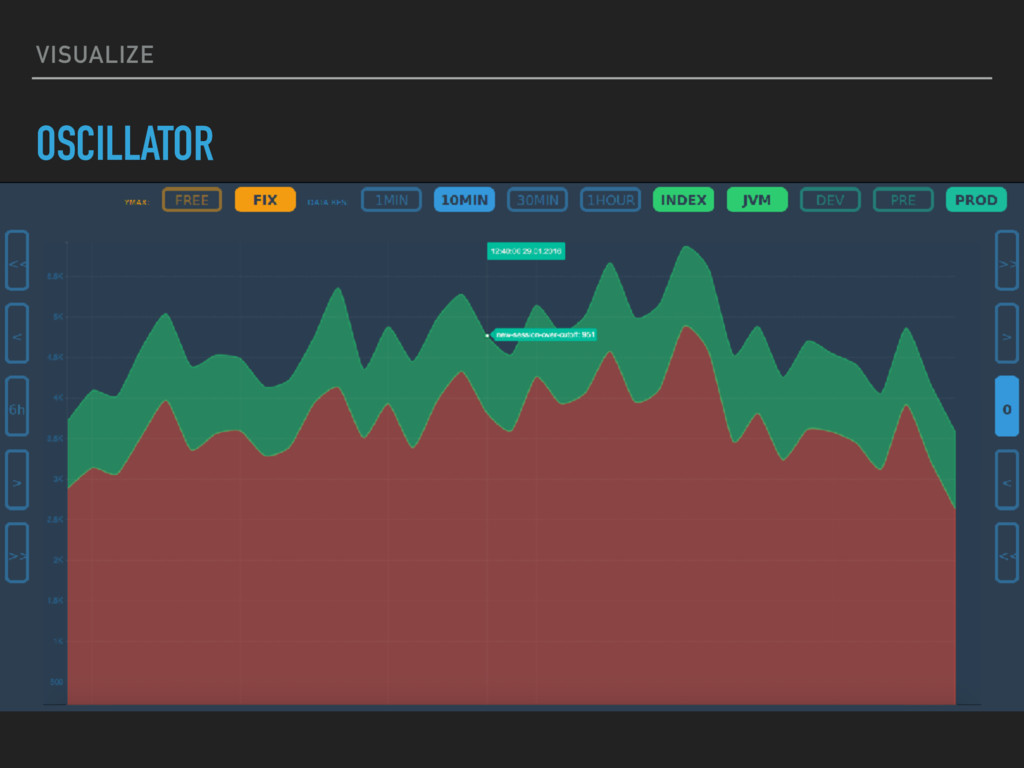
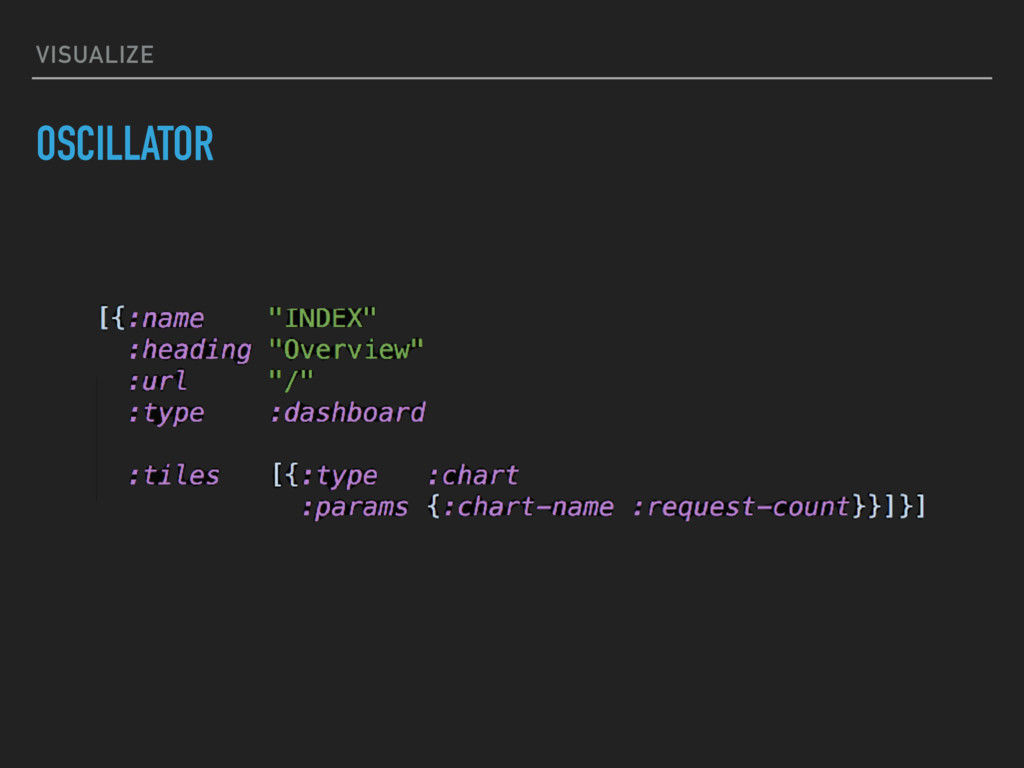
https://www.youtube.com/watch?v=czes-oa0yik ▸ Oscillator - https://github.com/otto-de/oscillator ▸ Xray - https://github.com/otto-de/tesla-xray ▸ OTTO Dev blog - http://dev.otto.de/