The language is getting smarter everyday. But, a language is only as good as the tooling that it comes with.
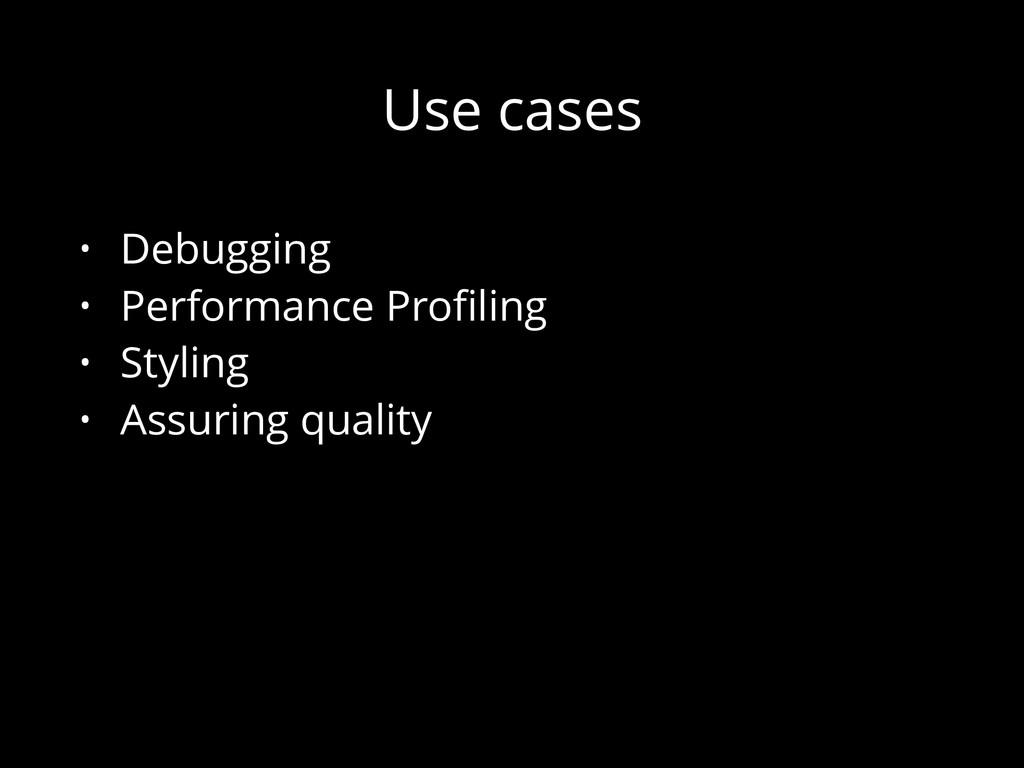
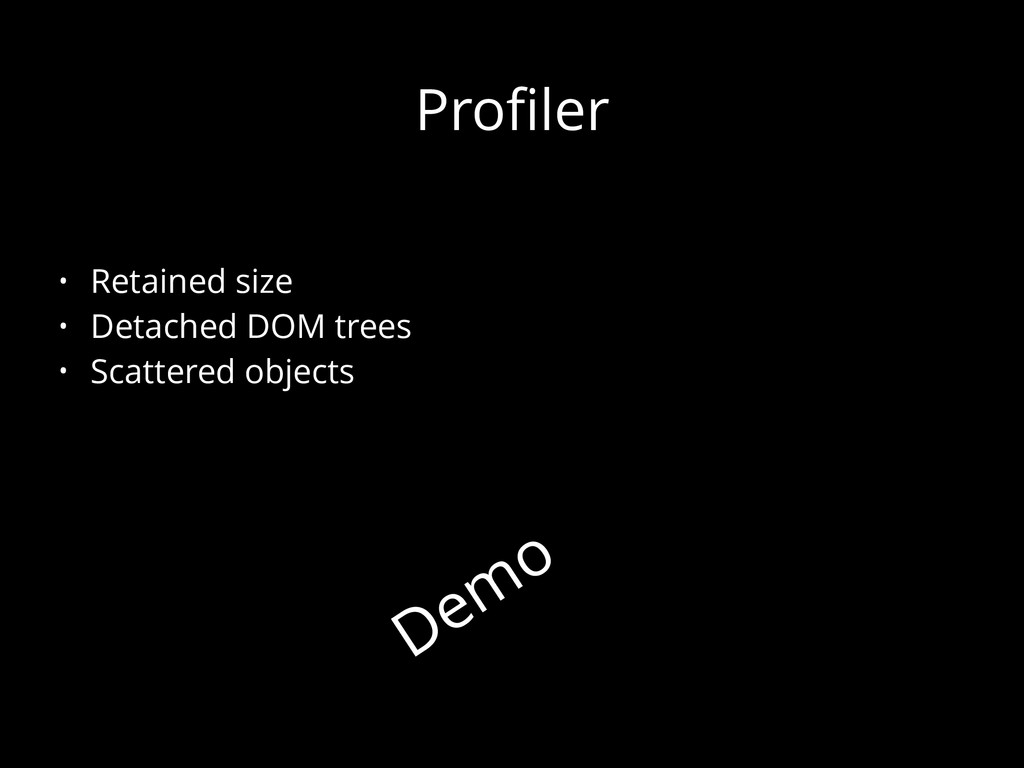
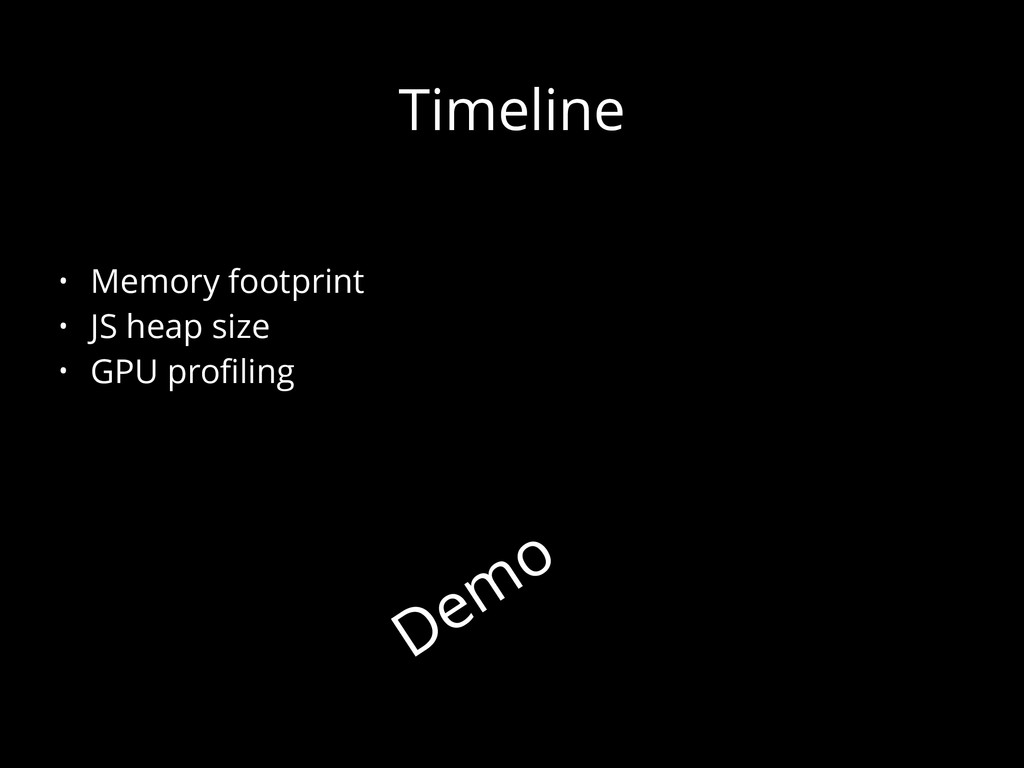
The talk covers some of the latest additions to the Chrome DevTools and enables the audience to understand how this modern day tool helps in speeding up debugging, performance profiling and tooling for complex JavaScript applications. It discusses the Command Line API, the Extensions API, the Debugger in a bit more detail, briefly touches upon the Profiler as well as the Timeline and shows how these can be used for analyzing front end performance.
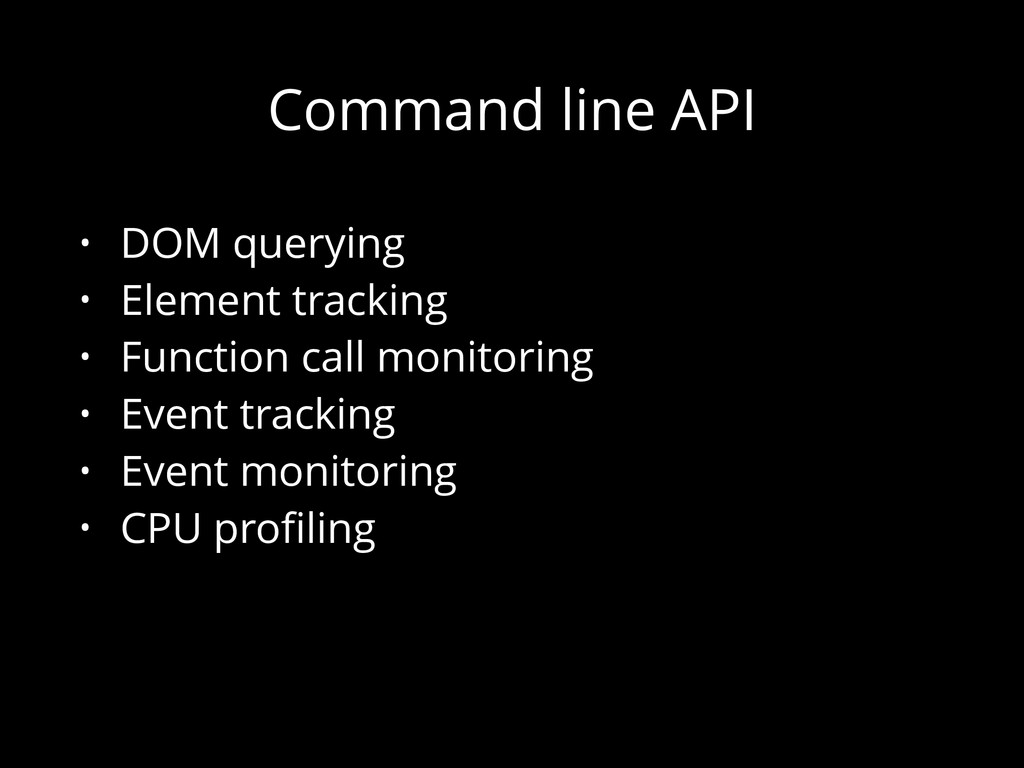
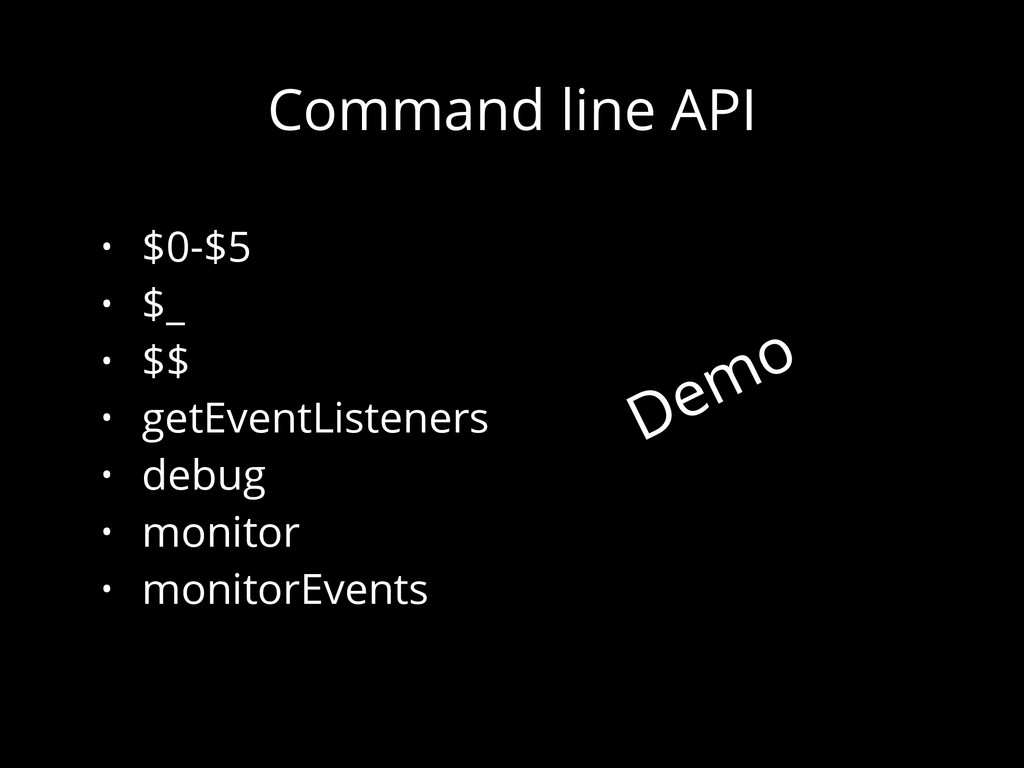
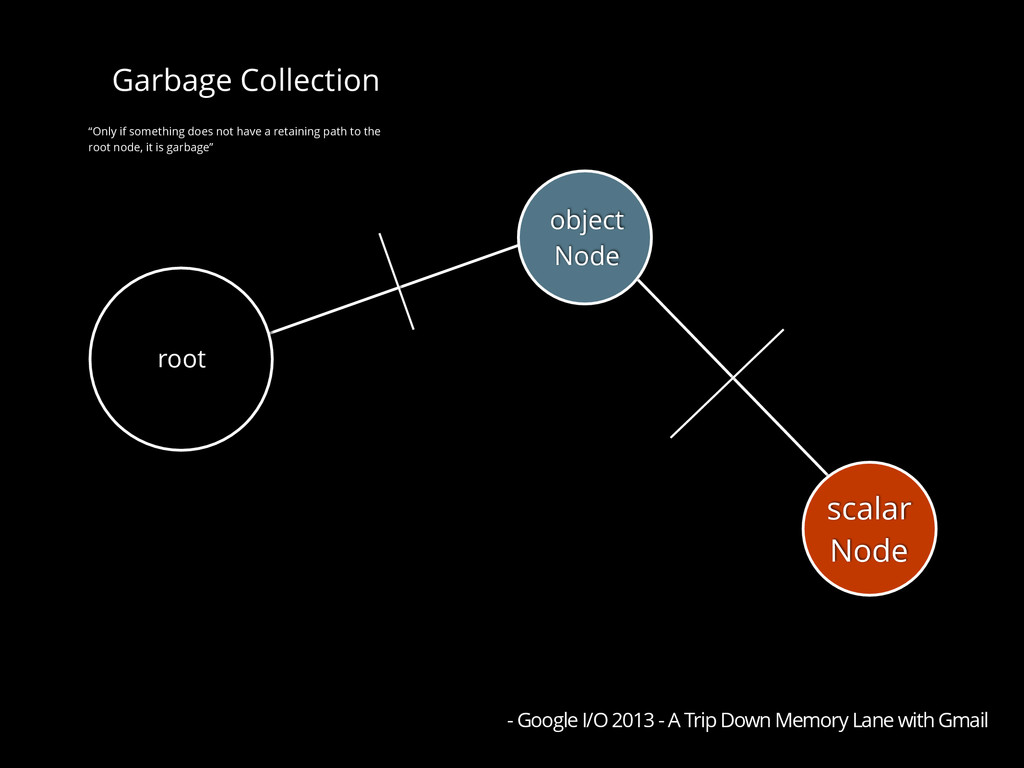
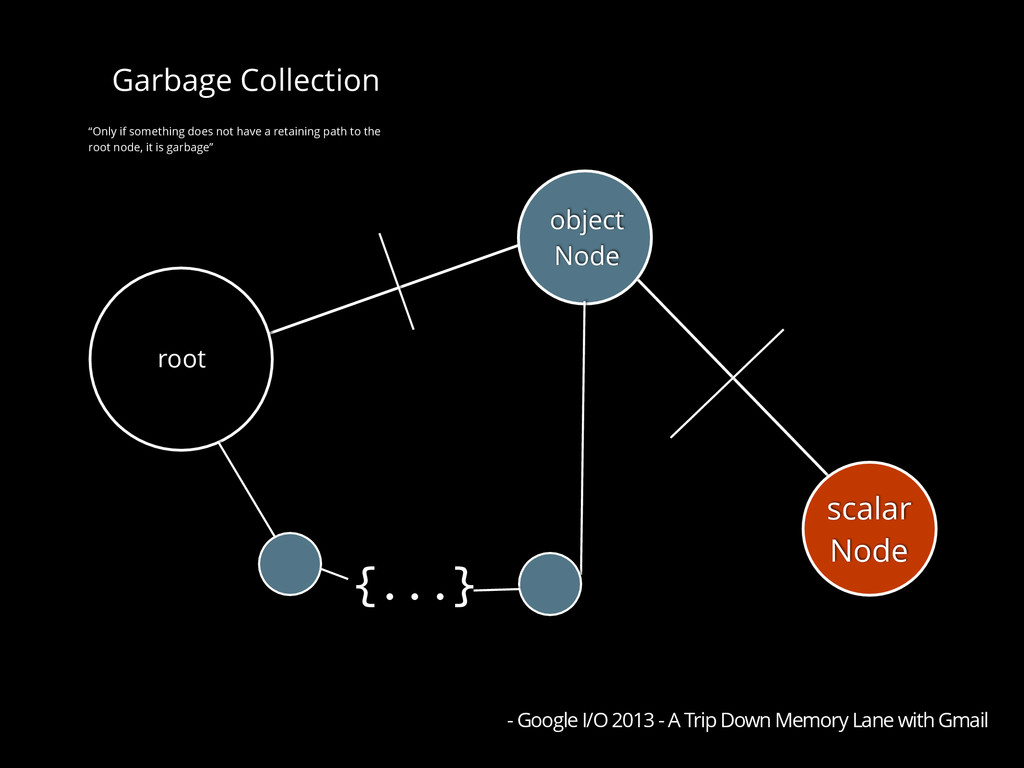
The Command Line API is one of the hidden and less discussed features of the Chrome DevTools. At the same time, it makes life all the more simpler by offering the ability to monitor events/function calls, inspect Objects in detail, query the DOM effortlessly, take/analyze memory profiles. All this, without the need of locating blocks of code and putting breakpoints. The talk showcases the usages with their specific use cases taking help of hands-on demos.
The audience can learn how they have the ability to write their own project specific extensions that offer them complete access to their applications upon opening the DevTools. The extensions API can be used to generate really interesting domain specific insights. We discuss the how-to of writing a DevTools extension while understanding what the extension has access to. We also talk about some good extensions that make development/debugging much easier. Not only does the talk discuss writing new extensions, it also discusses how easy it is to hack into the tools already offered, improving them and contributing to the community.
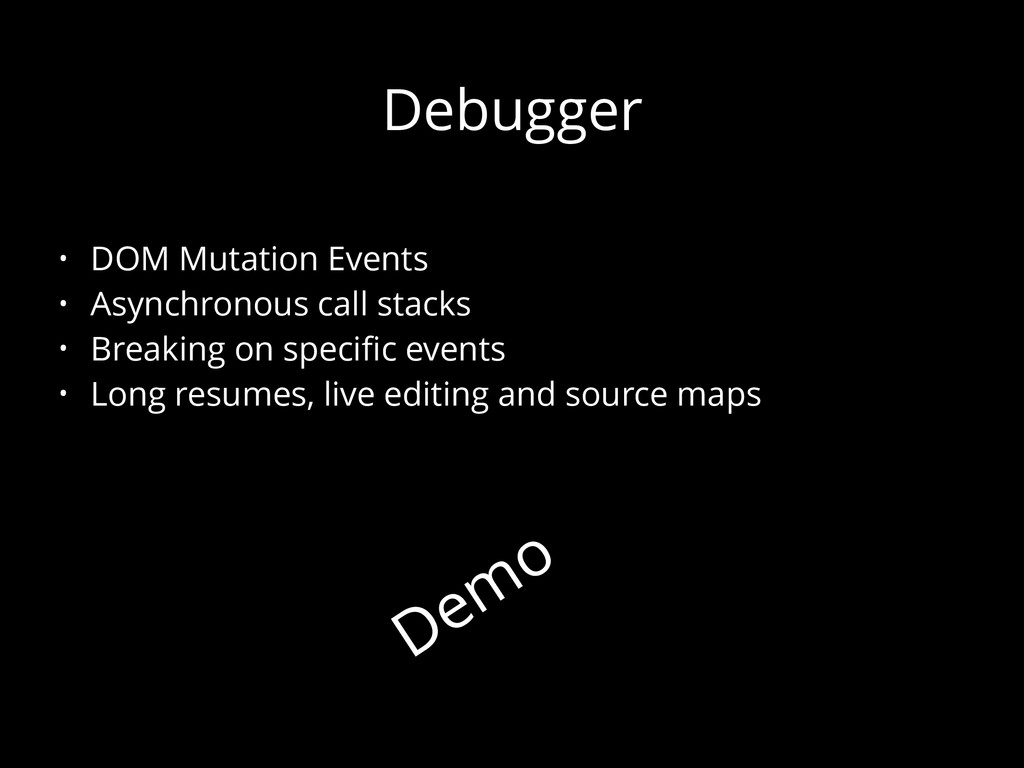
The JavaScript debugger is one of the most powerful debugging tools available. While, breakpoints prove to be really handy in debugging synchronous code, the true power of JavaScript is in its implicit asynchronous nature and this where simple breakpoints sometimes fail. The talk discusses some really smart ways of debugging evented/asynchronous code using Async call stacks, Mutation observers & Async watch expressions.
These tools available today are a result of various inconveniences faced by developers in debugging. It becomes important that when we face problems we make full use of them.