Upgrade to Pro — share decks privately, control downloads, hide ads and more …

Necessary tooling and monitoring for performance critical applications

Manan
April 01, 2016

Necessary tooling and monitoring for performance critical applications

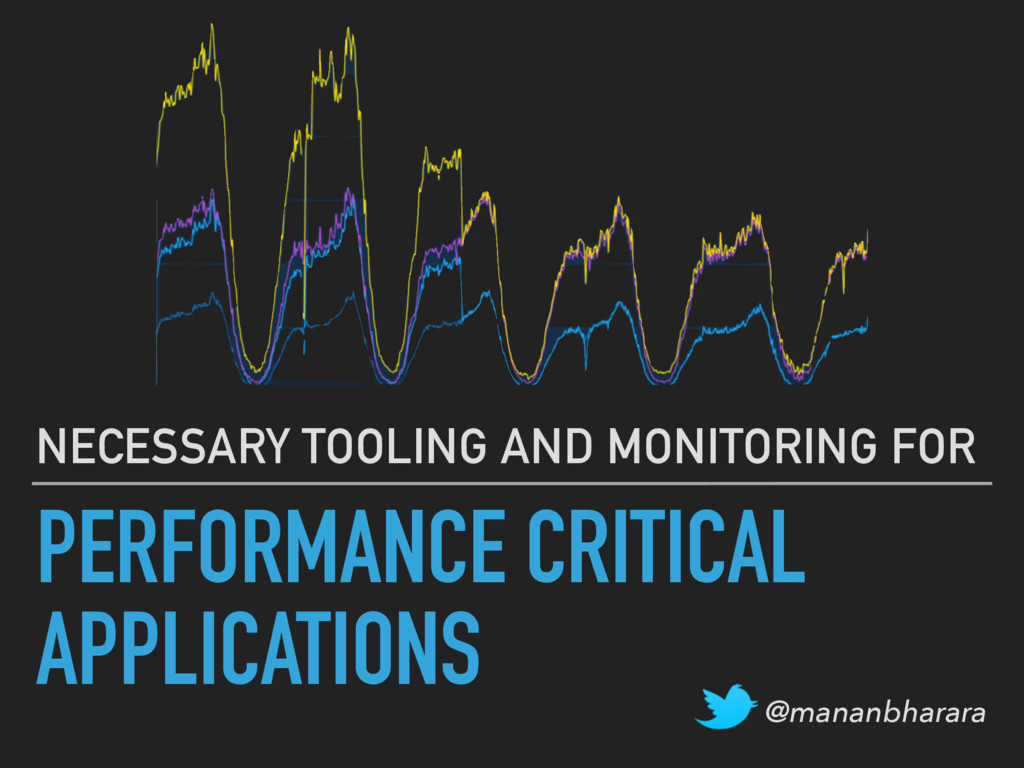
In a competitive market which is heavily based on trust and confidence, ensuring stable performance becomes important. However, with Continuos Delivery, making sure that something doesn’t break becomes a hard problem to solve.

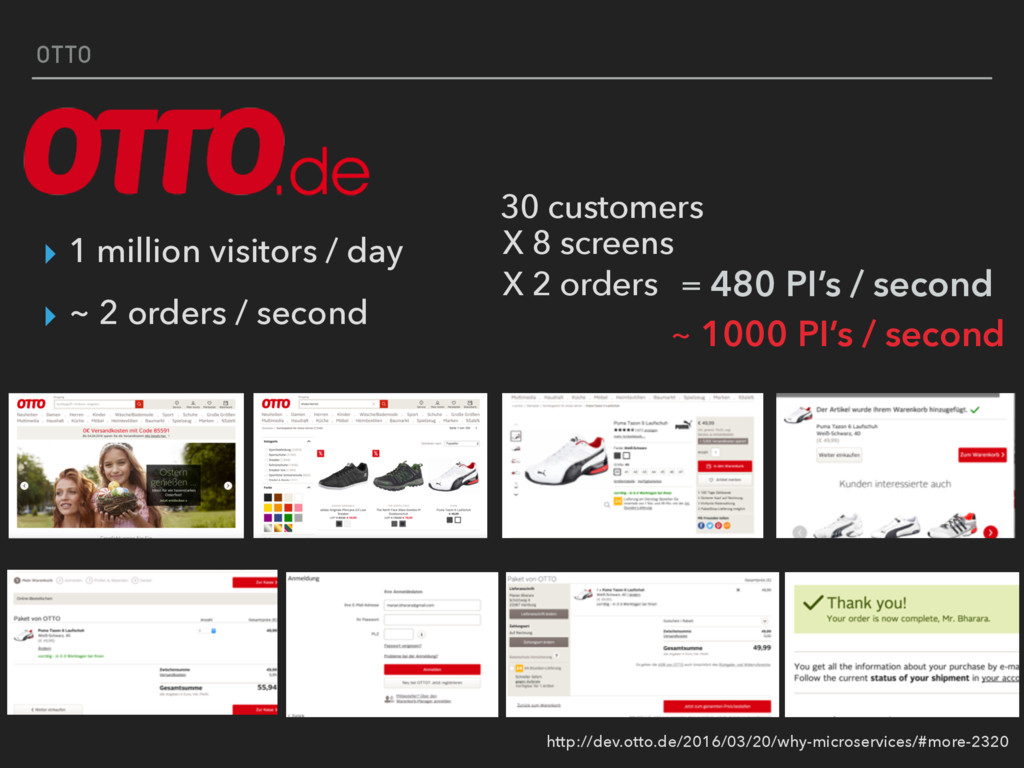
The audience can look forward to an understanding about the performance and error monitoring setup at https://www.otto.de/, a hugely successful e-commerce application. I plan to share experiences around how the monitoring set up is able to equip the developers with enough knowledge to debug and fix critical performance issues before the users could see and how we can use such metrics to create automated alarms to alert project teams about any performance problems as well as security threats.

Manan

April 01, 2016
Tweet

More Decks by Manan

Other Decks in Programming

Transcript

  1. OTTO ▸ 1 million visitors / day ▸ ~ 2

    orders / second http://dev.otto.de/2016/03/20/why-microservices/#more-2320
  2. OTTO ▸ 1 million visitors / day ▸ ~ 2

    orders / second http://dev.otto.de/2016/03/20/why-microservices/#more-2320
  3. OTTO ▸ 1 million visitors / day ▸ ~ 2

    orders / second http://dev.otto.de/2016/03/20/why-microservices/#more-2320
  4. OTTO ▸ 1 million visitors / day ▸ ~ 2

    orders / second 30 customers X 8 screens X 2 orders = 480 PI’s / second http://dev.otto.de/2016/03/20/why-microservices/#more-2320
  5. OTTO ▸ 1 million visitors / day ▸ ~ 2

    orders / second 30 customers X 8 screens X 2 orders = 480 PI’s / second ~ 1000 PI’s / second http://dev.otto.de/2016/03/20/why-microservices/#more-2320
  6. WHY? WHAT MAKES THIS DIFFERENT ▸ We’re talking money… ▸

    Building more features => Adding more value
  7. WHY? WHAT MAKES THIS DIFFERENT ▸ We’re talking money… ▸

    Building more features => Adding more value => > money
  8. WHY? WHAT MAKES THIS DIFFERENT ▸ We’re talking money… ▸

    Building more features ▸ Decision making => Adding more value => > money
  9. WHY? WHAT MAKES THIS DIFFERENT ▸ We’re talking money… ▸

    Building more features ▸ Decision making ▸ Verify business assumptions => Adding more value => > money
  10. WHY? WHAT MAKES THIS DIFFERENT ▸ We’re talking money… ▸

    Building more features ▸ Decision making ▸ Verify business assumptions => Adding more value => > money 300 billion 3 trillion
  11. REQUIREMENTS I NEED… ▸ What every other monitoring tool does

    - Database monitoring - Monitoring standard server metrics - Req/Sec, Response time, Throughput…
  12. REQUIREMENTS I NEED… ▸ What every other monitoring tool does

    - Database monitoring - Monitoring standard server metrics - Req/Sec, Response time, Throughput… - Alerting upon exceptions
  13. REQUIREMENTS I NEED… ▸ What every other monitoring tool does

    - Database monitoring - Monitoring standard server metrics - Req/Sec, Response time, Throughput… - Alerting upon exceptions ▸ Measuring the state of the system
  14. REQUIREMENTS I NEED… ▸ What every other monitoring tool does

    - Database monitoring - Monitoring standard server metrics - Req/Sec, Response time, Throughput… - Alerting upon exceptions ▸ Measuring the state of the system - Orders/sec, Users on website
  15. REQUIREMENTS I NEED… ▸ What every other monitoring tool does

    - Database monitoring - Monitoring standard server metrics - Req/Sec, Response time, Throughput… - Alerting upon exceptions ▸ Measuring the state of the system - Orders/sec, Users on website ▸ Narrow down sources of bottlenecks
  16. REQUIREMENTS I NEED… ▸ What every other monitoring tool does

    - Database monitoring - Monitoring standard server metrics - Req/Sec, Response time, Throughput… - Alerting upon exceptions ▸ Measuring the state of the system - Orders/sec, Users on website ▸ Narrow down sources of bottlenecks ▸ Validate business assumptions
  17. METRICS HELP IN UNDERSTANDING THE STATE OF THE SYSTEM AND

    GAIN VALUABLE INSIGHTS… CAPTURE ANYTIME
  18. WHY? Collecting data is cheap, but not having it when

    you need it can be expensive, so you should instrument everything, and collect all the useful data you reasonably can… https://www.datadoghq.com
  19. METRICS Measure the behavior of critical components in your production

    environment… CAPTURE http://metrics.dropwizard.io/3.1.0/
  20. METRICS Measure the behavior of critical components in your production

    environment… CAPTURE http://metrics.dropwizard.io/3.1.0/
  21. METRICS Measure the behavior of critical components in your production

    environment… CAPTURE http://metrics.dropwizard.io/3.1.0/
  22. METRICS Measure the behavior of critical components in your production

    environment… CAPTURE http://metrics.dropwizard.io/3.1.0/
  23. METRICS Measure the behavior of critical components in your production

    environment… CAPTURE http://metrics.dropwizard.io/3.1.0/
  24. METRICS Measure the behavior of critical components in your production

    environment… CAPTURE http://metrics.dropwizard.io/3.1.0/
  25. CAPTURE ▸ Counters - HTTP/any connection pools ▸ Gauges -

    Used disk space ▸ Meters - Requests per second
  26. CAPTURE ▸ Counters - HTTP/any connection pools ▸ Gauges -

    Used disk space ▸ Meters - Requests per second - Number of personalized users - Number of cached products - Orders per second
  27. CAPTURE ▸ Counters - HTTP/any connection pools ▸ Gauges -

    Used disk space ▸ Meters - Requests per second - Number of personalized users - Number of cached products - Orders per second
  28. CAPTURE ▸ Histograms - Mean size of response bodies -

    Percentile of customers getting 5 personal recommendations or more
  29. CAPTURE ▸ Histograms - Mean size of response bodies -

    Percentile of customers getting 5 personal recommendations or more ▸ Timers
  30. CAPTURE ▸ Histograms - Mean size of response bodies -

    Percentile of customers getting 5 personal recommendations or more ▸ Timers - Page rendering time
  31. CAPTURE ▸ Histograms - Mean size of response bodies -

    Percentile of customers getting 5 personal recommendations or more ▸ Timers - Page rendering time - It took 80ms to give recommendations to 99% customers for 300 req/sec
  32. CAPTURE ▸ Histograms - Mean size of response bodies -

    Percentile of customers getting 5 personal recommendations or more ▸ Timers - Page rendering time - It took 80ms to give recommendations to 99% customers for 300 req/sec - But took 200ms at 800 req/sec
  33. CAPTURE ▸ Histograms - Mean size of response bodies -

    Percentile of customers getting 5 personal recommendations or more ▸ Timers - Page rendering time - It took 80ms to give recommendations to 99% customers for 300 req/sec - But took 200ms at 800 req/sec
  34. ▸ Graphing ▸ Query DSL ▸ Running graphite in cluster

    mode AGGREGATE GRAPHITE GRAPHITE-WEB CARBON CACHE
  35. ▸ Graphing ▸ Query DSL ▸ Running graphite in cluster

    mode ▸ Up to date AGGREGATE GRAPHITE GRAPHITE-WEB CARBON CACHE
  36. VISUALIZE GRAPHITE WEB ‣Difficult to drill down ‣Non Interactive ‣Query

    language and editor is prone to mistakes ‣Difficult to correlate changes in graphs to events
  37. LEARNINGS LEARNINGS ▸ Choose the right metrics - Disk utilization,

    User logins ▸ Mean can be absurd - Choose wisely
  38. LEARNINGS LEARNINGS ▸ Choose the right metrics - Disk utilization,

    User logins ▸ Mean can be absurd - Choose wisely
  39. LEARNINGS LEARNINGS ▸ Choose the right metrics - Disk utilization,

    User logins ▸ Mean can be absurd - Choose wisely ▸ Choose the right tool for the job. Histograms, counters, meters, timers.
  40. SOFTWARE THAT CLAIMS TO MONITOR EVERYTHING FOR YOU ▸ Hooks

    into individual function calls CURRENT SETUP
  41. SOFTWARE THAT CLAIMS TO MONITOR EVERYTHING FOR YOU ▸ Hooks

    into individual function calls ▸ Could be too expensive CURRENT SETUP
  42. SOFTWARE THAT CLAIMS TO MONITOR EVERYTHING FOR YOU ▸ Hooks

    into individual function calls ▸ Could be too expensive ▸ A great monitoring and alerting setup is possible for free CURRENT SETUP
  43. THANKS! @mananbharara @mananbharara READ MORE ▸ Metrics, Metrics, Everywhere -

    https://www.youtube.com/watch?v=czes-oa0yik ▸ Oscillator - https://github.com/otto-de/oscillator ▸ Xray - https://github.com/otto-de/tesla-xray ▸ OTTO Dev blog - http://dev.otto.de/