Upgrade to Pro
— share decks privately, control downloads, hide ads and more …
Speaker Deck
Features
Speaker Deck
PRO
Sign in
Sign up for free
Search
Search
Advanced Modular Software Performance Monitoring
Search
Sponsored
·
SiteGround - Reliable hosting with speed, security, and support you can count on.
→
Sasha Mazurov
May 30, 2012
Technology
270
1
Share
Embed
Copy iframe code
Copy JS code
Copy link
Start on current slide
Advanced Modular Software Performance Monitoring
CPU profiling with Intel® VTune™ Amplifier XE
Sasha Mazurov
May 30, 2012
More Decks by Sasha Mazurov
See All by Sasha Mazurov
L1Calo Offline Software Status
mazurov
0
81
Performance and Regression tests for Simulation
mazurov
0
100
About v2
mazurov
0
80
L1Calo Offline Software Status
mazurov
0
110
L1Calo Offline Software Status
mazurov
0
110
LHCbPR V2
mazurov
0
150
Paper approval
mazurov
0
93
Conventions' Publications
mazurov
0
78
Ph.D final exam
mazurov
0
140
Other Decks in Technology
See All in Technology
「ビジネスがわかるエンジニア」とは何か?
ryooob
0
350
“詰む”前に仕組みを作れ 〜技術の波に溺れないためのキャッチアップ術〜
takasyou
7
4.3k
本当の”仕事”を手放せる未来が見えた
mu7889yoon
0
190
飲食店もAIで。レジ締めやハンディシステムをつくってる話 / Using AI for restaurant management
vtryo
0
200
5分でわかる Amazon Connect_20260608
hwangbyeonghun
0
130
Multi-Agent並列開発を 安全に回すための技術 / Technology for Safely Multi-Agent Parallel Development
tooppoo
0
220
いまさら聞けない「仕様駆動開発入門」 〜AI活用時代の開発プロセスを考える〜
findy_eventslides
2
230
秘密度ラベル初心者が第1歩でつまづかないための「設計・運用」ポイント
seafay
PRO
1
520
脱SaaS!FDEを支えるプロビジョニングと分離設計
knih
0
300
AI Agentをシステムに組み込む前にゆるく向き合ってみる
hayama17
0
170
AIペネトレーションテスト・ セキュリティ検証「AgenticSec」紹介資料
laysakura
2
7.7k
製造現場での生成AIの活用、およびエージェントAIの実装のあり方、AVEVAの取り組み
iotcomjpadmin
0
180
Featured
See All Featured
Between Models and Reality
mayunak
4
350
Visual Storytelling: How to be a Superhuman Communicator
reverentgeek
2
570
Introduction to Domain-Driven Design and Collaborative software design
baasie
1
870
Git: the NoSQL Database
bkeepers
PRO
432
67k
Making the Leap to Tech Lead
cromwellryan
135
9.9k
DevOps and Value Stream Thinking: Enabling flow, efficiency and business value
helenjbeal
1
250
Paper Plane (Part 1)
katiecoart
PRO
0
9.3k
Navigating the moral maze — ethical principles for Al-driven product design
skipperchong
2
400
Everyday Curiosity
cassininazir
0
240
A Soul's Torment
seathinner
6
3k
The Art of Programming - Codeland 2020
erikaheidi
57
14k
Navigating Team Friction
lara
192
16k
Transcript
Advanced Modular Software Performance Monitoring CPU profiling with Intel® VTune™
Amplifier XE Alexander Mazurov Ferrara University, CERN
2 I. Event Processing Software II. Profilers III. Intel® VTune™
Amplifier XE IV. Gaudi Framework V. Gaudi Intel Profiler Auditor VI. Profiling examples
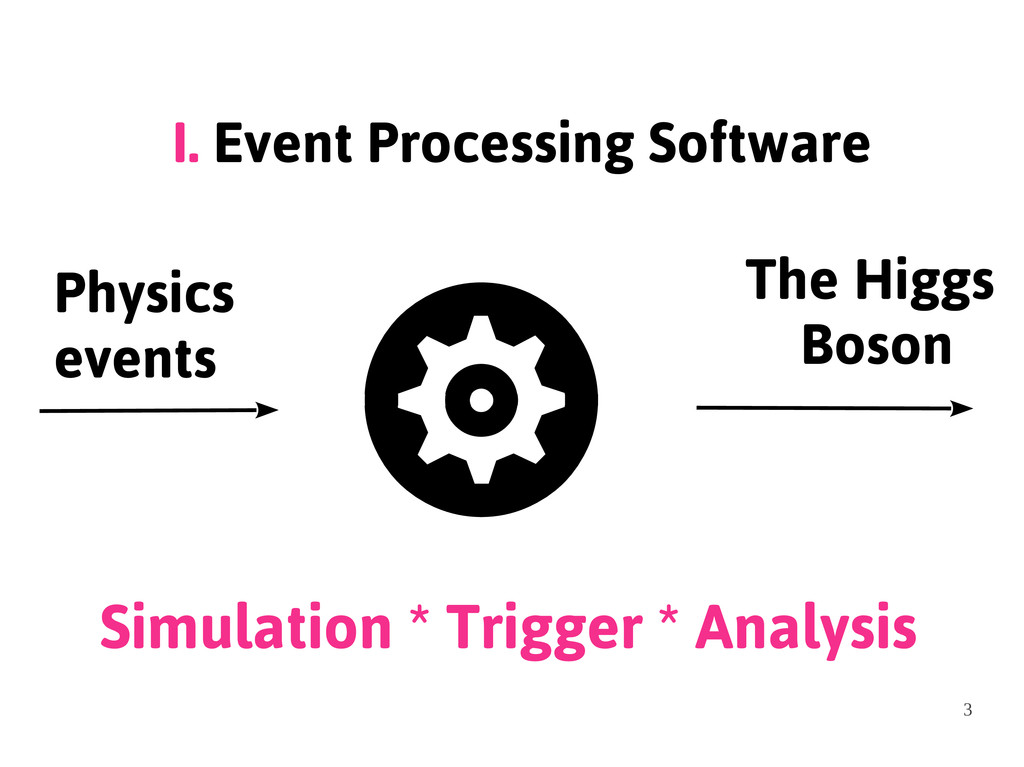
3 Physics events The Higgs Boson Simulation * Trigger *
Analysis I. Event Processing Software
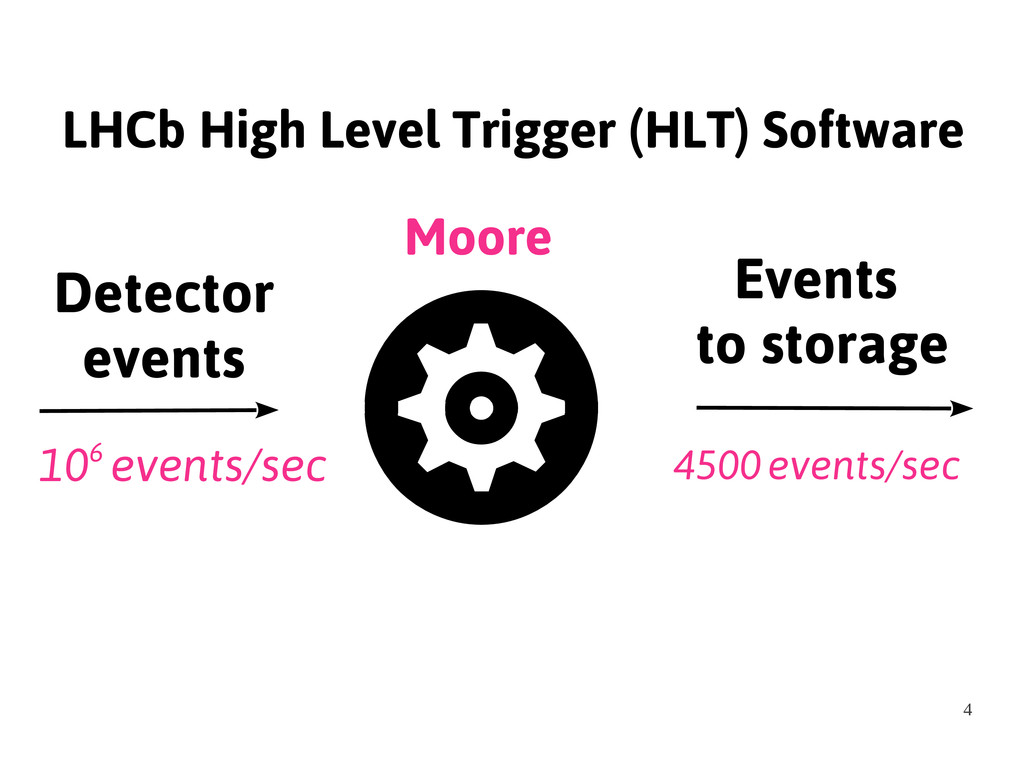
4 Detector events Events to storage 106 events/sec 4500 events/sec
LHCb High Level Trigger (HLT) Software Moore
5 II. Profilers Collect information related to how an
application or system perform.
6 Measure frequency and duration of functions calls and/or code
instructions. CPU Profiler
7 Profiling Techniques - Hardware counters - Instrumenting the code
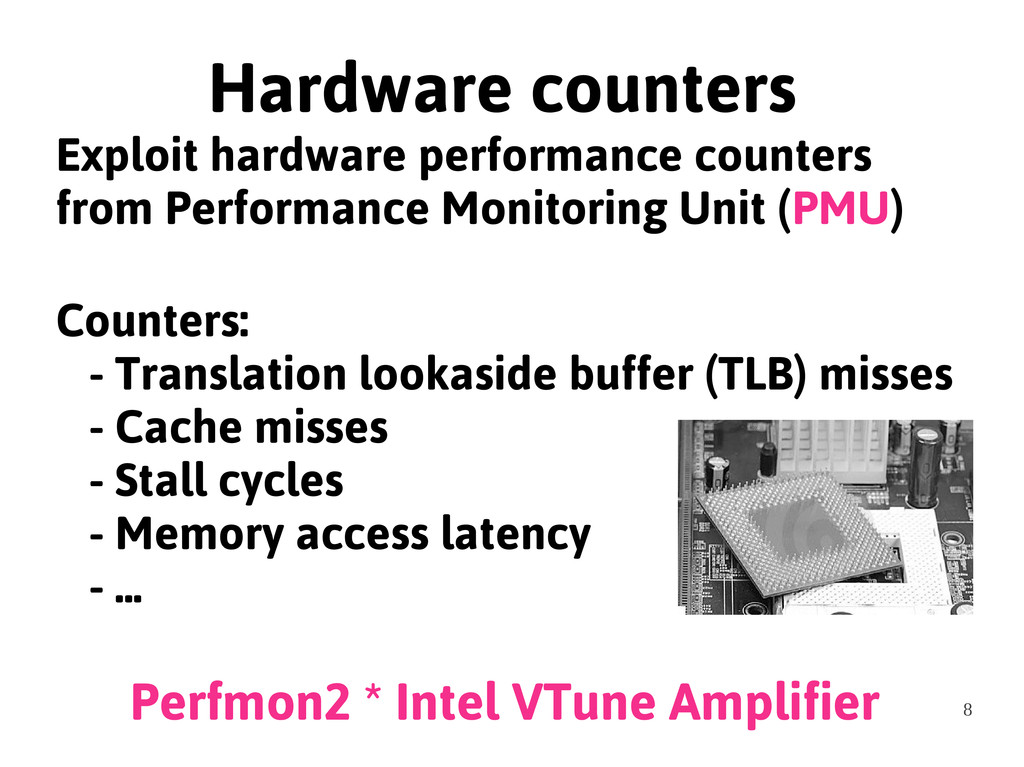
8 Hardware counters Exploit hardware performance counters from Performance Monitoring
Unit (PMU) Counters: - Translation lookaside buffer (TLB) misses - Cache misses - Stall cycles - Memory access latency - ... Perfmon2 * Intel VTune Amplifier
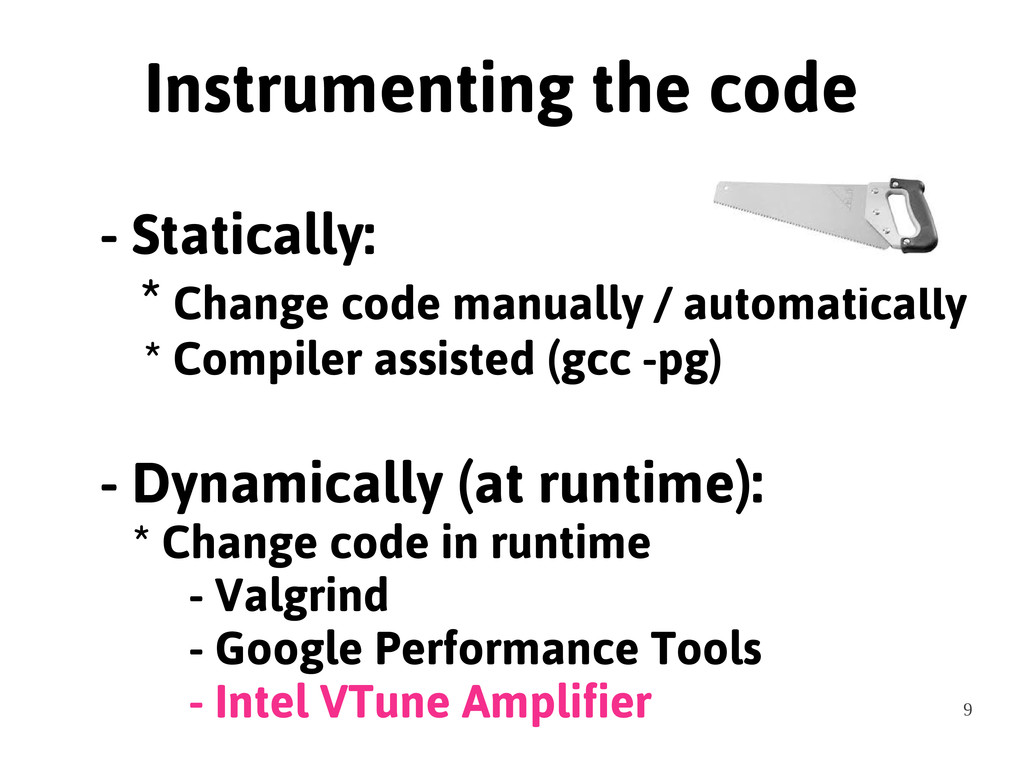
9 Instrumenting the code - Statically: * Change code manually
/ automatically * Compiler assisted (gcc -pg) - Dynamically (at runtime): * Change code in runtime - Valgrind - Google Performance Tools - Intel VTune Amplifier
10 III. VTune™ Amplifier XE Performance Profiling Tool - x86
(32 and 64-bit) - GUI and CLI
11 VTune™ Features Runtime instrumenting profiler - User-mode sampling -
Hardware-based sampling - Concurrency and locks and waits analysis - Threading timeline - Attach to a running process - Source view
12 1) Interupts a process 2) Collect samples of all
active instruction addresses 3) Restore a call sequence upon each sample. How user-mode sampling works?
13 User-mode analysis types - Hotspots - Concurrency - Locks
and Waits
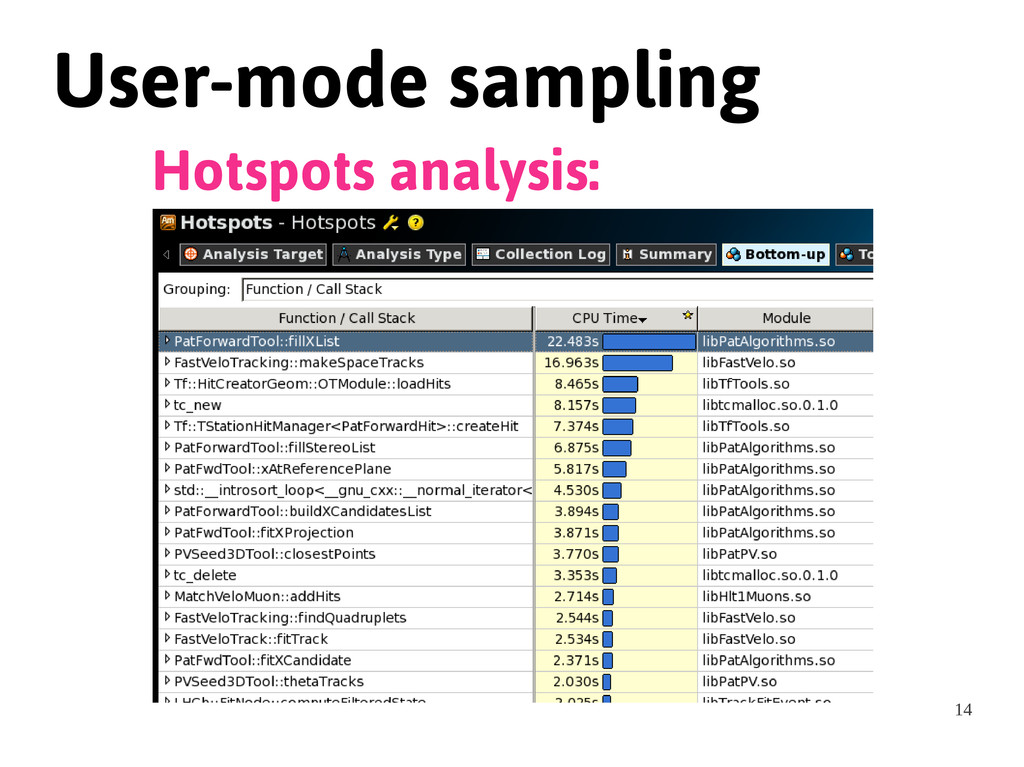
14 User-mode sampling Hotspots analysis:
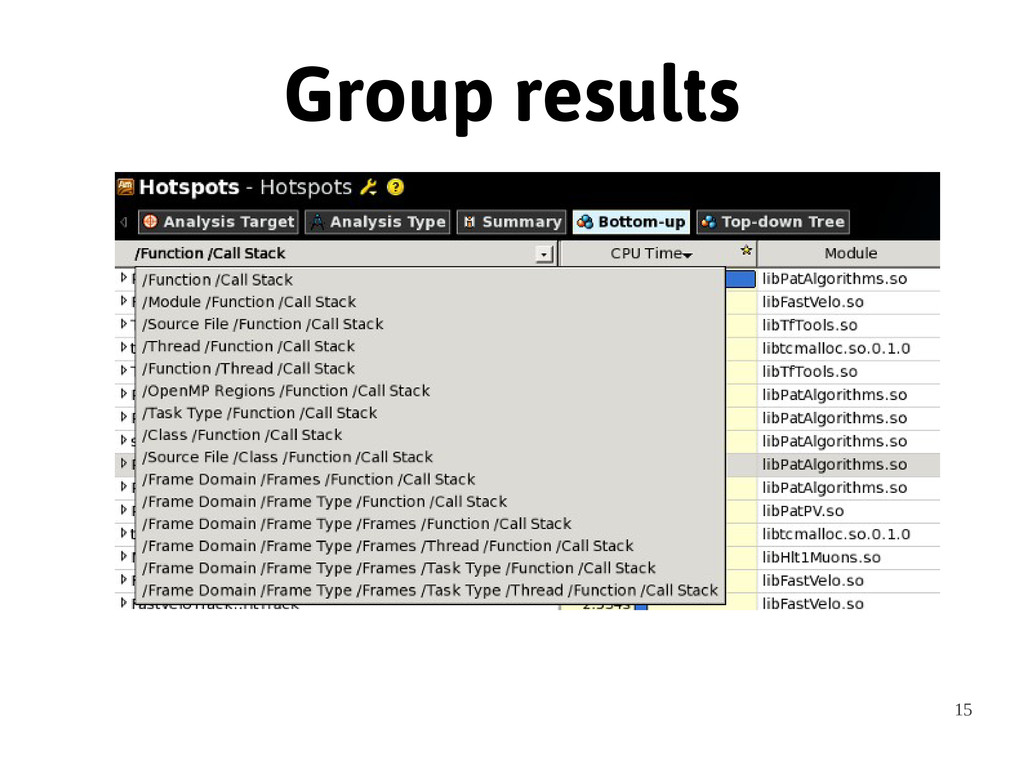
15 Group results
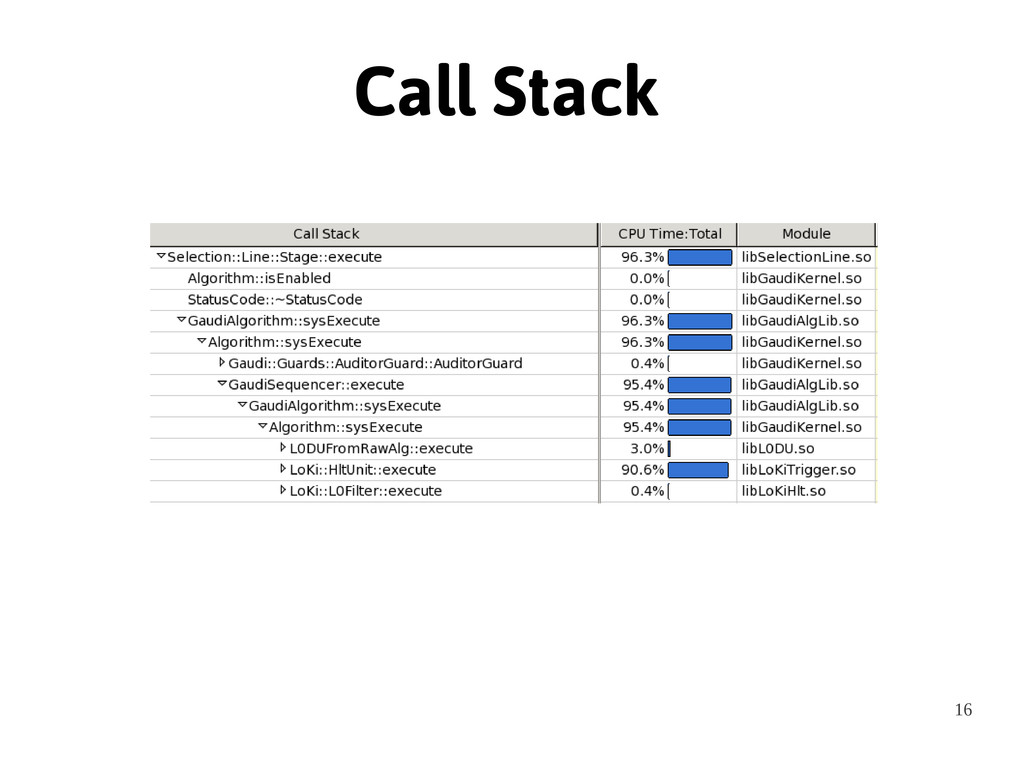
16 Call Stack
17 Filter by timeline
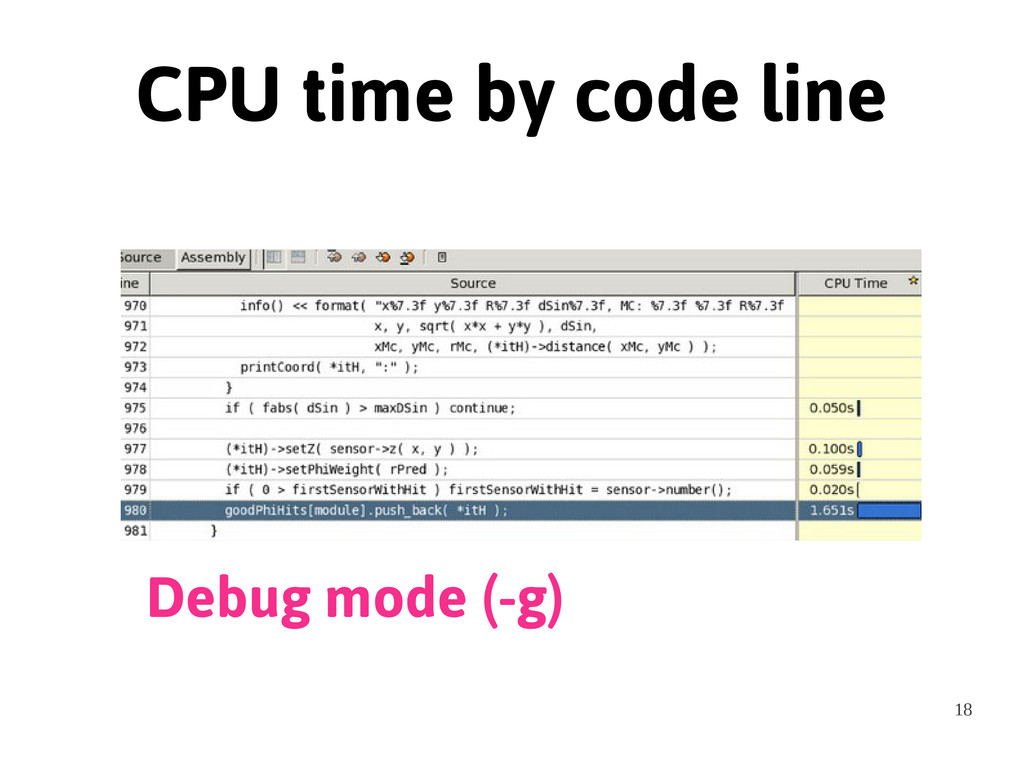
18 CPU time by code line Debug mode (-g)
19 User-mode sampling is a statistical method and does not
provide a 100% accurate results. Accuracy depends on: - Duration of the collection - Speed of processor - Amount of software activity - Sampling interval * recommended value is 10 ms * profiling is only 5% slower Sampling Accuracy
20 Integrating VTune™ Amplifier to Event Processing Framework
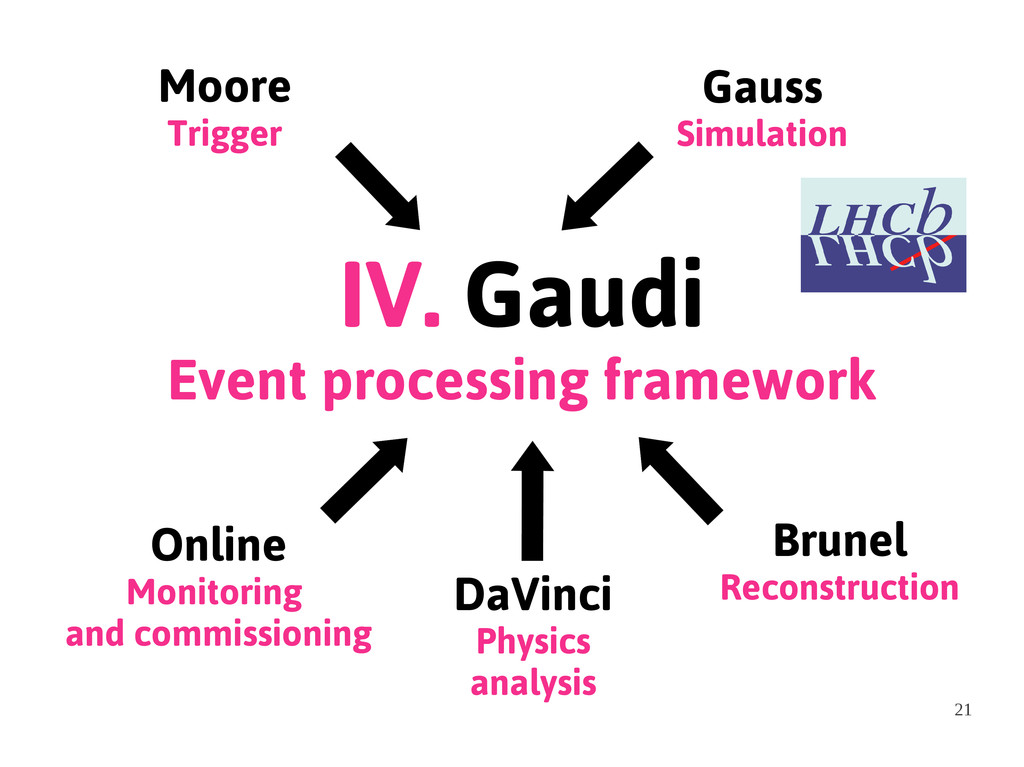
21 IV. Gaudi Event processing framework Moore Trigger Gauss Simulation
Brunel Reconstruction Online Monitoring and commissioning DaVinci Physics analysis
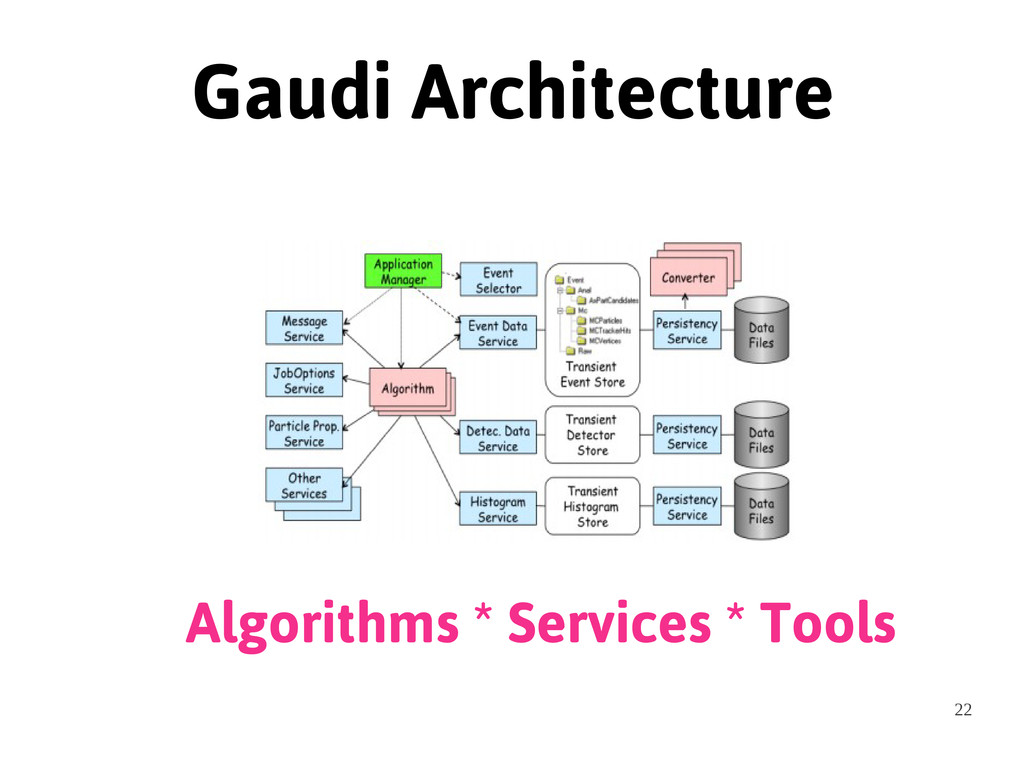
22 Gaudi Architecture Algorithms * Services * Tools
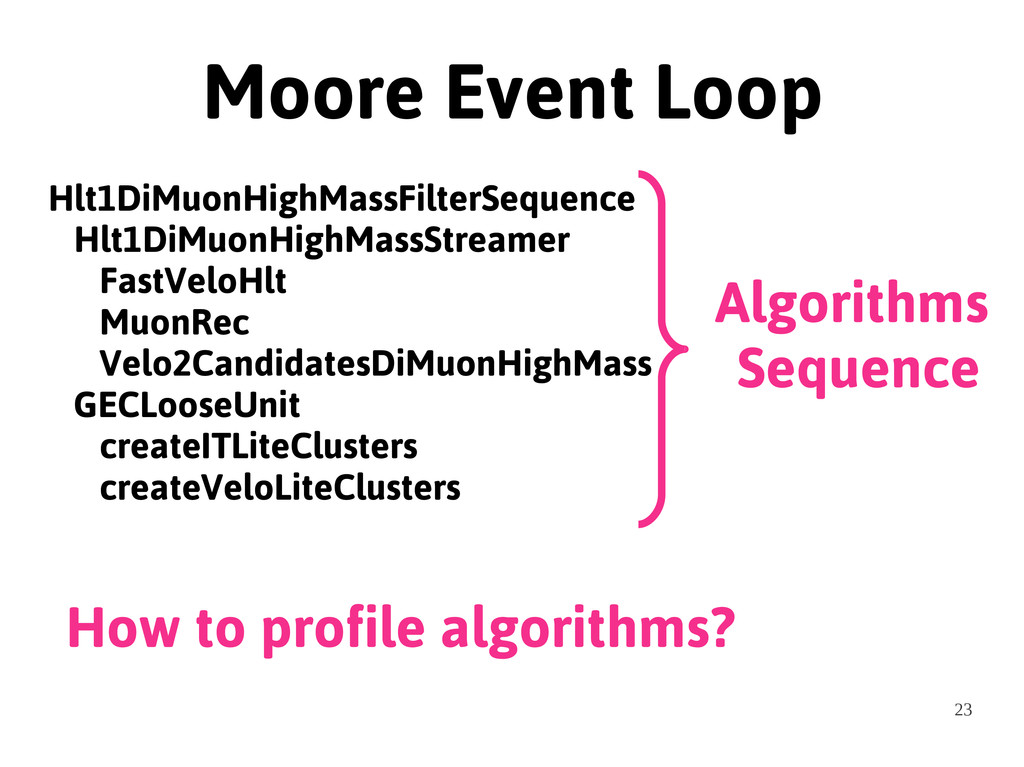
23 Moore Event Loop Hlt1DiMuonHighMassFilterSequence Hlt1DiMuonHighMassStreamer FastVeloHlt MuonRec Velo2CandidatesDiMuonHighMass GECLooseUnit
createITLiteClusters createVeloLiteClusters Algorithms Sequence How to profile algorithms?
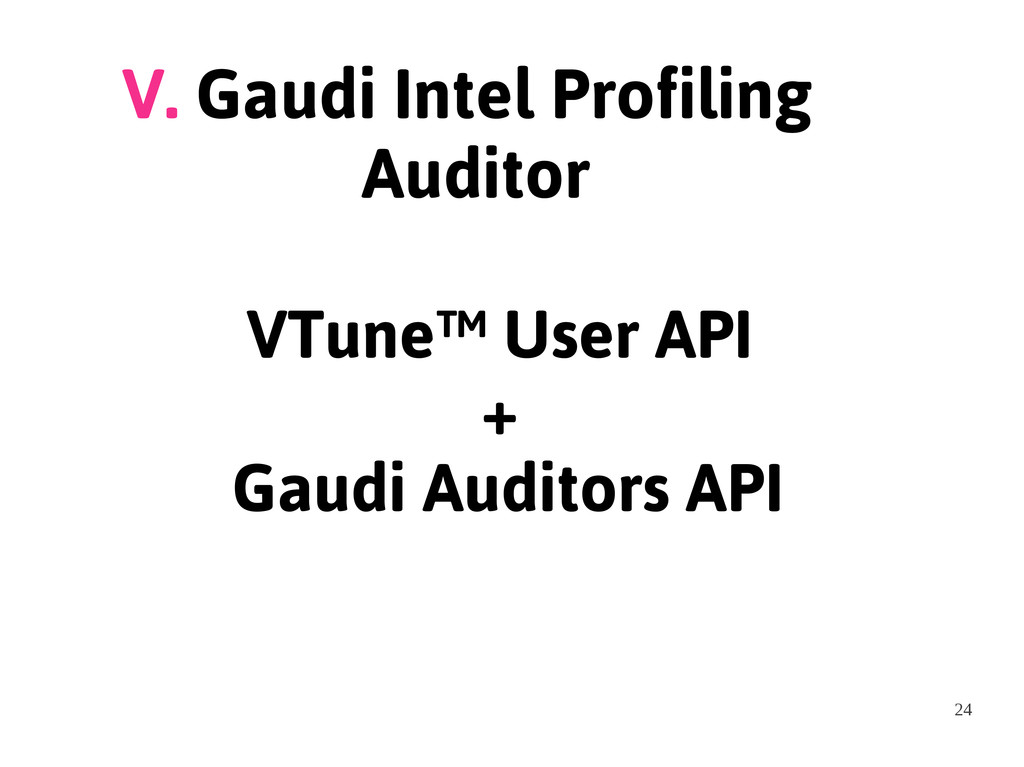
24 V. Gaudi Intel Profiling Auditor VTune™ User API +
Gaudi Auditors API
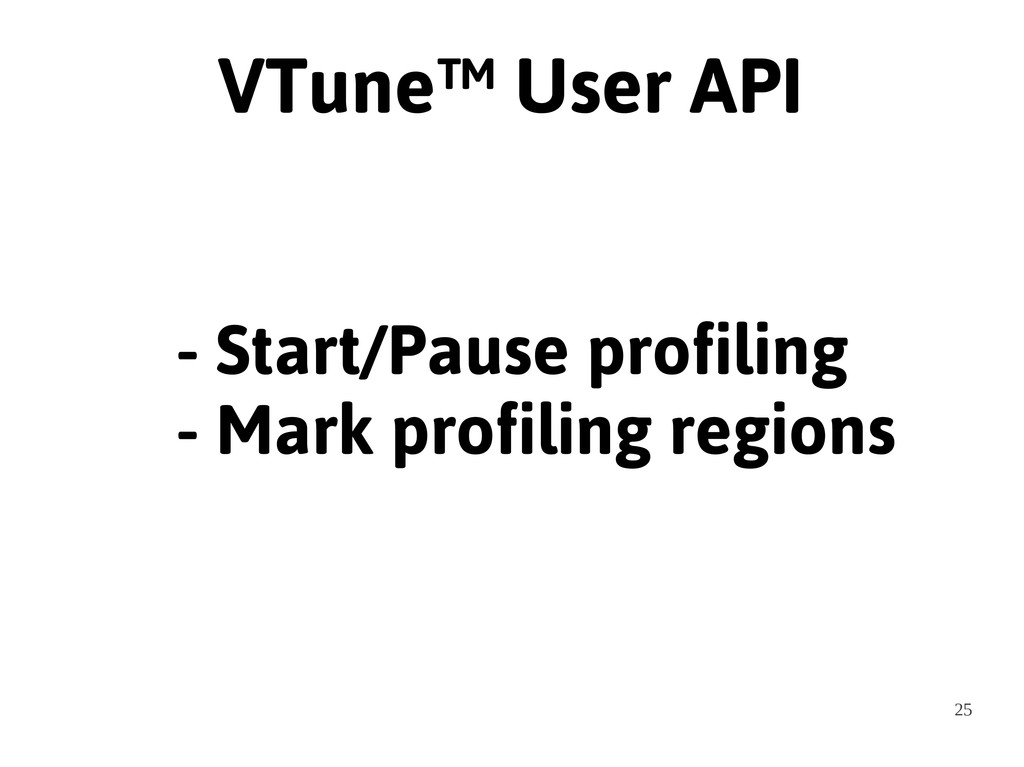
25 VTune™ User API - Start/Pause profiling - Mark profiling
regions
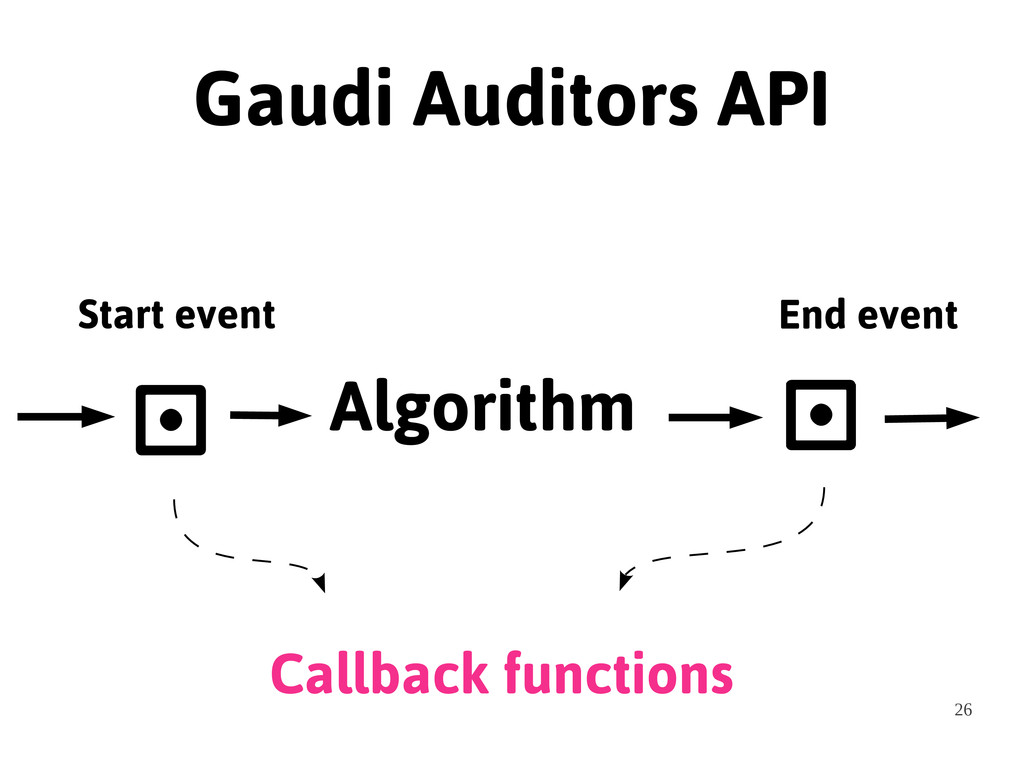
26 Gaudi Auditors API Algorithm Start event End
event Callback functions
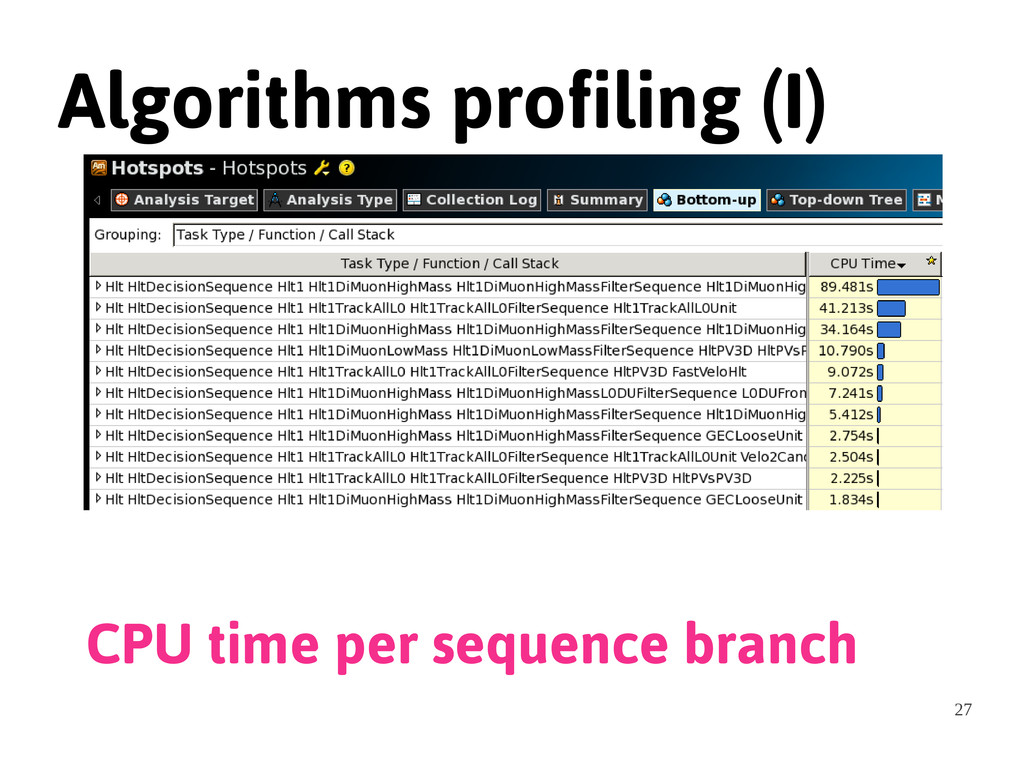
27 Algorithms profiling (I) CPU time per sequence branch
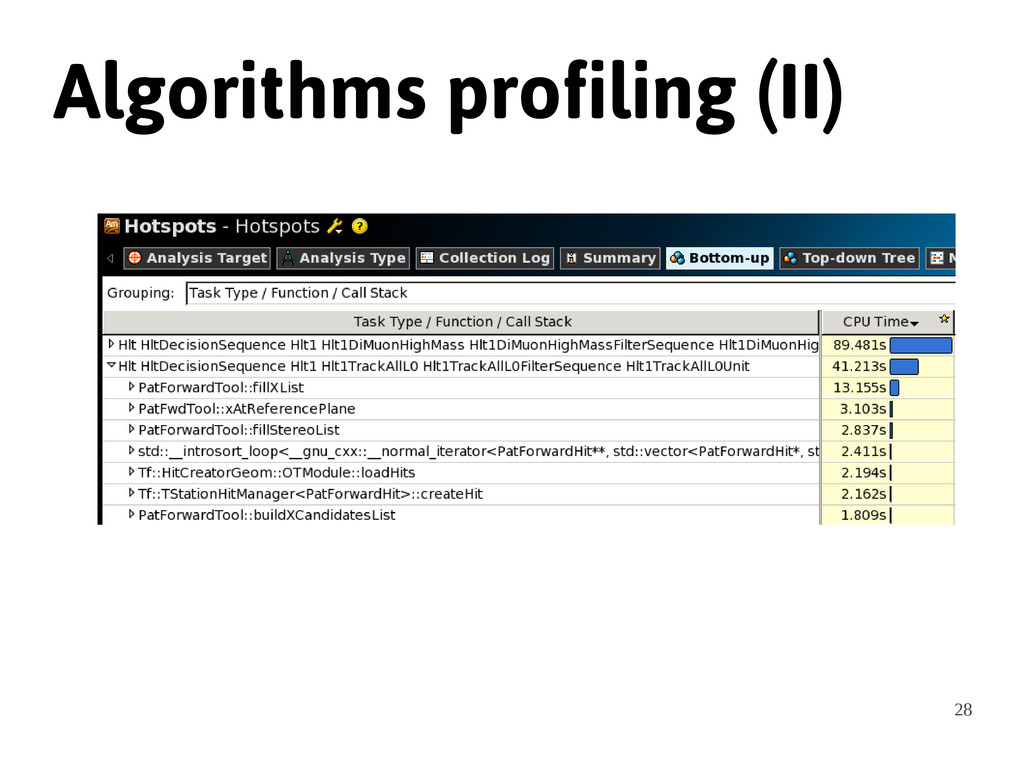
28 Algorithms profiling (II)
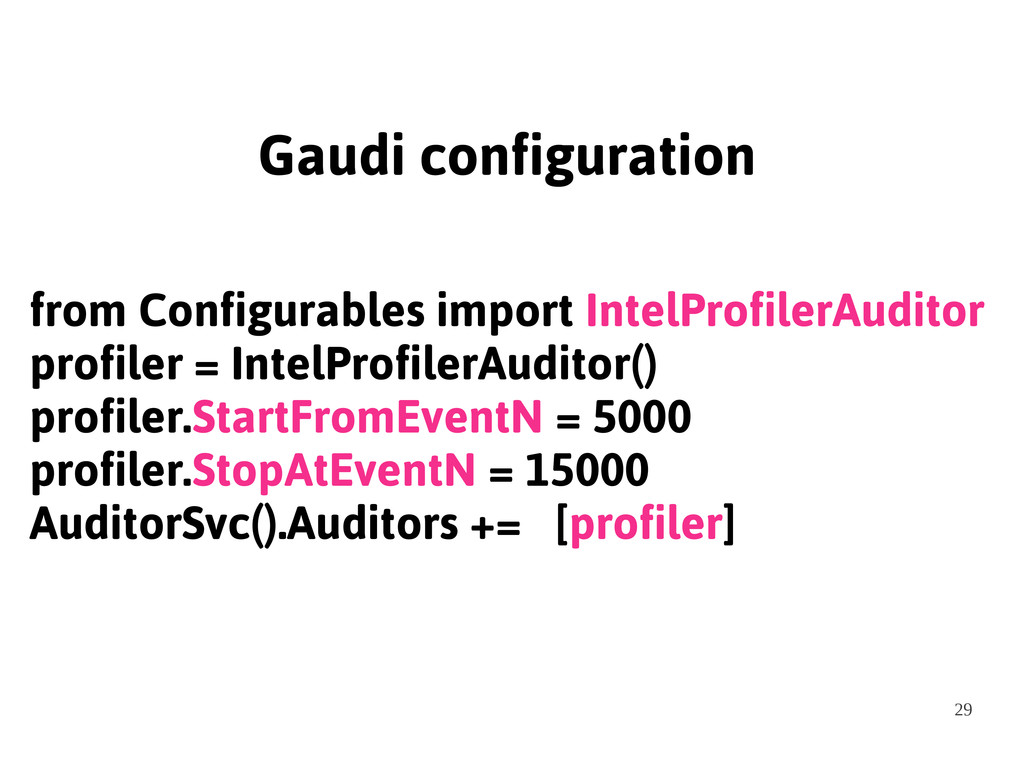
29 Gaudi configuration from Configurables import IntelProfilerAuditor profiler = IntelProfilerAuditor()
profiler.StartFromEventN = 5000 profiler.StopAtEventN = 15000 AuditorSvc().Auditors += [profiler]
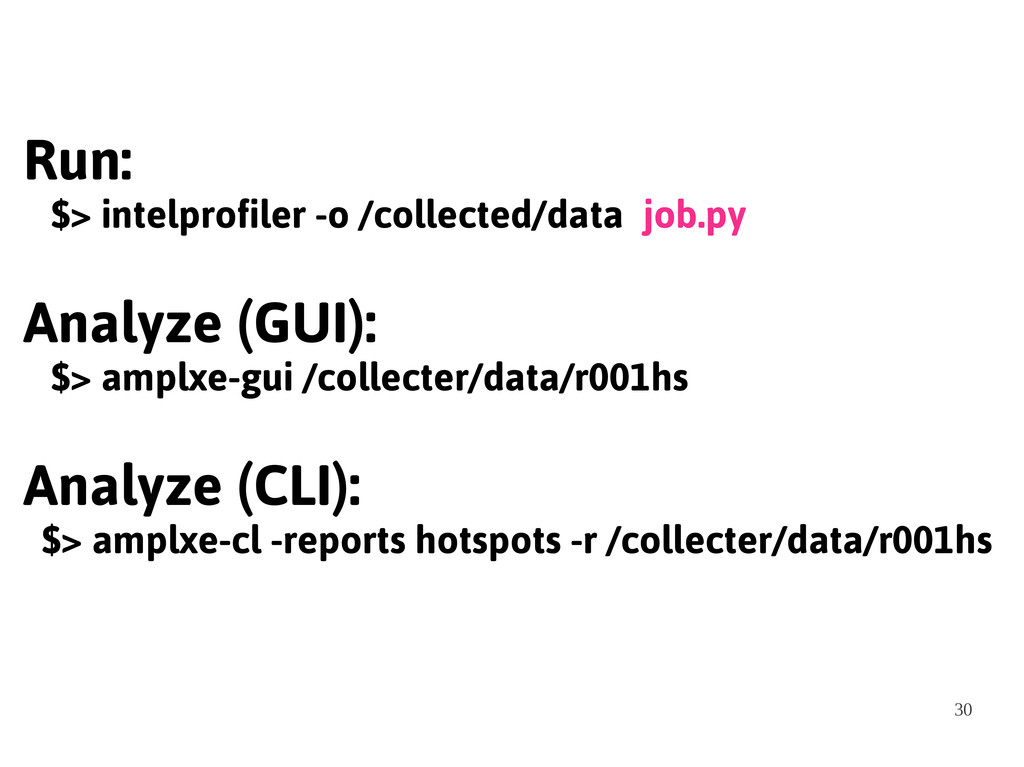
30 Run: $> intelprofiler -o /collected/data job.py Analyze (GUI): $>
amplxe-gui /collecter/data/r001hs Analyze (CLI): $> amplxe-cl -reports hotspots -r /collecter/data/r001hs
31 VI. Profiling examples 1. Memory allocation functions 2. Measuring
profiling accuracy 3. Custom reports
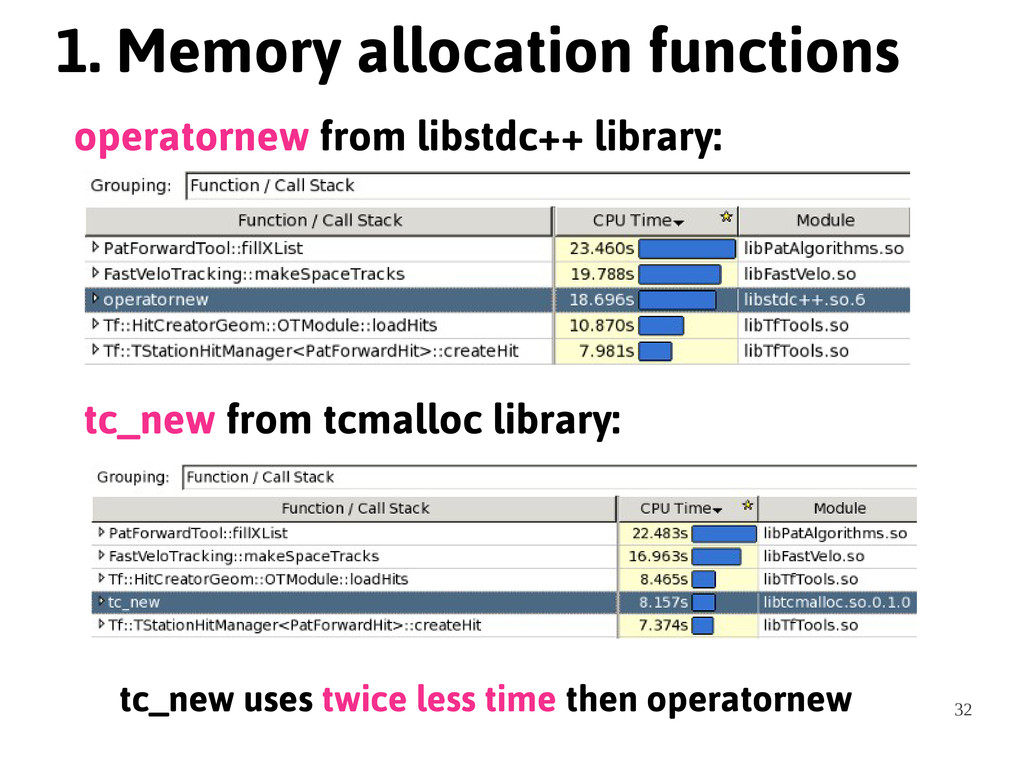
32 1. Memory allocation functions operatornew from libstdc++ library: tc_new
from tcmalloc library: tc_new uses twice less time then operatornew
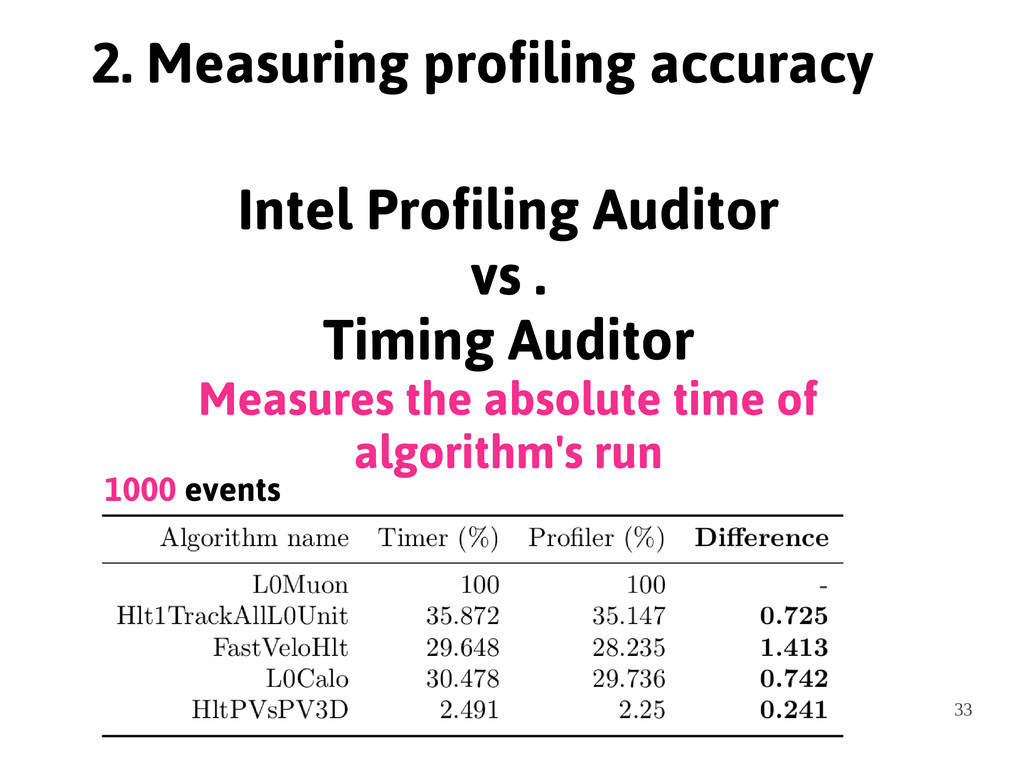
33 2. Measuring profiling accuracy Intel Profiling Auditor vs .
Timing Auditor Measures the absolute time of algorithm's run 1000 events
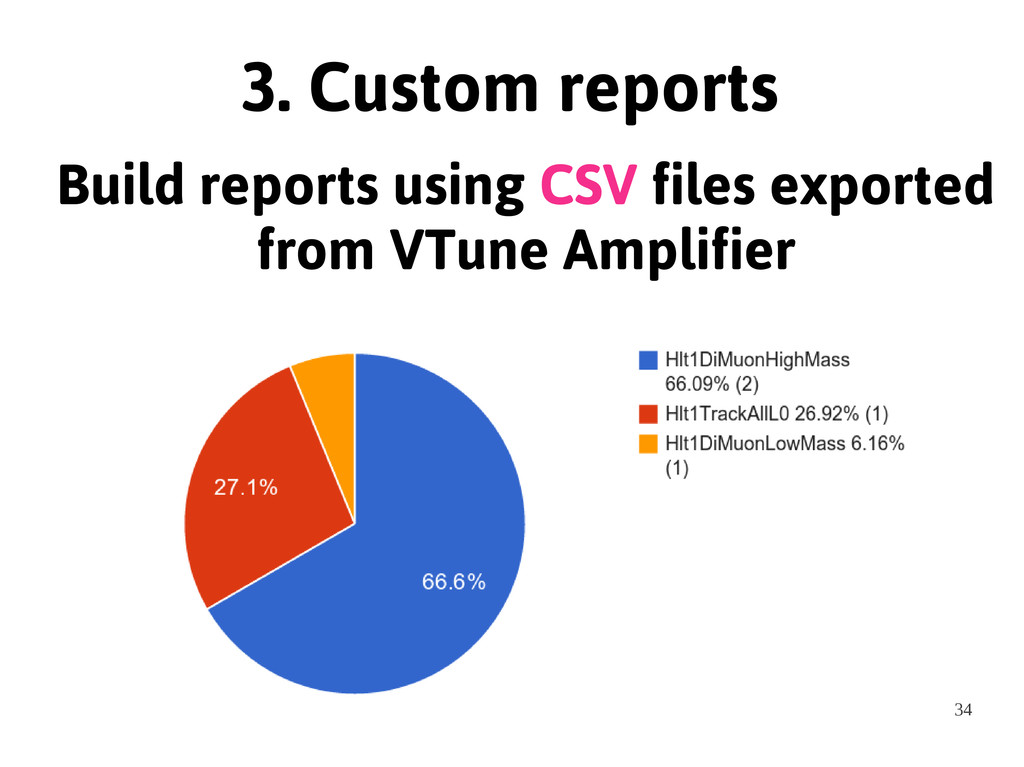
34 3. Custom reports Build reports using CSV files exported
from VTune Amplifier
35 Conclusions Intel® VTune™ Amplifier XE: + Various analysis types
and reports + Rich User API + Reasonable overhead time