Leads the public opinion research and content creation for HCM Strategists’ K-12 portfolio. Her research for Learning Heroes and others focuses on perceptions related to expectations for schools, accountability, assessments and student achievement. Erica has been involved in multiple national surveys aimed at better understanding how to communicate education policies effectively to parents and the public. Cindi Williams, Co-Founder of Learning Heroes As a senior official at the U.S. Department of Education, the White House and the Bill & Melinda Gates Foundation, she has seen how communications, advocacy and policy can work together to improve student outcomes. Cindi currently leads the K-12 education practice for Learning Heroes. She and her team have the privilege of partnering with innovative clients who share the team’s mission of helping those students who have historically been underserved by the public education system. 3
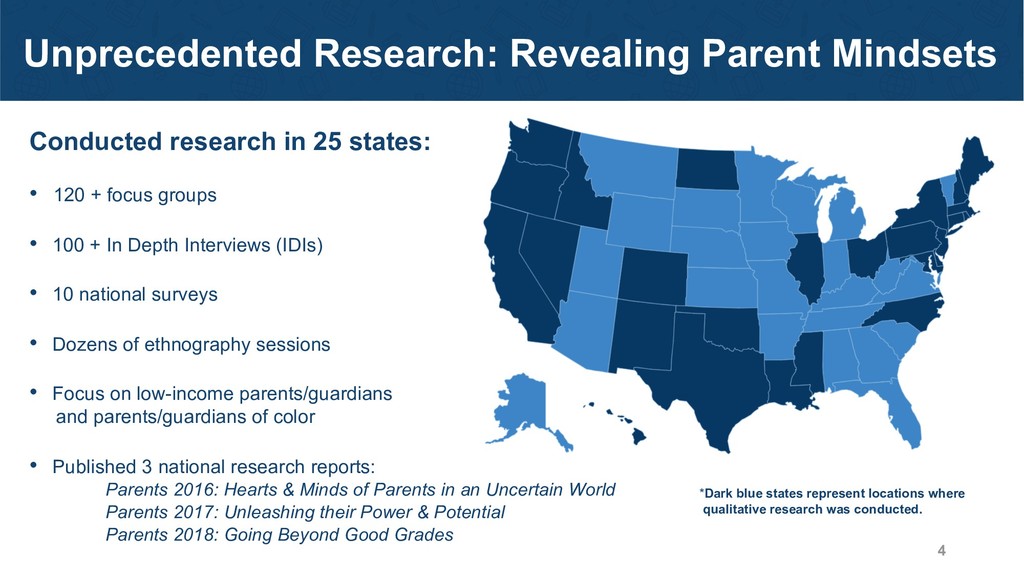
• 120 + focus groups • 100 + In Depth Interviews (IDIs) • 10 national surveys • Dozens of ethnography sessions • Focus on low-income parents/guardians and parents/guardians of color • Published 3 national research reports: Parents 2016: Hearts & Minds of Parents in an Uncertain World Parents 2017: Unleashing their Power & Potential Parents 2018: Going Beyond Good Grades *Dark blue states represent locations where qualitative research was conducted. 4
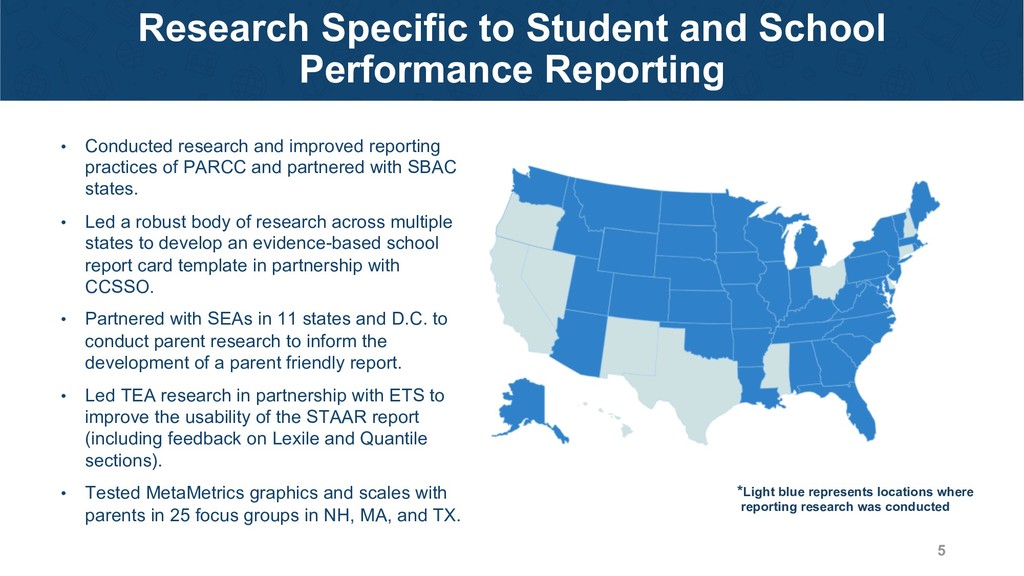
research and improved reporting practices of PARCC and partnered with SBAC states. • Led a robust body of research across multiple states to develop an evidence-based school report card template in partnership with CCSSO. • Partnered with SEAs in 11 states and D.C. to conduct parent research to inform the development of a parent friendly report. • Led TEA research in partnership with ETS to improve the usability of the STAAR report (including feedback on Lexile and Quantile sections). • Tested MetaMetrics graphics and scales with parents in 25 focus groups in NH, MA, and TX. *Light blue represents locations where reporting research was conducted 5
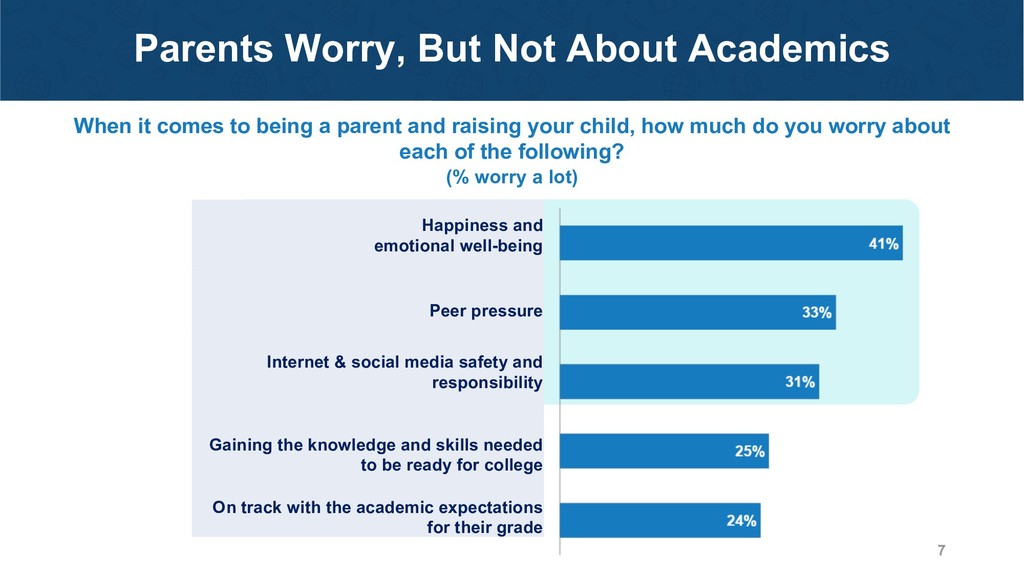
Peer pressure Internet & social media safety and responsibility Gaining the knowledge and skills needed to be ready for college On track with the academic expectations for their grade When it comes to being a parent and raising your child, how much do you worry about each of the following? (% worry a lot) 7
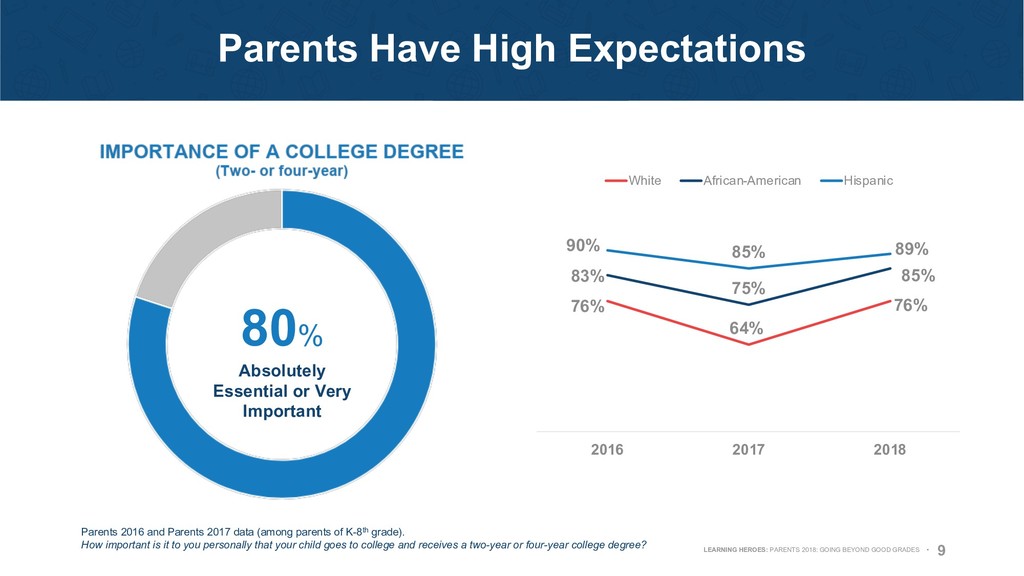
(among parents of K-8th grade). How important is it to you personally that your child goes to college and receives a two-year or four-year college degree? 80% Absolutely Essential or Very Important 9 76% 64% 76% 83% 75% 85% 90% 85% 89% 2016 2017 2018 White African-American Hispanic LEARNING HEROES: PARENTS 2018: GOING BEYOND GOOD GRADES •
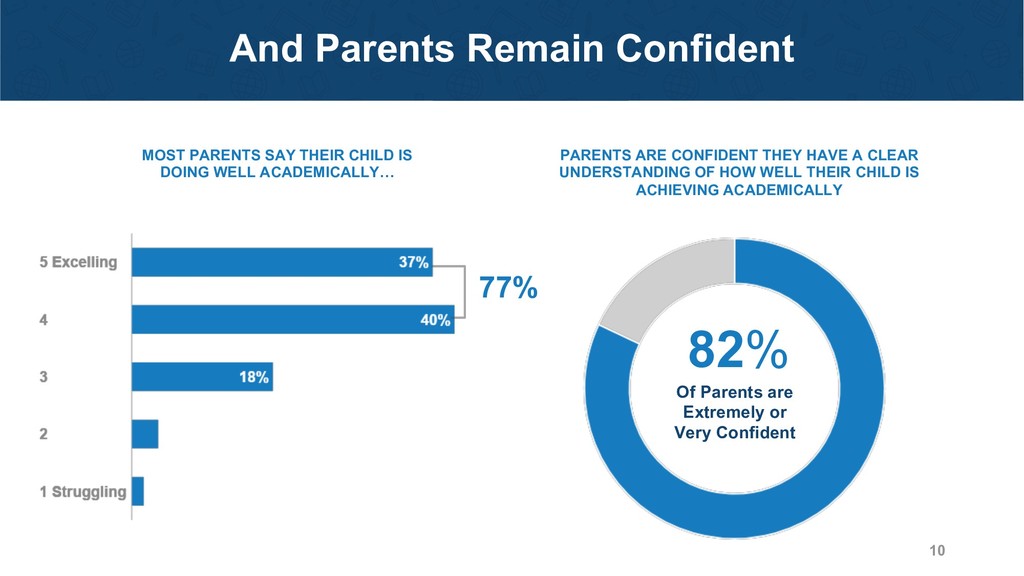
DOING WELL ACADEMICALLY… PARENTS ARE CONFIDENT THEY HAVE A CLEAR UNDERSTANDING OF HOW WELL THEIR CHILD IS ACHIEVING ACADEMICALLY 82% Of Parents are Extremely or Very Confident 77% 10
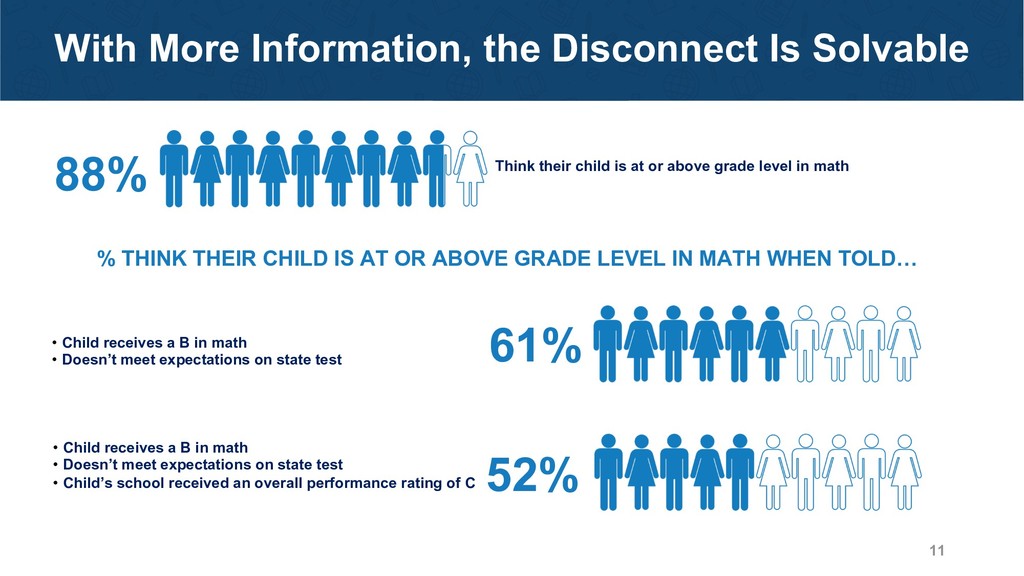
THEIR CHILD IS AT OR ABOVE GRADE LEVEL IN MATH WHEN TOLD… • Child receives a B in math • Doesn’t meet expectations on state test 61% • Child receives a B in math • Doesn’t meet expectations on state test • Child’s school received an overall performance rating of C 52% 88% Think their child is at or above grade level in math
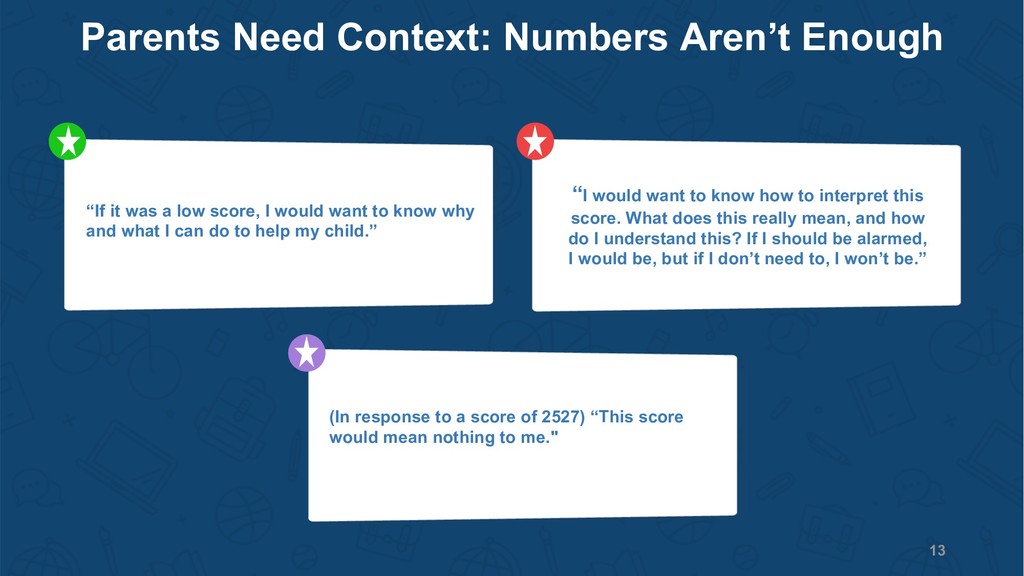
low score, I would want to know why and what I can do to help my child.” “I would want to know how to interpret this score. What does this really mean, and how do I understand this? If I should be alarmed, I would be, but if I don’t need to, I won’t be.” (In response to a score of 2527) “This score would mean nothing to me." 13
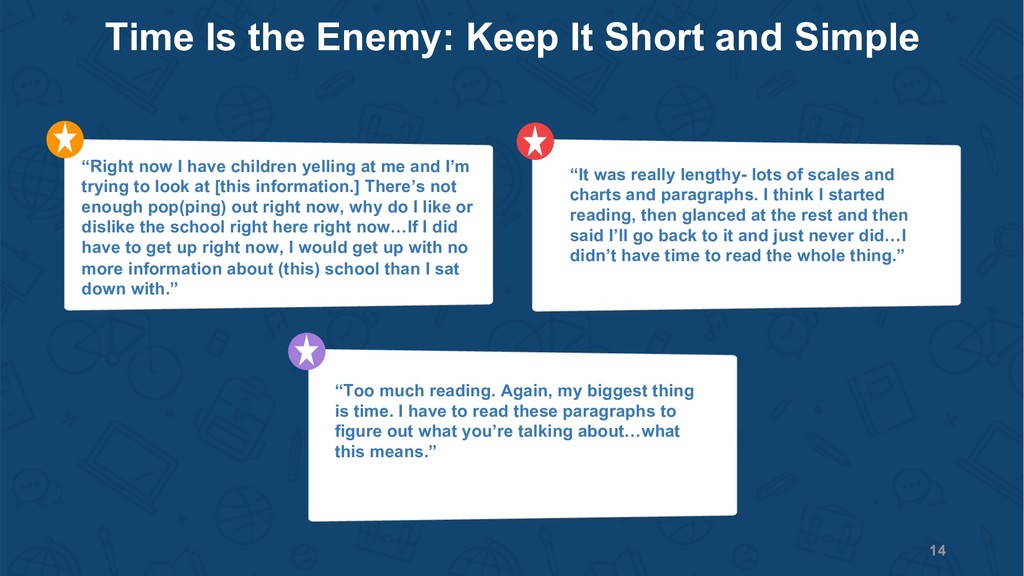
now I have children yelling at me and I’m trying to look at [this information.] There’s not enough pop(ping) out right now, why do I like or dislike the school right here right now…If I did have to get up right now, I would get up with no more information about (this) school than I sat down with.” “It was really lengthy- lots of scales and charts and paragraphs. I think I started reading, then glanced at the rest and then said I’ll go back to it and just never did…I didn’t have time to read the whole thing.” “Too much reading. Again, my biggest thing is time. I have to read these paragraphs to figure out what you’re talking about…what this means.” 14
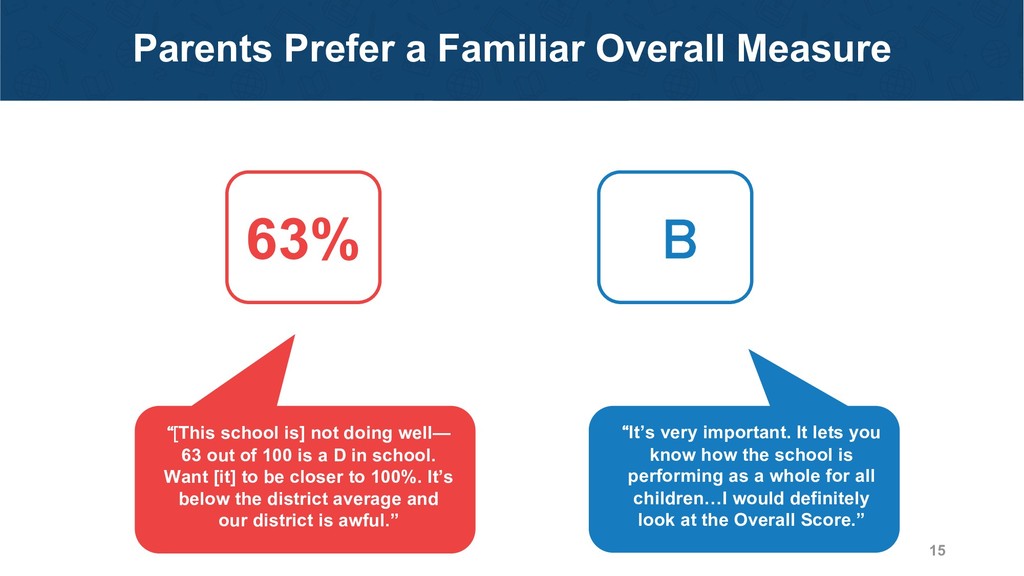
school is] not doing well— 63 out of 100 is a D in school. Want [it] to be closer to 100%. It’s below the district average and our district is awful.” “It’s very important. It lets you know how the school is performing as a whole for all children…I would definitely look at the Overall Score.”
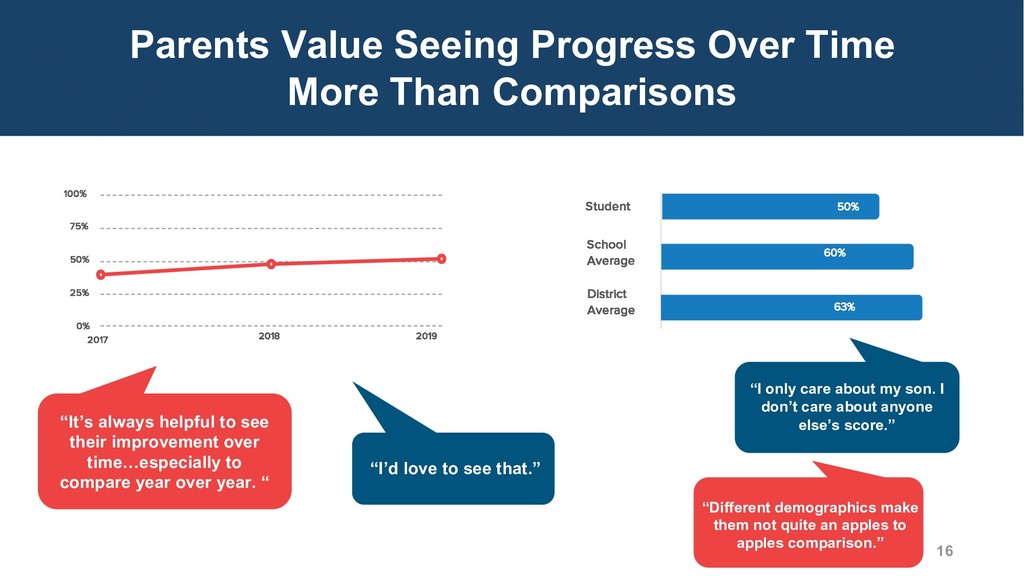
compare year over year. “ “I only care about my son. I don’t care about anyone else’s score.” Student District Average 62% 50% Parents Value Seeing Progress Over Time More Than Comparisons 25% 50% 100% 75% 0% 2017 2018 2019 16 School Average 60% 63% “I’d love to see that.” “Different demographics make them not quite an apples to apples comparison.”
they trying to tell us here? Is it…error in the scoring?.” Margin of Error “Proficient is just enough to get by…not excel.” Proficiency Lexile 17 “Who has any idea what 200 lexis are?”
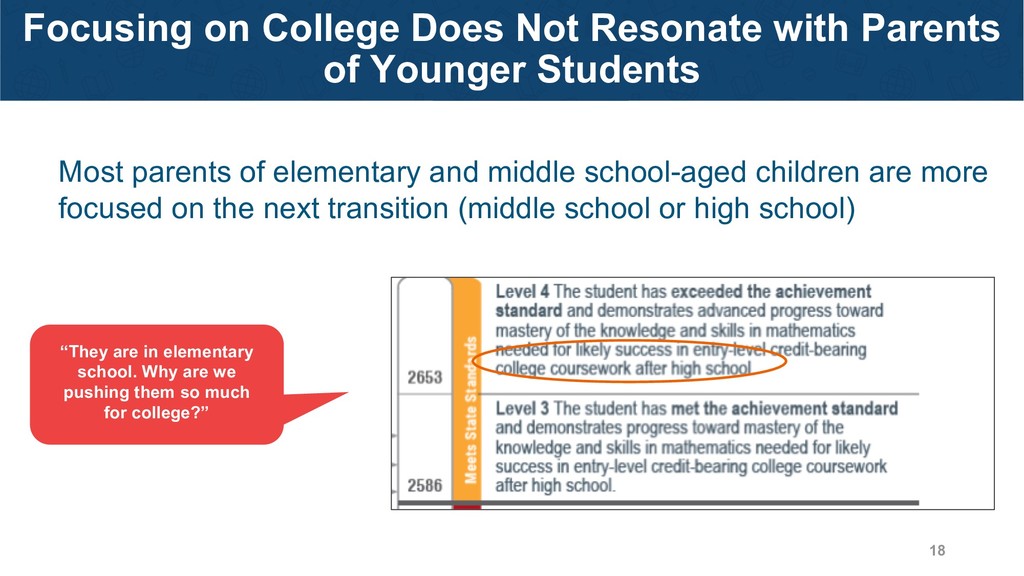
Students 18 “They are in elementary school. Why are we pushing them so much for college?” Most parents of elementary and middle school-aged children are more focused on the next transition (middle school or high school)
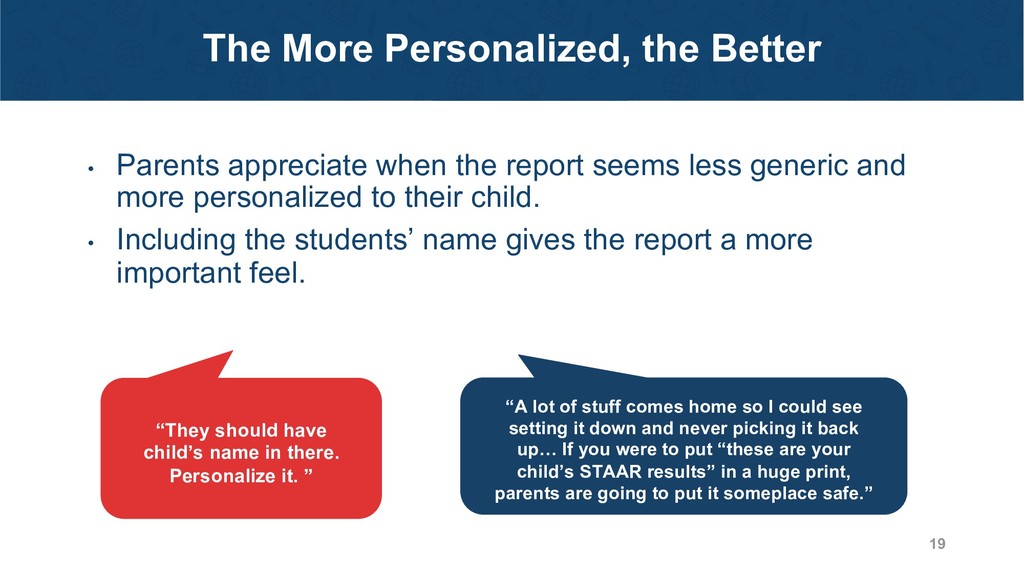
report seems less generic and more personalized to their child. • Including the students’ name gives the report a more important feel. 19 “A lot of stuff comes home so I could see setting it down and never picking it back up… If you were to put “these are your child’s STAAR results” in a huge print, parents are going to put it someplace safe.” “They should have child’s name in there. Personalize it. ”
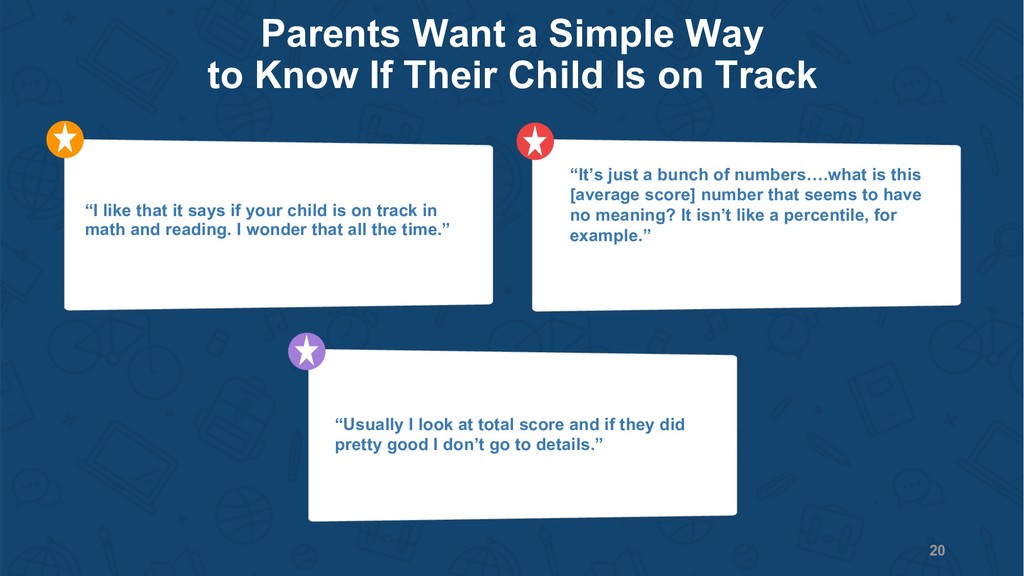
Is on Track “I like that it says if your child is on track in math and reading. I wonder that all the time.” “It’s just a bunch of numbers….what is this [average score] number that seems to have no meaning? It isn’t like a percentile, for example.” “Usually I look at total score and if they did pretty good I don’t go to details.” 20
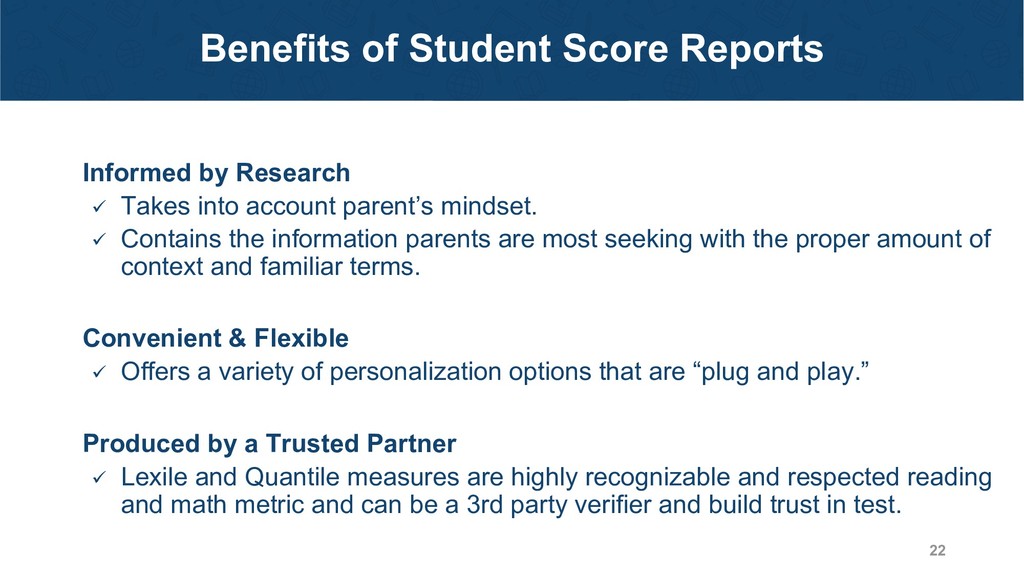
into account parent’s mindset. ü Contains the information parents are most seeking with the proper amount of context and familiar terms. Convenient & Flexible ü Offers a variety of personalization options that are “plug and play.” Produced by a Trusted Partner ü Lexile and Quantile measures are highly recognizable and respected reading and math metric and can be a 3rd party verifier and build trust in test. 22
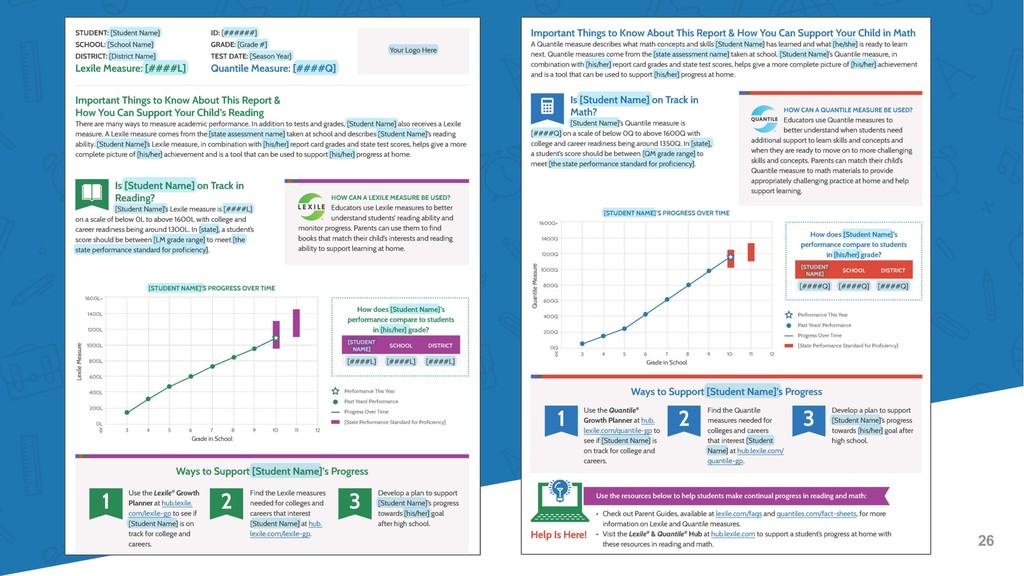
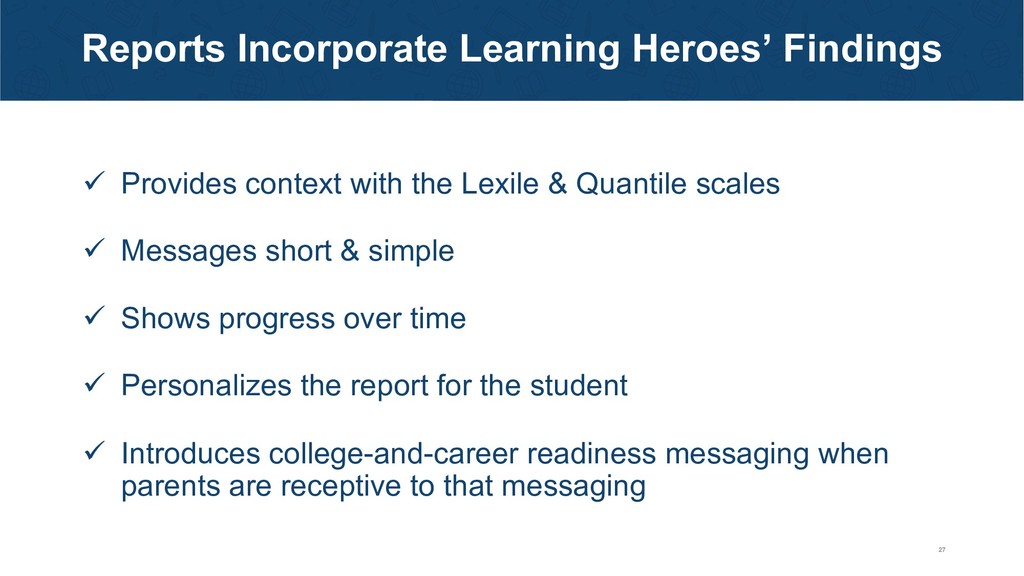
Lexile & Quantile scales ü Messages short & simple ü Shows progress over time ü Personalizes the report for the student ü Introduces college-and-career readiness messaging when parents are receptive to that messaging 27
HEROES [email protected] bealearninghero.org Questions on the Lexile & Quantile Score Reports? Want to connect to SEAs that have implemented similar reports? Lizzy Lattanzio METAMETRICS [email protected] MetaMetricsInc.com