Upgrade to Pro — share decks privately, control downloads, hide ads and more …

The art and science of teaching data science

The art and science of teaching data science

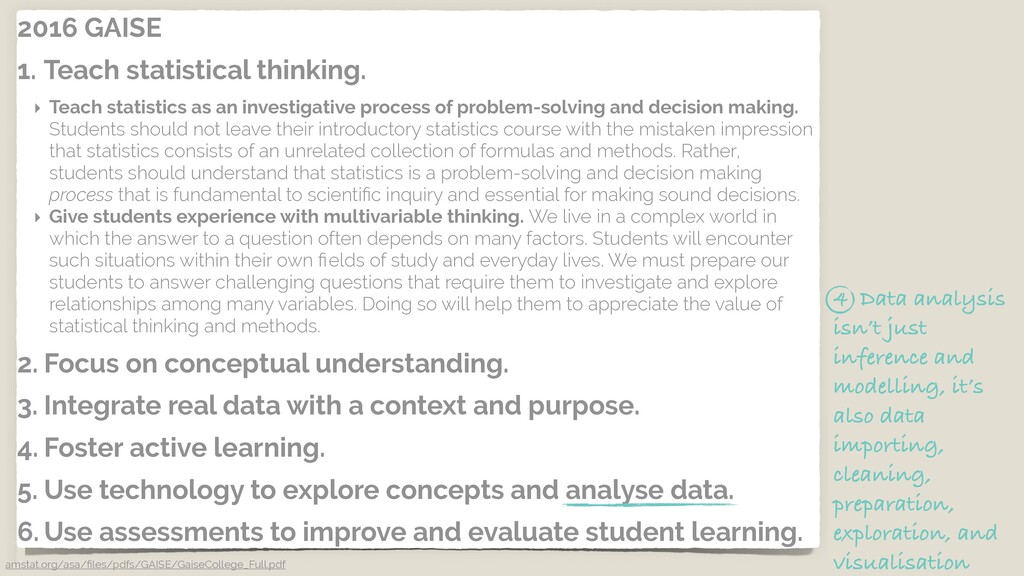
Modern statistics is fundamentally a computational discipline, but too often this fact is not reflected in our statistics curricula. With the rise of data science it has become increasingly clear that students want, expect, and need explicit training in this area of the discipline. Additionally, recent curricular guidelines clearly state that working with data requires extensive computing skills and that statistics students should be fluent in accessing, manipulating, analyzing, and modeling with professional statistical analysis software. In this talk, we introduce the design philosophy behind an introductory data science course, discuss in progress and future research on student learning as well as new directions in assessment and tooling as we scale up the course.

Mine Cetinkaya-Rundel

October 19, 2020
Tweet

More Decks by Mine Cetinkaya-Rundel

Other Decks in Education

Transcript

  1. Image credit: Thomas Pedersen, data-imaginist.com/art the art and science of

    teaching data science mine çetinkaya-rundel bit.ly/ds-art-sci-numbat mine-cetinkaya-rundel [email protected] @minebocek
  2. 2016 GAISE 1. Teach statistical thinking. ‣ Teach statistics as

    an investigative process of problem-solving and decision making. Students should not leave their introductory statistics course with the mistaken impression that statistics consists of an unrelated collection of formulas and methods. Rather, students should understand that statistics is a problem-solving and decision making process that is fundamental to scientific inquiry and essential for making sound decisions. ‣ Give students experience with multivariable thinking. We live in a complex world in which the answer to a question often depends on many factors. Students will encounter such situations within their own fields of study and everyday lives. We must prepare our students to answer challenging questions that require them to investigate and explore relationships among many variables. Doing so will help them to appreciate the value of statistical thinking and methods. 2. Focus on conceptual understanding. 3. Integrate real data with a context and purpose. 4. Foster active learning. 5. Use technology to explore concepts and analyse data. 6. Use assessments to improve and evaluate student learning. amstat.org/asa/files/pdfs/GAISE/GaiseCollege_Full.pdf
  3. 2016 GAISE 1. Teach statistical thinking. ‣ Teach statistics as

    an investigative process of problem-solving and decision making. Students should not leave their introductory statistics course with the mistaken impression that statistics consists of an unrelated collection of formulas and methods. Rather, students should understand that statistics is a problem-solving and decision making process that is fundamental to scientific inquiry and essential for making sound decisions. ‣ Give students experience with multivariable thinking. We live in a complex world in which the answer to a question often depends on many factors. Students will encounter such situations within their own fields of study and everyday lives. We must prepare our students to answer challenging questions that require them to investigate and explore relationships among many variables. Doing so will help them to appreciate the value of statistical thinking and methods. 2. Focus on conceptual understanding. 3. Integrate real data with a context and purpose. 4. Foster active learning. 5. Use technology to explore concepts and analyse data. 6. Use assessments to improve and evaluate student learning. amstat.org/asa/files/pdfs/GAISE/GaiseCollege_Full.pdf 1 NOT a commonly used subset of tests and intervals and produce them with hand calculations
  4. 2016 GAISE 1. Teach statistical thinking. ‣ Teach statistics as

    an investigative process of problem-solving and decision making. Students should not leave their introductory statistics course with the mistaken impression that statistics consists of an unrelated collection of formulas and methods. Rather, students should understand that statistics is a problem-solving and decision making process that is fundamental to scientific inquiry and essential for making sound decisions. ‣ Give students experience with multivariable thinking. We live in a complex world in which the answer to a question often depends on many factors. Students will encounter such situations within their own fields of study and everyday lives. We must prepare our students to answer challenging questions that require them to investigate and explore relationships among many variables. Doing so will help them to appreciate the value of statistical thinking and methods. 2. Focus on conceptual understanding. 3. Integrate real data with a context and purpose. 4. Foster active learning. 5. Use technology to explore concepts and analyse data. 6. Use assessments to improve and evaluate student learning. amstat.org/asa/files/pdfs/GAISE/GaiseCollege_Full.pdf 2 Multivariate analysis requires the use of computing
  5. 2016 GAISE 1. Teach statistical thinking. ‣ Teach statistics as

    an investigative process of problem-solving and decision making. Students should not leave their introductory statistics course with the mistaken impression that statistics consists of an unrelated collection of formulas and methods. Rather, students should understand that statistics is a problem-solving and decision making process that is fundamental to scientific inquiry and essential for making sound decisions. ‣ Give students experience with multivariable thinking. We live in a complex world in which the answer to a question often depends on many factors. Students will encounter such situations within their own fields of study and everyday lives. We must prepare our students to answer challenging questions that require them to investigate and explore relationships among many variables. Doing so will help them to appreciate the value of statistical thinking and methods. 2. Focus on conceptual understanding. 3. Integrate real data with a context and purpose. 4. Foster active learning. 5. Use technology to explore concepts and analyse data. 6. Use assessments to improve and evaluate student learning. amstat.org/asa/files/pdfs/GAISE/GaiseCollege_Full.pdf 3 NOT use technology that is only applicable in the intro course or that doesn’t follow good science principles
  6. 2016 GAISE 1. Teach statistical thinking. ‣ Teach statistics as

    an investigative process of problem-solving and decision making. Students should not leave their introductory statistics course with the mistaken impression that statistics consists of an unrelated collection of formulas and methods. Rather, students should understand that statistics is a problem-solving and decision making process that is fundamental to scientific inquiry and essential for making sound decisions. ‣ Give students experience with multivariable thinking. We live in a complex world in which the answer to a question often depends on many factors. Students will encounter such situations within their own fields of study and everyday lives. We must prepare our students to answer challenging questions that require them to investigate and explore relationships among many variables. Doing so will help them to appreciate the value of statistical thinking and methods. 2. Focus on conceptual understanding. 3. Integrate real data with a context and purpose. 4. Foster active learning. 5. Use technology to explore concepts and analyse data. 6. Use assessments to improve and evaluate student learning. amstat.org/asa/files/pdfs/GAISE/GaiseCollege_Full.pdf 4 Data analysis isn’t just inference and modelling, it’s also data importing, cleaning, preparation, exploration, and visualisation
  7. a course that satisfies these four points is looking more

    like today’s intro data science courses than (most) intro stats courses but this is not because intro stats is inherently “bad for you” instead it is because it’s time to visit intro stats in light of emergence of data science
  8. fundamentals of data & data viz, confounding variables, Simpson’s paradox

    + R / RStudio, R Markdown, simple Git tidy data, data frames vs. summary tables, recoding & transforming, web scraping & iteration + collaboration on GitHub
  9. fundamentals of data & data viz, confounding variables, Simpson’s paradox

    + R / RStudio, R Markdown, simple Git tidy data, data frames vs. summary tables, recoding & transforming, web scraping & iteration + collaboration on GitHub building & selecting models, visualising interactions, prediction & validation, inference via simulation
  10. fundamentals of data & data viz, confounding variables, Simpson’s paradox

    + R / RStudio, R Markdown, simple Git tidy data, data frames vs. summary tables, recoding & transforming, web scraping & iteration + collaboration on GitHub building & selecting models, visualising interactions, prediction & validation, inference via simulation data science ethics, text analysis, Bayesian inference + communication & dissemination
  11. fundamentals of data & data viz, confounding variables, Simpson’s paradox

    + R / RStudio, R Markdown, simple Git tidy data, data frames vs. summary tables, recoding & transforming, web scraping & iteration + collaboration on GitHub building & selecting models, visualising interactions, prediction & validation, inference via simulation data science ethics, text analysis, Bayesian inference + communication & dissemination
  12. ‣ Go to bit.ly/rscloud-ecots2020 ‣ Start the project titled UN

    Votes ‣ Open the R Markdown document called unvotes.Rmd
  13. ‣ Go to bit.ly/rscloud-ecots2020 ‣ Start the project titled UN

    Votes ‣ Open the R Markdown document called unvotes.Rmd ‣ Knit the document and review the data visualisation you just produced
  14. ‣ Go to bit.ly/rscloud-ecots2020 ‣ Start the project titled UN

    Votes ‣ Open the R Markdown document called unvotes.Rmd ‣ Knit the document and review the data visualisation you just produced ‣ Then, look for the character string “Turkey” in the code and replace it with another country of your choice ‣ Knit again, and review how the voting patterns of the country you picked compares to the United States and United Kingdom & Northern Ireland
  15. three questions that keep me up at night… 1 what

    should students learn? 2 how will students learn best? 3 what tools will enhance student learning?
  16. three questions that keep me up at night… 1 what

    should students learn? 2 how will students learn best? 3 what tools will enhance student learning? content pedagogy infrastructure
  17. ✴ web scraping ✴ text parsing ✴ data types ✴

    regular expressions ✴ iteration
  18. ✴ web scraping ✴ text parsing ✴ data types ✴

    regular expressions ✴ iteration ✴ data visualisation ✴ interpretation
  19. ✴ web scraping ✴ text parsing ✴ data types ✴

    regular expressions ✴ iteration ✴ data visualisation ✴ interpretation ✴ data science ethics
  20. Project: The North South Divide: University Edition Question: Does the

    geographical location of a UK university affect its university score? Team: Fried Egg Jelly Fish
  21. ‣ Sample assignment: rstudio-education.github.io/datascience-box/ course-materials/hw-instructions/hw-05/hw-05-money-in- politics.html ‣ Code: Go to

    bit.ly/rscloud-ecots2020, start the project titled 02 - Money in politics ‣ Paper: Dogucu, Mine, and Mine Çetinkaya-Rundel. "Web Scraping in the Statistics and Data Science Curriculum: Challenges and Opportunities." Journal of Statistics Education (2020): 1-11. doi.org/ 10.1080/10691898.2020.1787116 Resources
  22. ✴ data joins ✴ data science ethics ✴ critique ✴

    improving data visualisations ✴ mapping
  23. Project: 2016 US Election Redux Question: Would the outcome of

    the 2016 US Presidential Elections been different had Bernie Sanders been the Democrat candidate? Team: 4 Squared
  24. ‣ Sample lab: rstudio-education.github.io/datascience-box/course- materials/lab-instructions/lab-06/lab-06-ugly-charts.html ‣ Code: Go to bit.ly/rscloud-ecots2020,

    start the project titled 03 - Fisheries of the world ‣ Sample lecture: rstudio-education.github.io/datascience-box/course- materials/slides/u1_d10-effective-dataviz/u1_d10-effective-dataviz.html ‣ CHANCE column: From drab to fab (Mine Çetinkaya-Rundel & Maria Tackett) ‣ Talks: ‣ Take a Sad Plot and Make it Better (Alison Hill) ‣ Tidy up your data science workflow with the tidyverse (Mine Çetinkaya- Rundel) Resources
  25. ✴ logistic regression ✴ prediction ✴ decision errors ✴ sensitivity

    / specificity ✴ intuition around loss functions
  26. Project: Spotify Top 100 Tracks of 2017/18 Question: Is it

    possible to predict the year a song made the Top Tracks playlist based on its metadata? Team: weR20 year ~ danceability + energy + key + loudness + mode + speechiness + acousticness + instrumentalness + liveness + valence + tempo + duration_s 2017 name artists I'm the One DJ Khaled Redbone Childish Gambino Sign of the Times Harry Styles 2018 name artists Everybody Dies In Their Nightmares XXXTENTACION Jocelyn Flores XXXTENTACION Plug Walk Rich The Kid Moonlight XXXTENTACION Nevermind Dennis Lloyd In My Mind Dynoro changes XXXTENTACION
  27. ‣ Sample lecture: rstudio-education.github.io/datascience-box/ course-materials/slides/u2_d07-logistic-regression/u2_d07- logistic-regression.html ‣ Code: Go to

    bit.ly/rscloud-ecots2020, start the project titled 04 - Spam filter ‣ Book chapter: OpenIntro Statistics, 4th Edition (Diez, Çetinkaya-Rundel, and Barr, 2019), Chapter 9.5 with randomised controlled trial data on discrimination on job application evaluation openintro.org/book/os Resources
  28. teams: weekly labs in teams + periodic team evaluations +

    term project in teams peer feedback: used minimally so far, but positive experience “minute paper”: weekly online quizzes ending with a brief reflection of the week’s material
  29. # A tibble: 19 x 2 bigram n <chr> <int>

    1 question 7 19 2 question 8 16 3 questions 7 12 4 join function 9 5 question 2 9 6 choice questions 7 7 first question 7 8 multiple choice 7 9 correct answer 6 10 necessarily improve 6 11 join functions 5 12 question 1 5 13 7 8 4 14 airline names 4 15 data frames 4 16 feel like 4 17 many options 4 18 right answer 4 19 x axis 4
  30. teams: weekly labs in teams + periodic team evaluations +

    term project in teams peer feedback: used minimally so far, but positive experience “minute paper”: weekly online quizzes ending with a brief reflection of the week’s material creativity: assignments that make room for creativity
  31. on

  32. Image credit: Thomas Pedersen, data-imaginist.com/art the art and science of

    teaching data science mine çetinkaya-rundel mine-cetinkaya-rundel [email protected] @minebocek bit.ly/ds-art-sci-numbat Code for all case studies: bit.ly/introds-ecots2020-cases or bit.ly/rscloud-ecots2020