Upgrade to Pro
— share decks privately, control downloads, hide ads and more …
Speaker Deck
Features
Speaker Deck
PRO
Sign in
Sign up for free
Search
Search
10 Key Performance Indicators - Bernie Hackett,...
Search
Sponsored
·
Ship Features Fearlessly
Turn features on and off without deploys. Used by thousands of Ruby developers.
→
mongodb
December 12, 2011
Technology
370
2
Share
Embed
Copy iframe code
Copy JS code
Copy link
Start on current slide
10 Key Performance Indicators - Bernie Hackett, 10gen
MongoSV 2011
mongodb
December 12, 2011
More Decks by mongodb
See All by mongodb
NoSQL Now! 2012
mongodb
18
3.4k
MongoDB 2.2 At the Silicon Valley MongoDB User Group
mongodb
9
1.5k
Turning off the LAMP Hunter Loftis, Skookum Digital Works
mongodb
2
1.6k
Mobilize Your MongoDB! Developing iPhone and Android Apps in the Cloud Grant Shipley, Red Hat
mongodb
0
570
Beanstalk Data - MongoDB In Production Chris Siefken, CTO Beanstalk Data
mongodb
0
580
New LINQ support in C#/.NET driver Robert Stam, 10gen
mongodb
9
41k
Welcome and Keynote Aaron Heckman, 10gen
mongodb
0
550
Webinar Introduction to MongoDB's Java Driver
mongodb
1
1.3k
Webinar Intro to Schema Design
mongodb
4
1.8k
Other Decks in Technology
See All in Technology
GoでCコンパイラを作った話
repunit
0
170
論語・武士道・産業革命から見る かわるもの、かわらないもの
ichimichi
8
1.2k
データエンジニアこそ組織のオントロジーに向き合うべき — 問いに答えるAIから、事業を動かすAIへ
gappy50
2
410
複数プロダクトで進めるAI機能実装 ── 実践から得たリアルな学びとロードマップ実現への挑戦 / AICon2026_yanari
rakus_dev
1
310
Multicaで30個のミニプロジェクトをAIエージェント運用して見えてきたこと
eiei114
1
670
副作用のある Lambda でも Lambda Power Tuning は使えるのか / lambda-power-tuning-side-effects
koukihosaka
2
150
歴史から理解するクラウドインフラのしくみ
kizawa2020
0
170
コンテナ・K8s研修【MIXI 26新卒技術研修】
mixi_engineers
PRO
1
280
OPENLOGI Company Profile for engineer
hr01
1
75k
現場との対話から始める “作る前に問い直す”業務改善
mochico50
2
310
Webアプリ認証の全体像 / The Big Picture of Web App Authentication
kitano_yuichi
1
450
AI Native なプロダクト組織の立ち上げ方 : 生産性 100 倍への挑戦
mikesorae
0
1.5k
Featured
See All Featured
First, design no harm
axbom
PRO
2
1.2k
Building a A Zero-Code AI SEO Workflow
portentint
PRO
0
640
The Art of Programming - Codeland 2020
erikaheidi
57
14k
Dominate Local Search Results - an insider guide to GBP, reviews, and Local SEO
greggifford
PRO
0
220
How to optimise 3,500 product descriptions for ecommerce in one day using ChatGPT
katarinadahlin
PRO
1
3.7k
The Curse of the Amulet
leimatthew05
2
13k
Deep Space Network (abreviated)
tonyrice
0
230
Ethics towards AI in product and experience design
skipperchong
2
330
Docker and Python
trallard
47
4k
Effective software design: The role of men in debugging patriarchy in IT @ Voxxed Days AMS
baasie
0
450
Templates, Plugins, & Blocks: Oh My! Creating the theme that thinks of everything
marktimemedia
31
2.8k
Color Theory Basics | Prateek | Gurzu
gurzu
0
400
Transcript
10 Key Performance Indicators Bernie Hackett 10gen
Agenda • Tools • Performance Indicators
Speed MongoDB is a high-performance database, but how do I
know that I’m getting the best performance
TOOLS
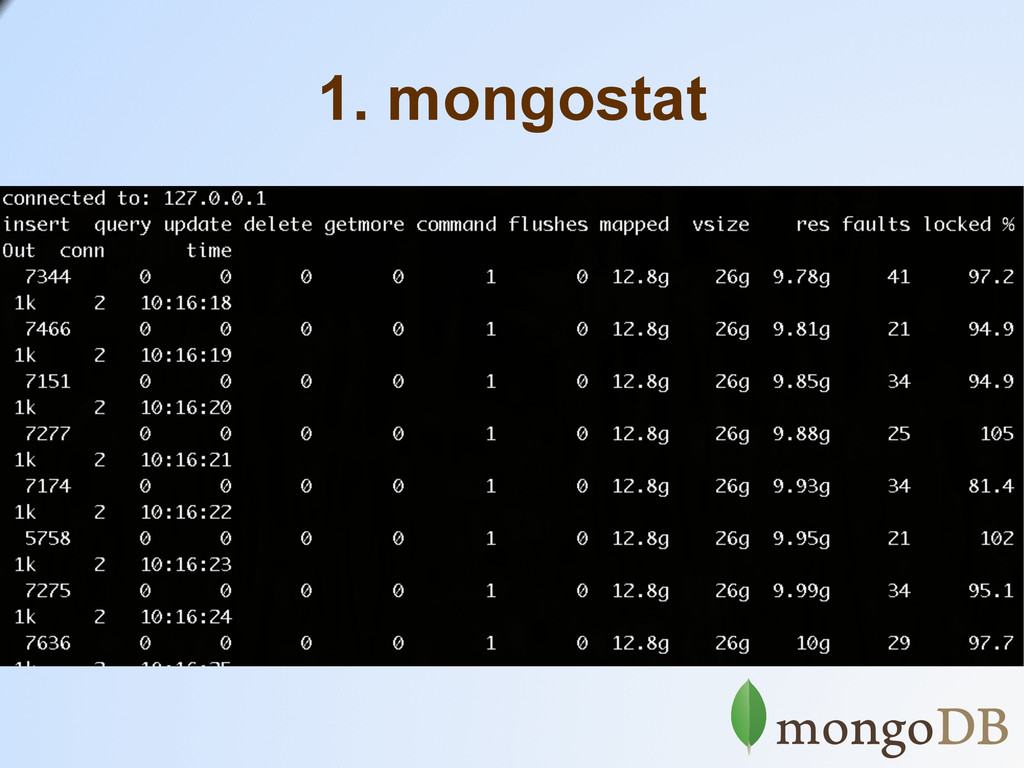
1. mongostat
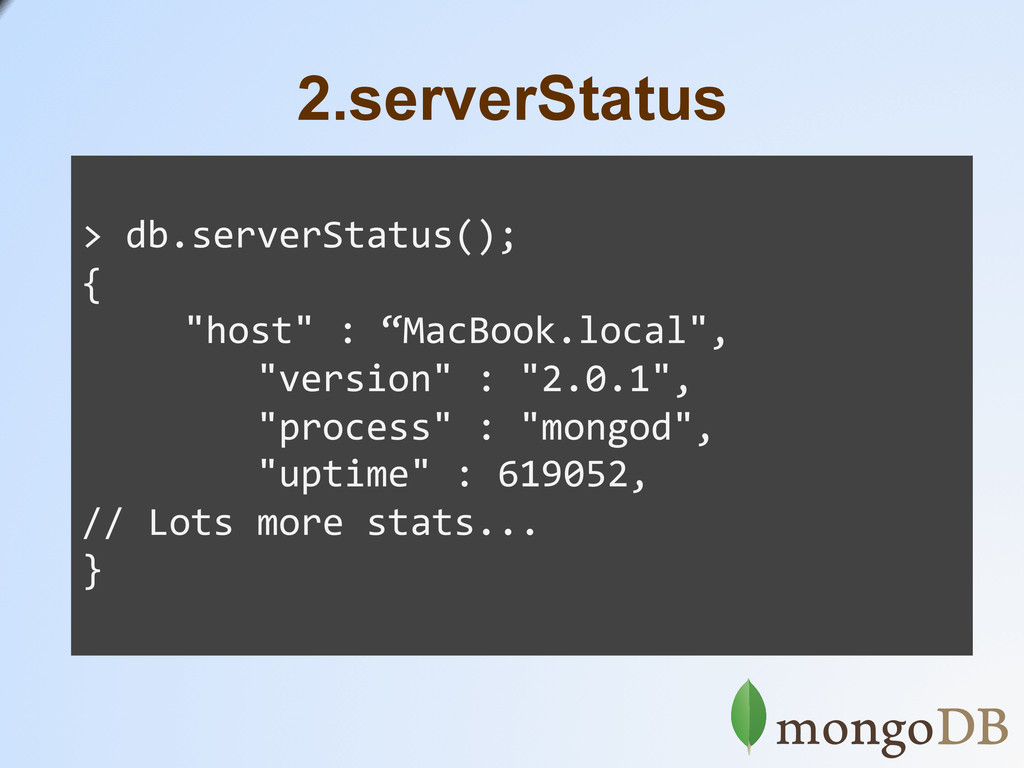
2.serverStatus > db.serverStatus(); { "host" :
“MacBook.local", "version" : "2.0.1", "process" : "mongod", "uptime" : 619052, // Lots more stats... }
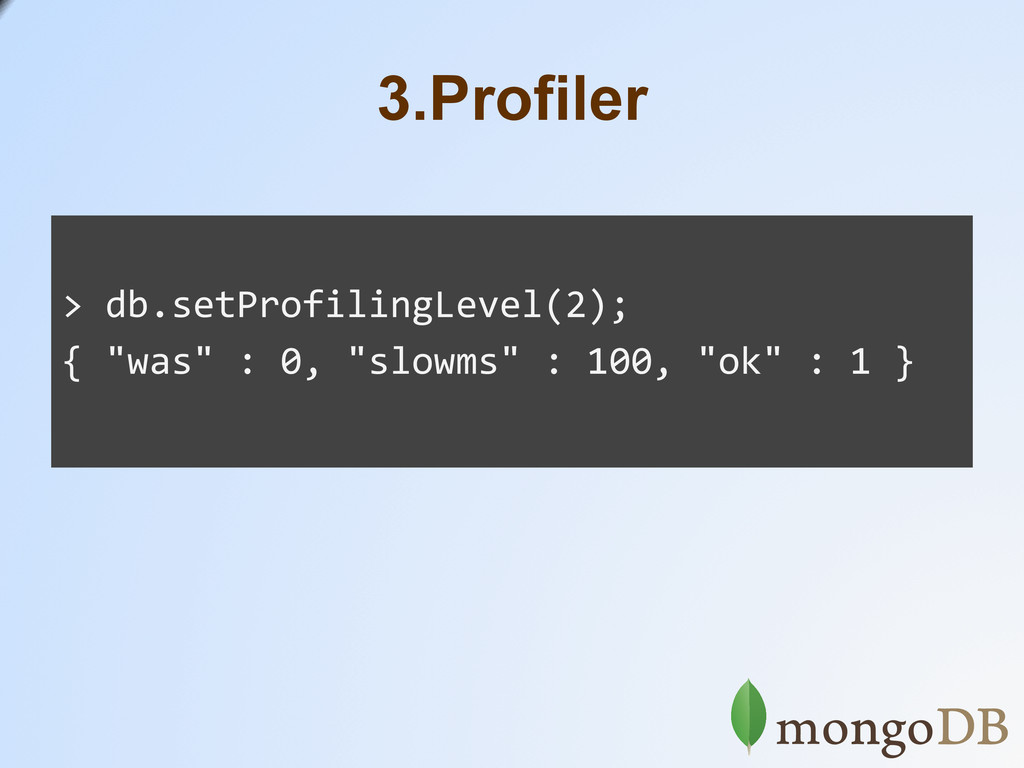
3.Profiler > db.setProfilingLevel(2); { "was" : 0, "slowms"
: 100, "ok" : 1 }
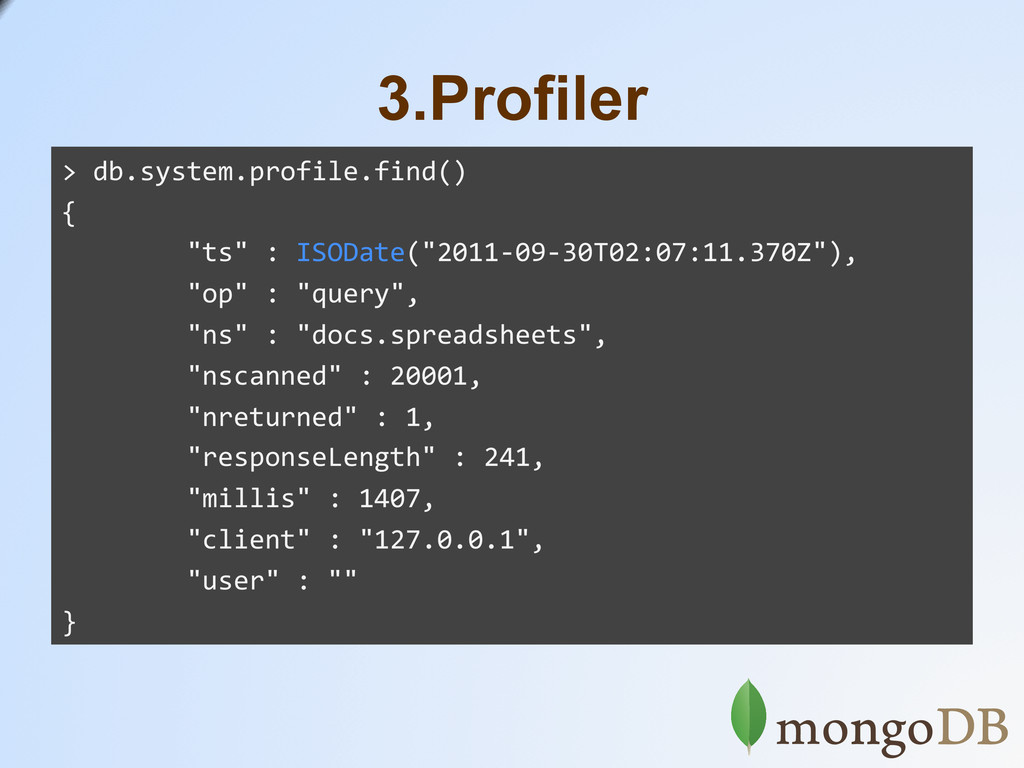
3.Profiler > db.system.profile.find() {
"ts" : ISODate("2011-‐09-‐30T02:07:11.370Z"), "op" : "query", "ns" : "docs.spreadsheets", "nscanned" : 20001, "nreturned" : 1, "responseLength" : 241, "millis" : 1407, "client" : "127.0.0.1", "user" : "" }
4.Monitoring Service • MMS: 10gen.com/try-mms • Nagios • Munin
INDICATORS
1.Slow Operations Sun May 22 19:01:47 [conn10] query docs.spreadsheets
ntoreturn:100 reslen: 510436 nscanned:19976 { username: “Hackett, Bernie”} nreturned:100 147ms
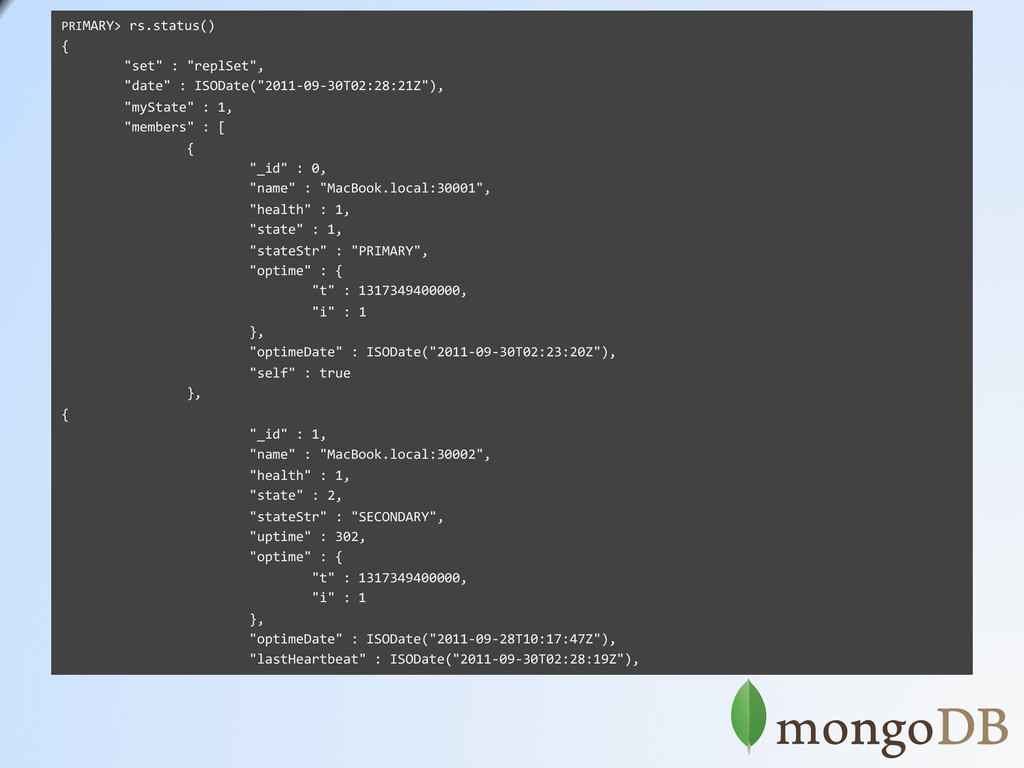
2.Replication Lag PRIMARY> rs.status() {
"set" : "replSet", "date" : ISODate("2011-‐09-‐30T02:28:21Z"), "myState" : 1, "members" : [ { "_id" : 0, "name" : "MacBook.local:30001", "health" : 1, "state" : 1, "stateStr" : "PRIMARY", "optime" : { "t" : 1317349400000, "i" : 1 }, "optimeDate" : ISODate("2011-‐09-‐30T02:23:20Z"), "self" : true }, { "_id" : 1, "name" : "MacBook.local:30002", "health" : 1, "state" : 2, "stateStr" : "SECONDARY", "uptime" : 302, "optime" : { "t" : 1317349400000, "i" : 1 }, "optimeDate" : ISODate("2011-‐09-‐28T10:17:47Z"), "lastHeartbeat" : ISODate("2011-‐09-‐30T02:28:19Z"),
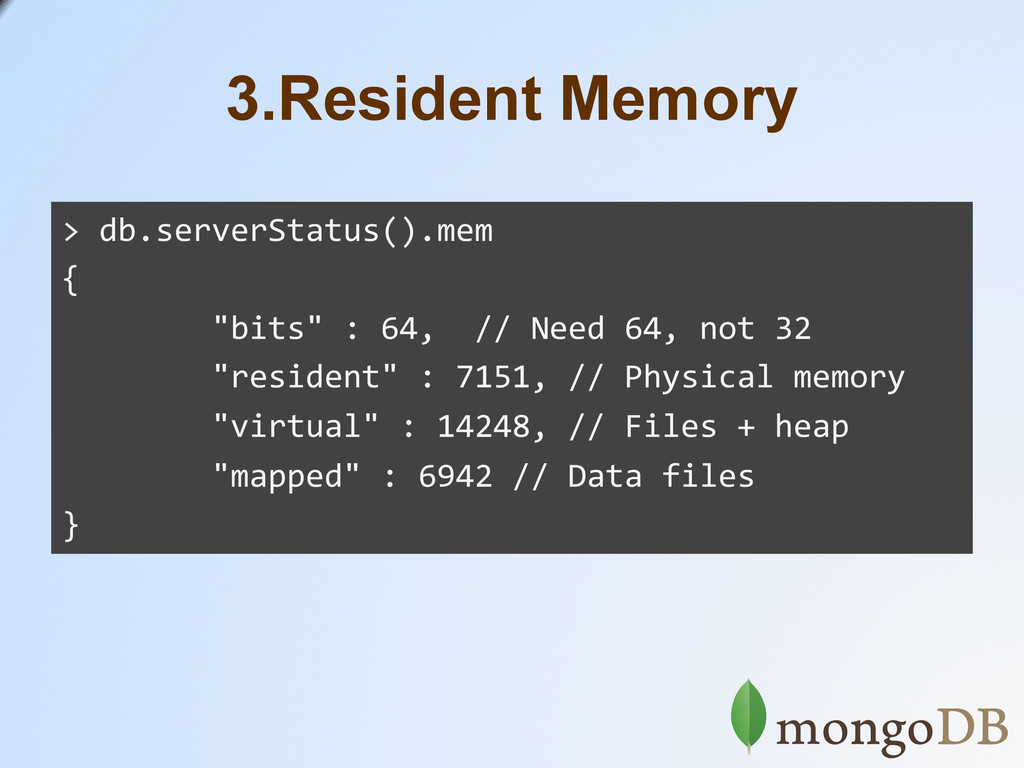
3.Resident Memory > db.serverStatus().mem {
"bits" : 64, // Need 64, not 32 "resident" : 7151, // Physical memory "virtual" : 14248, // Files + heap "mapped" : 6942 // Data files }
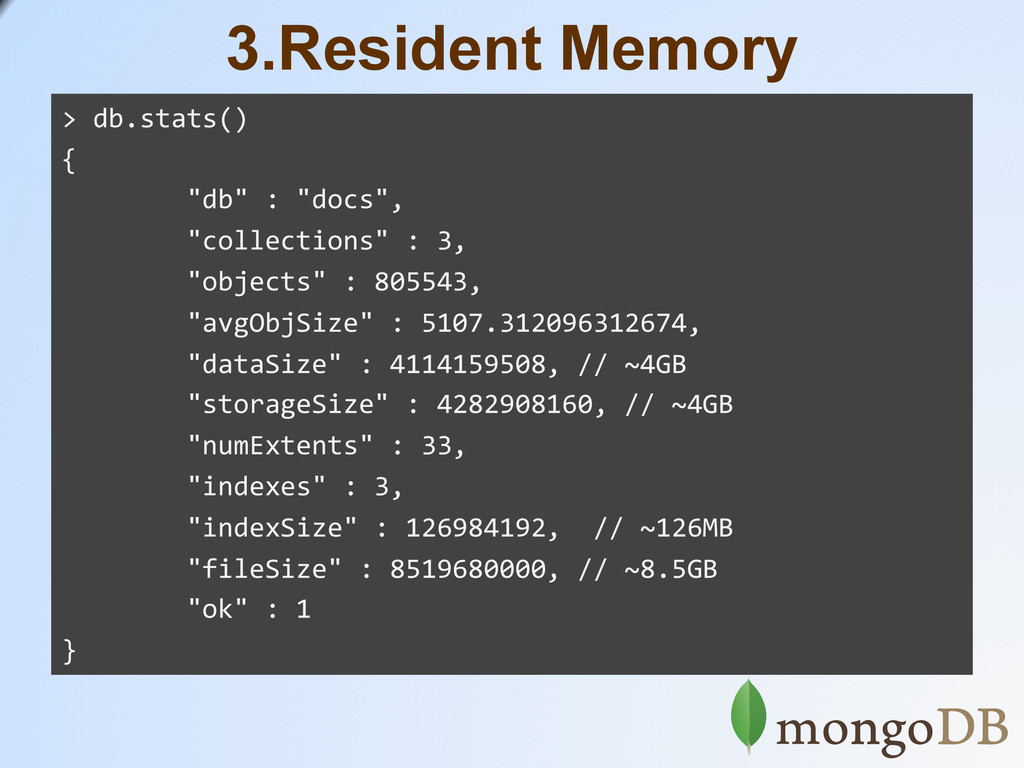
3.Resident Memory > db.stats() {
"db" : "docs", "collections" : 3, "objects" : 805543, "avgObjSize" : 5107.312096312674, "dataSize" : 4114159508, // ~4GB "storageSize" : 4282908160, // ~4GB "numExtents" : 33, "indexes" : 3, "indexSize" : 126984192, // ~126MB "fileSize" : 8519680000, // ~8.5GB "ok" : 1 }
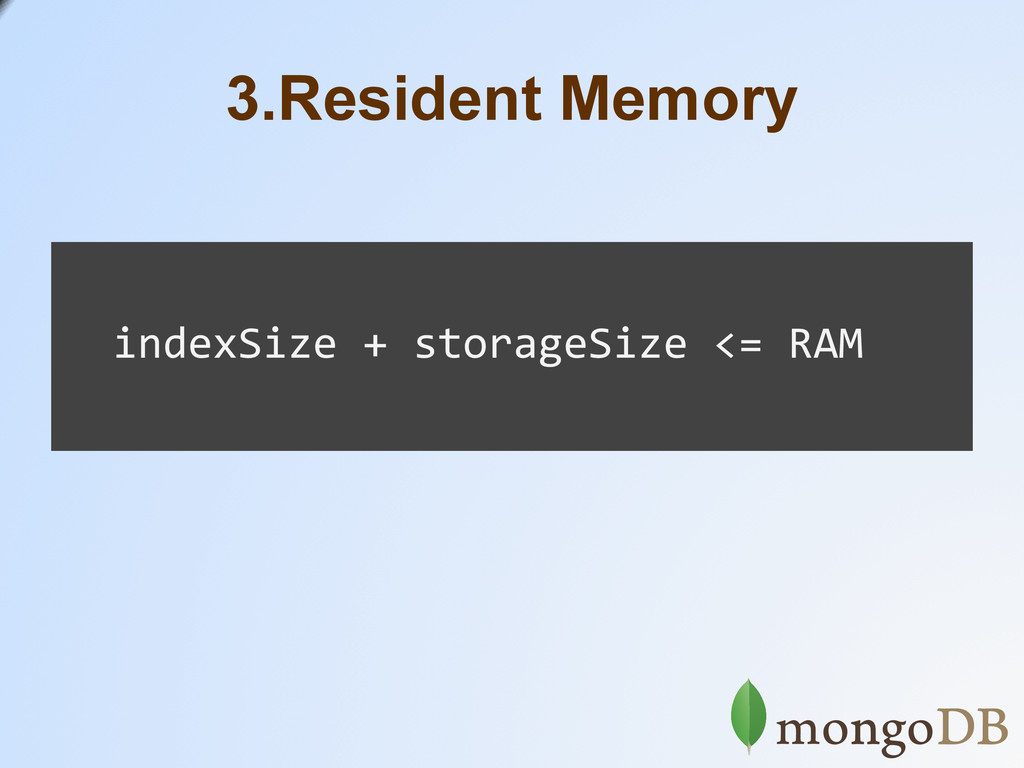
3.Resident Memory indexSize + storageSize <= RAM
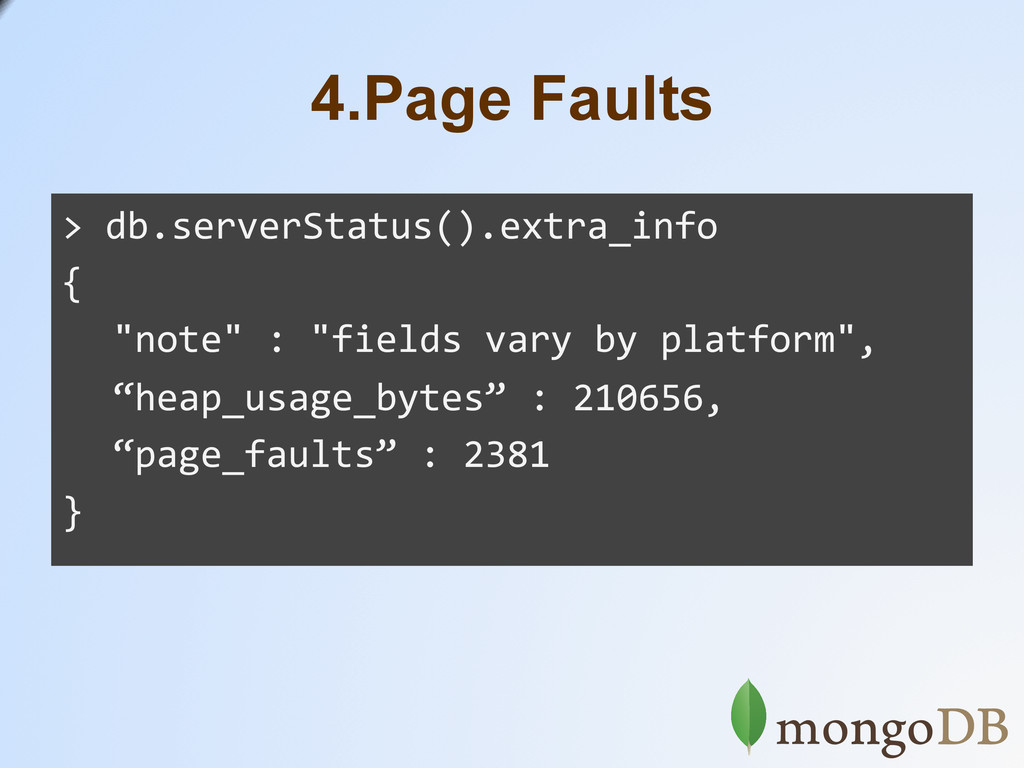
4.Page Faults > db.serverStatus().extra_info { "note" :
"fields vary by platform", “heap_usage_bytes” : 210656, “page_faults” : 2381 }
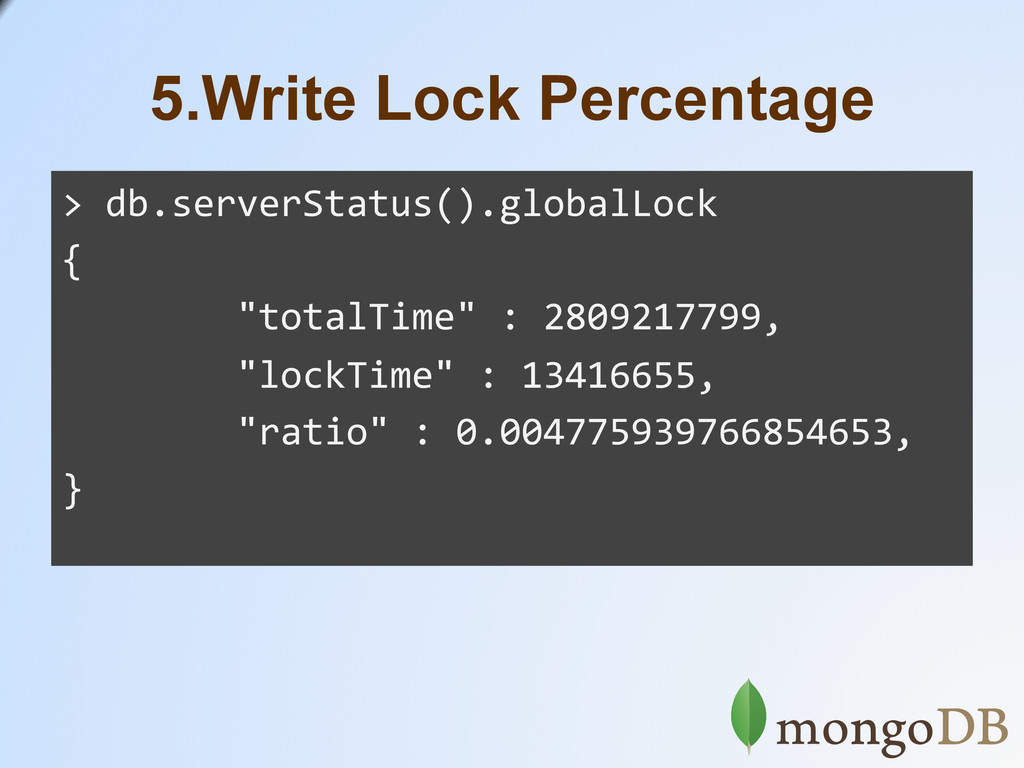
5.Write Lock Percentage > db.serverStatus().globalLock {
"totalTime" : 2809217799, "lockTime" : 13416655, "ratio" : 0.004775939766854653, }
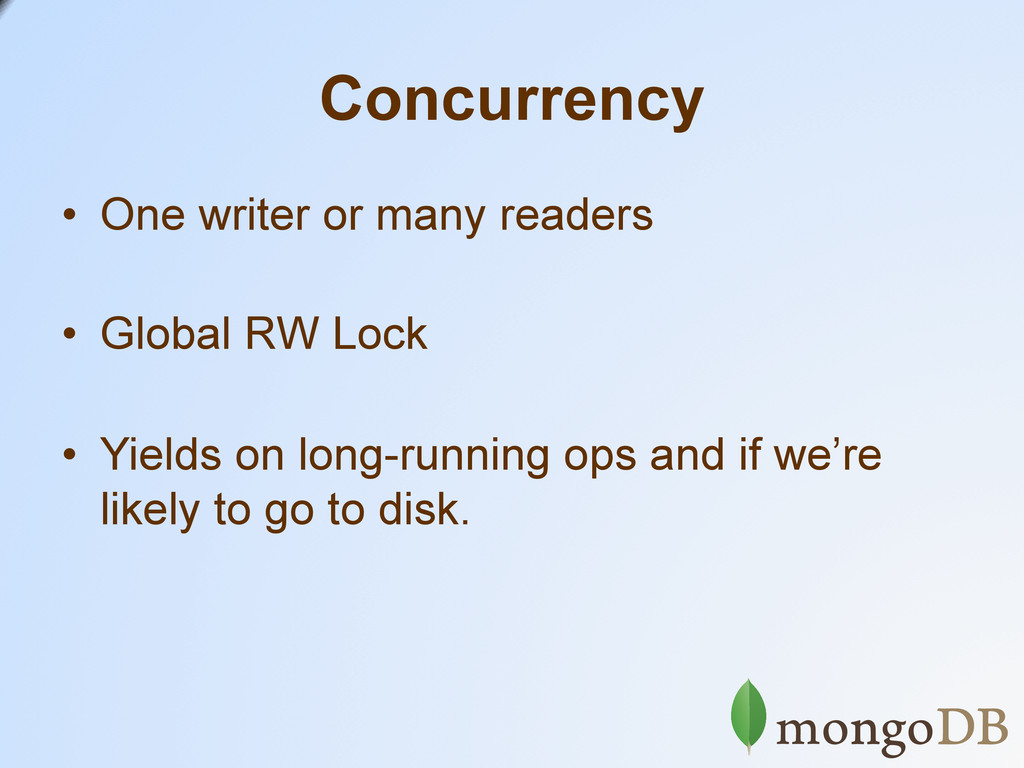
Concurrency • One writer or many readers • Global RW
Lock • Yields on long-running ops and if we’re likely to go to disk.
High Lock Percentage? You’re Probably Paging!
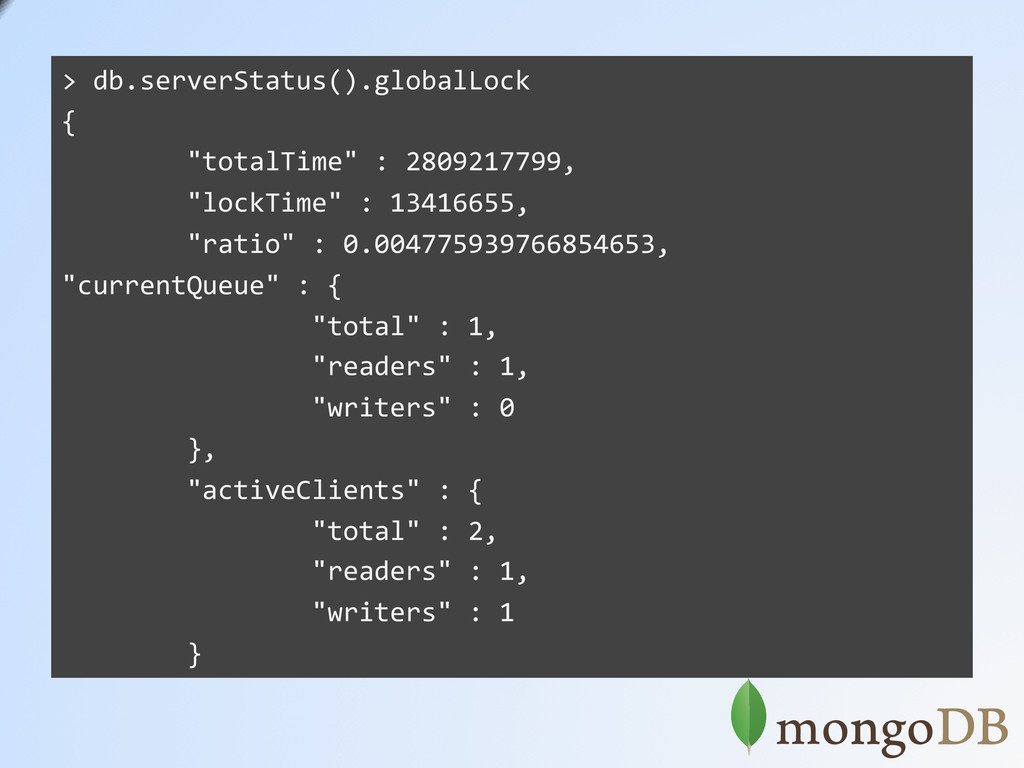
6.Reader and Writer Queues > db.serverStatus().globalLock {
"totalTime" : 2809217799, "lockTime" : 13416655, "ratio" : 0.004775939766854653, "currentQueue" : { "total" : 1, "readers" : 1, "writers" : 0 }, "activeClients" : { "total" : 2, "readers" : 1, "writers" : 1 }
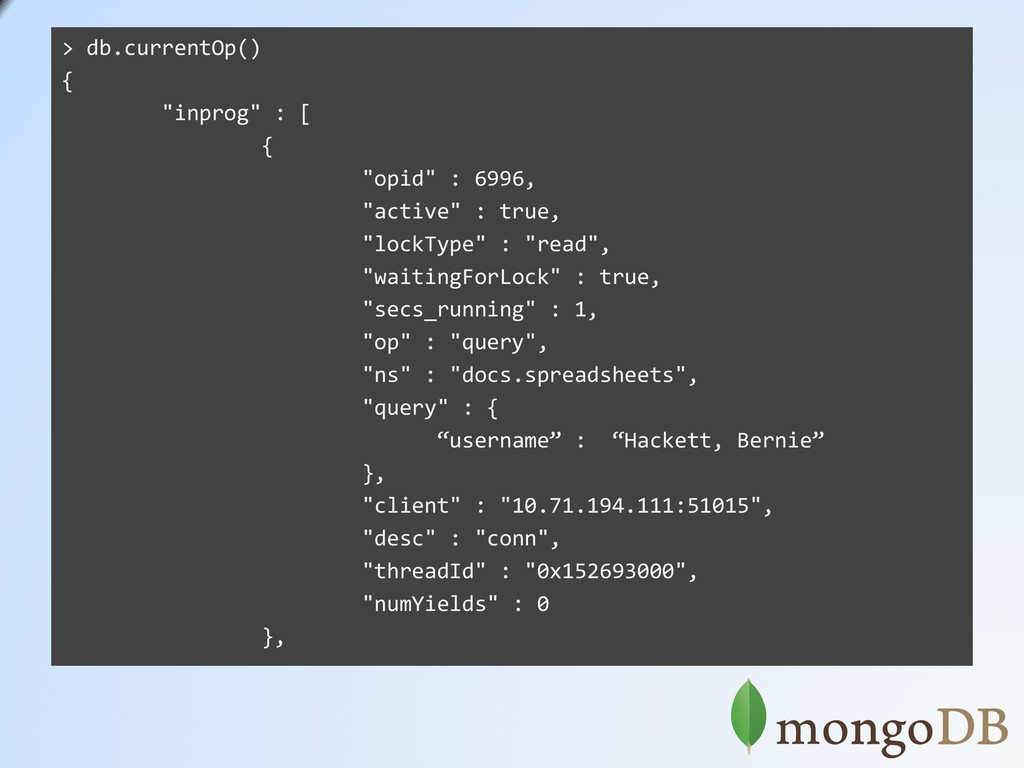
6.Reader and Writer Queues > db.currentOp() {
"inprog" : [ { "opid" : 6996, "active" : true, "lockType" : "read", "waitingForLock" : true, "secs_running" : 1, "op" : "query", "ns" : "docs.spreadsheets", "query" : { “username” : “Hackett, Bernie” }, "client" : "10.71.194.111:51015", "desc" : "conn", "threadId" : "0x152693000", "numYields" : 0 },
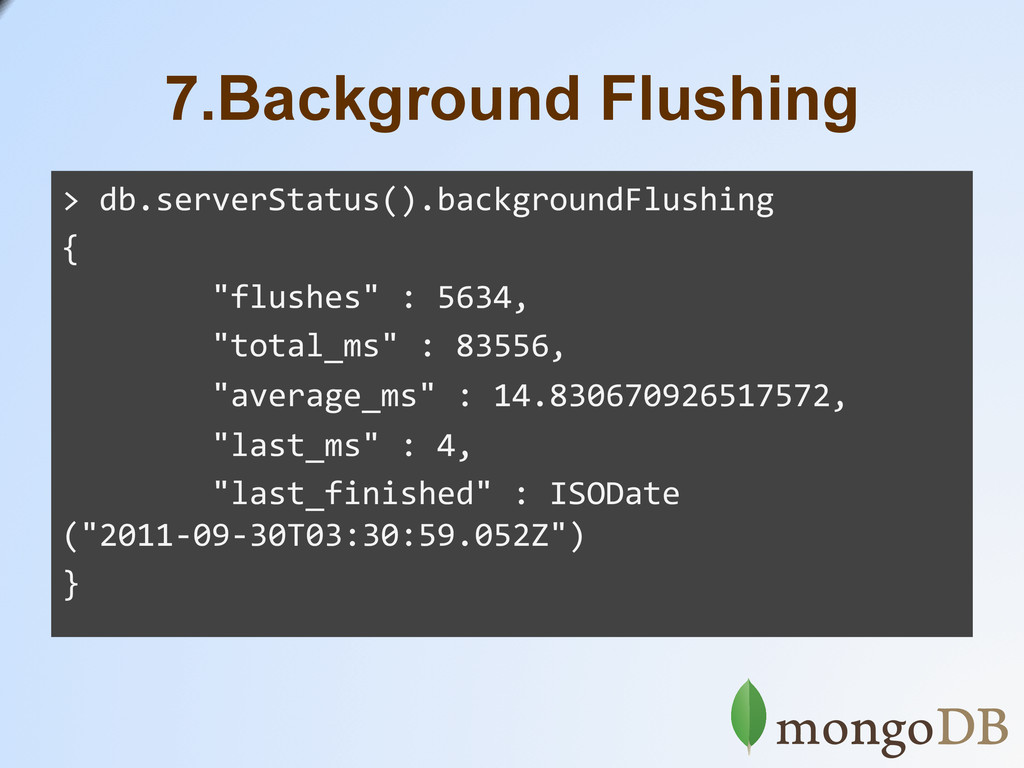
7.Background Flushing > db.serverStatus().backgroundFlushing {
"flushes" : 5634, "total_ms" : 83556, "average_ms" : 14.830670926517572, "last_ms" : 4, "last_finished" : ISODate ("2011-‐09-‐30T03:30:59.052Z") }
Disk Considerations • Raid • SSD • SAN?
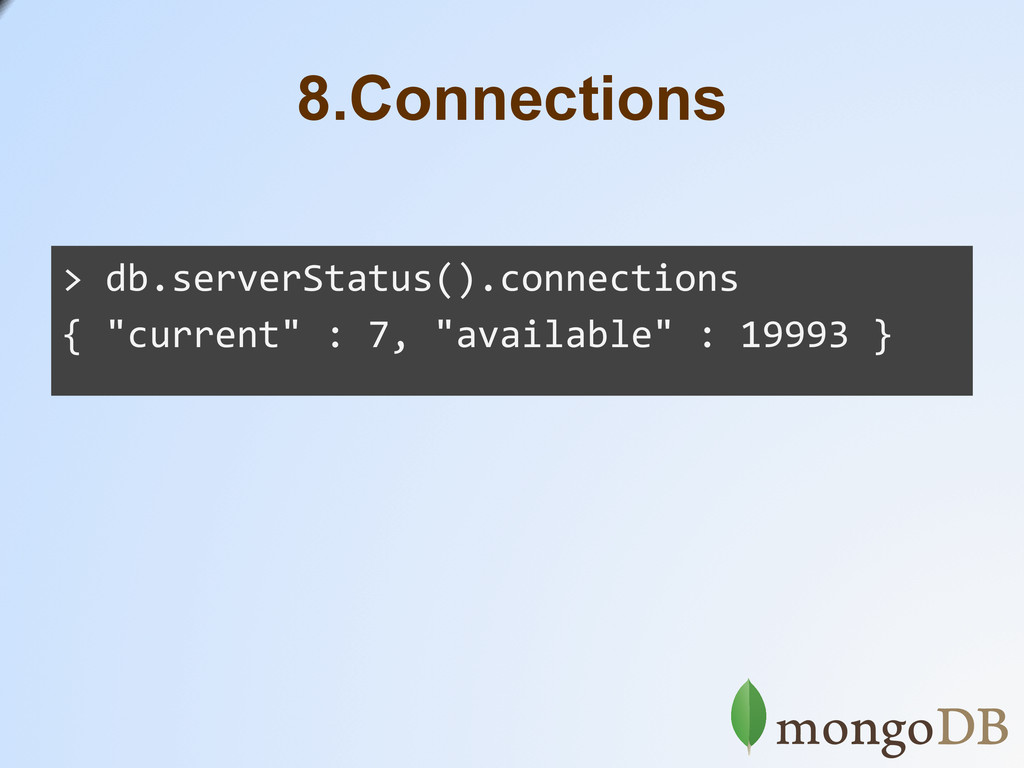
8.Connections > db.serverStatus().connections { "current" : 7, "available" :
19993 }
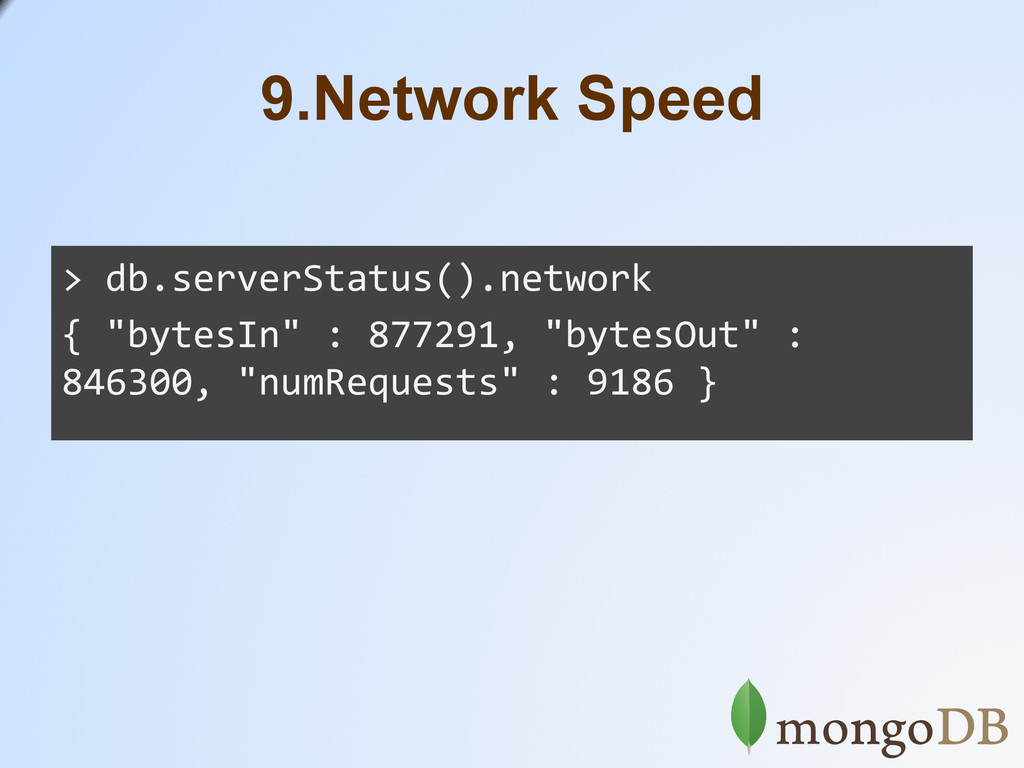
9.Network Speed > db.serverStatus().network { "bytesIn" : 877291, "bytesOut"
: 846300, "numRequests" : 9186 }
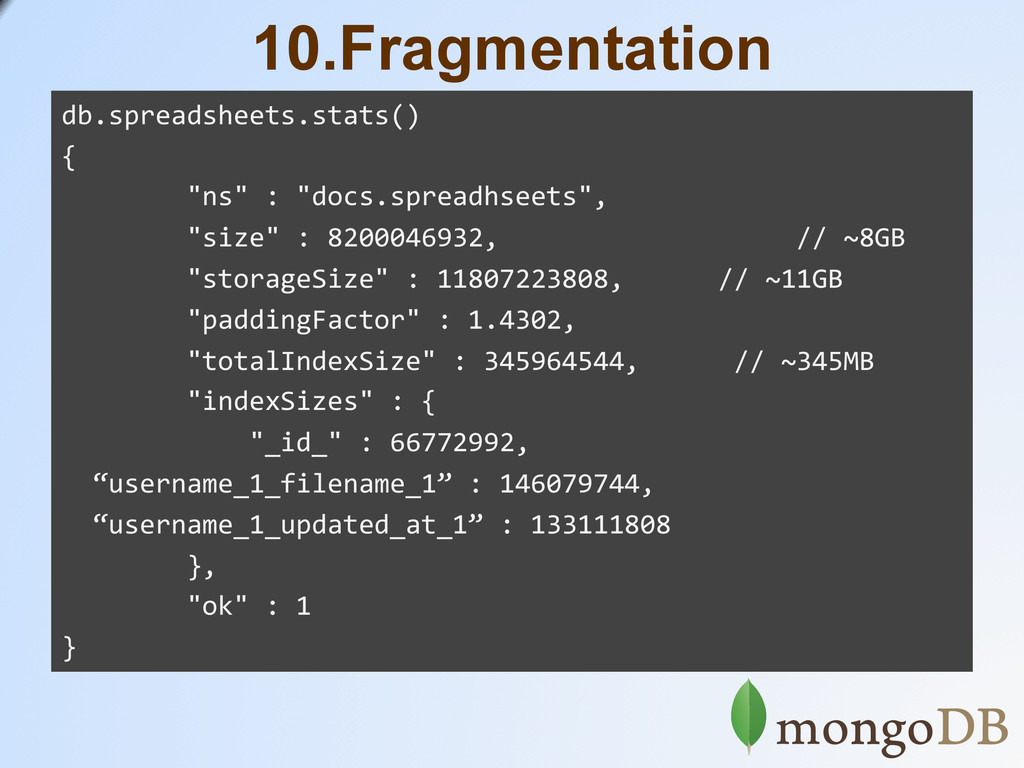
10.Fragmentation db.spreadsheets.stats() {
"ns" : "docs.spreadhseets", "size" : 8200046932, // ~8GB "storageSize" : 11807223808, // ~11GB "paddingFactor" : 1.4302, "totalIndexSize" : 345964544, // ~345MB "indexSizes" : { "_id_" : 66772992, “username_1_filename_1” : 146079744, “username_1_updated_at_1” : 133111808 }, "ok" : 1 }
10.Fragmentation 2 is the Magic Number
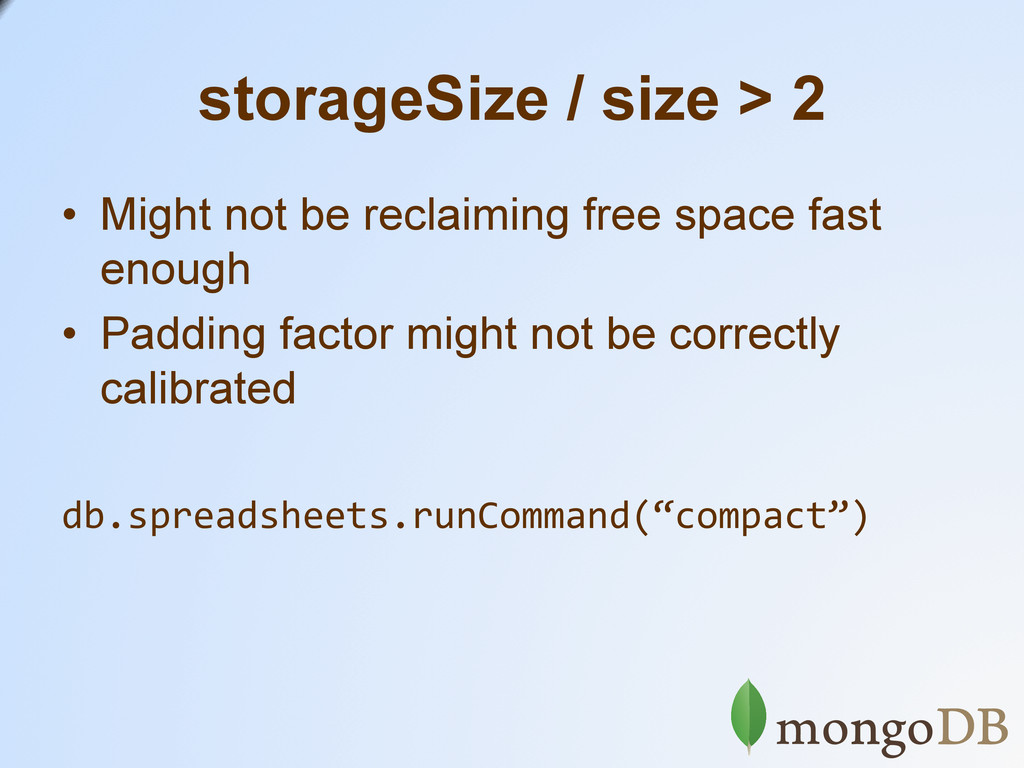
storageSize / size > 2 • Might not be reclaiming
free space fast enough • Padding factor might not be correctly calibrated db.spreadsheets.runCommand(“compact”)
paddingFactor > 2 • You might have the wrong data
model • You might be growing documents too much • Should review Schema Design
download at mongoDB.org
Weʼre Hiring" Engineers, Sales, Evangelist, Marketing, Support, Developers @mongodb_jobs
http://linkd.in/joinmongo
Weʼre Always Around" For Conferences, Appearances and Meetups 10gen.com/events
@mongodb h3p://bit.ly/mongo9
![1.Slow Operations Sun May 22 19:01:47 [conn10] query docs.spreadsheets](https://files.speakerdeck.com/presentations/4ee655a9c670e3049000dfda/slide_10.jpg)