Share
Embed
Monitoring Solr
Monitoring Apache Solr and its index with Prometheus and Grafana.
Minoru Osuka
July 20, 2018
Transcript
36 slides
-
େਢլ ູ (͓͓͔͢ ΈͷΔ) • Apache ιϑτΣΞࡒஂ ίϛολʔ https://www.apache.org •
θοτϥϘגࣜձࣾ / Ϡϑʔגࣜձࣾ https://zlab.co.jp / https://www.yahoo.co.jp • [վగୈ3൛] Apache Solrೖ - ΦʔϓϯιʔεશจݕࡧΤϯδϯ ڞචऀ http://gihyo.jp/book/2017/978-4-7741-8930-7 http://gihyo.jp/book/2014/978-4-7741-6163-1 ࣗݾհ -
Z Lab ͷ Solr Ϣʔεέʔε ΞϓϦέʔγϣϯ Containerɺ Virtual Machine ͷϩάͷอଘ
LOG LOG LOG Monitoring Alerting Visualize LOG LOG LOG etc... Log store Banana Visualize -
Solr ϞχλϦϯάʹ͑Δ API • Ping - https://lucene.apache.org/solr/guide/ping.html • MBean Request
Handler - https://lucene.apache.org/solr/guide/mbean-request-handler.html • CoreAdmin API - https://lucene.apache.org/solr/guide/coreadmin-api.html • Collections API - https://lucene.apache.org/solr/guide/collections-api.html • Metrics API - https://lucene.apache.org/solr/guide/metrics-reporting.html • etc... -
Solr ͷαϙʔτ͢ΔϝτϦΫεϞχλϦϯάιϑτΣΞ • jconsole - https://docs.oracle.com/javase/9/tools/jconsole.html • Graphite - http://graphiteapp.org
• Ganglia - http://ganglia.info • etc... Reporter Λͬͯ Solr ͷϝτϦΫεΛ GraphiteɺGanglia ͳͲૹ৴Մೳ • Reporters - https://lucene.apache.org/solr/guide/metrics-reporting.html#reporters -
Z Lab ͰͷϝτϦΫεϞχλϦϯά Monitoring Alerting Visualize etc... node_exporter jmx_exporter mysqld_exporter
ΞϓϦέʔγϣϯ Containerɺ Virtual Machine ͷϝτϦΫεΛ Prometheus อଘ -
Z Lab ͰͷϩάϞχλϦϯά ΞϓϦέʔγϣϯ Containerɺ Virtual Machine ͷϩάΛ Solr อଘ
LOG LOG LOG LOG LOG LOG etc... Log store Banana Visualization ՄࢹԽͷΈ ! -
ϩάͷϞχλϦϯάʁ LOG LOG LOG LOG LOG LOG Log store Log
collector ʁ etc... Visualization ӡ༻͢ΔࢹγεςϜ૿ ! ϊϋͷ͋Δ Solr ͰͳΜͱ͔ ! -
Z Lab ͰͷϩάϞχλϦϯά طଘͷࢹγεςϜͱ Solr Λ ͏·͘࿈ܞͤ͞Δ LOG LOG LOG
Log / Metrics Monitoring, Alerting Metrics Visualization LOG LOG LOG Log store Banana Log Visualization etc... -
Prometheus ͱ Grafana Λͬͨ Solr ͷϞχλϦϯά • Solr 7.3.0 ͔Β
Solr ͷϝτϦΫεΛ Prometheus ʹެ։͢ΔͨΊͷ Exporter ΛՃ - Solr ͷҰൠతͳϝτϦΫεΛσϑΥϧτͰऩू - Grafana ͷαϯϓϧμογϡϘʔυΛఏڙ • GitHub ɹɹhttps://github.com/apache/lucene-solr/tree/master/solr/contrib/prometheus-exporter • Solr Ref Guide ɹɹhttp://lucene.apache.org/solr/guide/monitoring-solr-with-prometheus-and-grafana.html -
Prometheus • ࣌ܥྻσʔλϕʔεΛแͨ͠Φʔϓϯιʔεͷ Pull ܕͷαʔϏεࢹγεςϜ • ಠࣗͷΫΤϦݴޠΛ࣋ͭ • ݩ Google
ͷΤϯδχΞ͕ Google ࣾγεςϜ (Borg) ͷ ࢹγεςϜ (Borgmon) ʹΠϯεύΠΞ͞Εͯ։ൃ • Exporter Λ࡞͢Δ͜ͱͰɺϝτϦΫεΛ Prometheus ͕ऩूͰ͖Δ https://prometheus.io -
Grafana • Kibana ͔ΒϑΥʔΫͨ͠Φʔϓϯιʔεͷ σʔλՄࢹԽπʔϧ • ࣌ܥྻσʔλͷՄࢹԽʹϑΥʔΧε • ՄࢹԽ͚ͩͰͳ͘ɺΞϥʔςΟϯάߦ͑ɺϓϥάΠϯʹΑΔ μογϡϘʔυͷ֦ு͕Մೳ
• Prometheus InfluxDB ͳͲɺଟ͘ͷ࣌ܥྻσʔλϕʔεʹରԠ https://grafana.com -
solr-exporter • Prometheus ͕ऩूͰ͖ΔϑΥʔϚοτͰ Solr ͷ ϝτϦΫεΛऩूɾެ։͢Δখ͞ͳ HTTP αʔό •
Java Ͱ։ൃ (SolrJ Λར༻) • ελϯυΞϩʔϯͷ Solr ͚ͩͰͳ͘ SolrCloud ʹରԠ • Solr ͷݕࡧ݁ՌϝτϦΫεͱͯ͠ѻ͏͜ͱ͕Ͱ͖Δ -
solr-exporter Query Pull Metrics Push alerts Notify Query Visualize Find
targets Service Discovery Find nodes Register -
solr-exporter ͷىಈ • Standalone mode (Linux) • SolrCloud mode (Linux)
• ϝτϦΫεެ։ URL ɹɹhttp://localhost:9854/metrics $ cd contrib/prometheus-exporter $ ./bin/solr-exporter -p 9854 -b http://localhost:8983/solr -f ./conf/solr-exporter-config.xml -n 8 $ cd contrib/prometheus-exporter $ ./bin/solr-exporter -p 9854 -z localhost:2181/solr -f ./conf/solr-exporter-config.xml -n 16 -
solr-exporter ͷઃఆ • solr-exporter Λىಈ͢Δ͚ͩͰɺ͙͢ʹओཁͳϝτϦΫεͷऩू͕Մೳ • Solr ͷϨεϙϯεͷ JSON Λύʔε͢Δͷʹ
jq γϯλοΫεΛ࠾༻ • ඞཁʹԠͯ͡ solr-exporter-config.xml Λฤू͠ɺϝτϦΫεͷऩूํ๏ͳͲมߋՄೳ - ऩू͢ΔϝτϦΫεͷՃɾআ - ϝτϦΫε໊ͷมߋ - etc -
solr-exporter ͷઃఆ • solr-exporter ͷઃఆϑΝΠϧγϯϓϧͰɺ࣍ͷΑ͏ͳλάͰߏ • rules λάʹ࣍ͷϦΫΤετΛؚΉ͜ͱ͕Մೳ <config> <rules>
</rules> </config> <ping /> Ping ϦΫΤετϋϯυϥͷϨεϙϯεͷεΫϨΠϐϯά <metrics /> Metrics API ͷϨεϙϯεͷεΫϨΠϐϯά <collections /> Collections API ͷϨεϙϯεͷεΫϨΠϐϯά <search /> ݕࡧϦΫΤετͷϨεϙϯεͷεΫϨΠϐϯά -
<ping /> <ping> <lst name="request"> <lst name="query"> <str name="path">/admin/ping</str> </lst>
<arr name="jsonQueries"> <str> . as $object | $object | (if $object.status == "OK" then 1.0 else 0.0 end) as $value | { name : "solr_ping", type : "GAUGE", help : "See following URL: https://lucene.apache.org/solr/guide/ping.html", label_names : [], label_values : [], value : $value } </str> </arr> </lst> </ping> -
<metrics /> <metrics> <lst name="request"> <lst name="query"> <str name="path">/admin/metrics</str> <lst
name="params"> <str name="group">all</str> <str name="type">all</str> </lst> </lst> <arr name="jsonQueries"> <str> .metrics["solr.jetty"] | to_entries | .[] | select(.key | startswith("org.eclipse.jetty.server.handler.DefaultHandler")) | select(.key | endswith("xx-responses")) as $object | $object.key | split(".") | last | split("-") | first as $status | $object.value.count as $value | { name : "solr_metrics_jetty_response_total", type : "COUNTER", help : "See following URL: https://lucene.apache.org/solr/guide/metrics-reporting.html", label_names : ["status"], label_values : [$status], value : $value } </str> </arr> </lst> </metrics> -
<collections /> <collections> <lst name="request"> <lst name="query"> <str name="path">/admin/collections</str> <lst
name="params"> <str name="action">CLUSTERSTATUS</str> </lst> </lst> <arr name="jsonQueries"> <str> .cluster.live_nodes | length as $value | { name : "solr_collections_live_nodes", type : "GAUGE", help : "See following URL: https://lucene.apache.org/solr/guide/collections-api.html", label_names : [], label_values : [], value : $value } </str> </arr> </lst> </collections> -
<search /> <search> <lst name="request"> <lst name="query"> <str name="core">collection1</str> <str
name="path">/select</str> <lst name="params"> <str name="q">*:*</str> <str name="json.facet"> { category: { type: terms, field: cat } } </str> </lst> </lst> <arr name="jsonQueries"> <str> .facets.category.buckets[] as $object | $object.val as $term | $object.count as $value | { name : "solr_facets_category", type : "GAUGE", help : "Category facets", label_names : ["term"], label_values : [$term], value : $value } </str> </arr> </lst> </search> -
ϝτϦΫεެ։ϑΥʔϚοτ • PrometheusͷϝτϦΫεެ։ϑΥʔϚοτ • # TYPE <name> <type> # HELP
<name> <help> <name>{<label_names[0]>=<label_values[0]>,<label_names[1]>=<label_values[1]>,...} <value> name ϝτϦοΫ໊ - ৄࡉ https://prometheus.io/docs/practices/naming/ type ϝτϦοΫܕ (COUNTERɺGAUGEɺSUMMARYɺHISTOGRAMɺUNTYPED) - ৄࡉ https://prometheus.io/docs/concepts/metric_types/ help ϝτϦοΫͷઆ໌ label_names ϝτϦοΫͷϥϕϧ໊ - ৄࡉ https://prometheus.io/docs/practices/naming/ label_values ϝτϦοΫͷϥϕϧ - ৄࡉ https://prometheus.io/docs/practices/naming/ value ϝτϦοΫ (Double ܕ) -
ϝτϦΫεެ։ϑΥʔϚοτ • JSON (มલ) • Prometheus Exposition Format (มޙ) {
"name": "solr_ping", "type": "GAUGE", "help": "See following URL: https://lucene.apache.org/solr/guide/ping.html", "label_names": ["base_url","core"], "label_values": ["http://localhost:8983/solr","collection1"], "value": 1.0 } # TYPE solr_ping gauge # HELP solr_ping See following URL: https://lucene.apache.org/solr/guide/ping.html solr_ping{base_url="http://localhost:8983/solr",core="collection1"} 1.0 -
ϝτϦΫεެ։ϑΥʔϚοτ $ curl -s http://localhost:9894/metrics # HELP solr_metrics_jetty_response_total See following
URL: https://lucene.apache.org/solr/... # TYPE solr_metrics_jetty_response_total counter solr_metrics_jetty_response_total{base_url="http://localhost:8983/solr",status="1xx",} 0.0 solr_metrics_jetty_response_total{base_url="http://localhost:8983/solr",status="2xx",} 516.0 solr_metrics_jetty_response_total{base_url="http://localhost:8983/solr",status="3xx",} 0.0 solr_metrics_jetty_response_total{base_url="http://localhost:8983/solr",status="4xx",} 0.0 solr_metrics_jetty_response_total{base_url="http://localhost:8983/solr",status="5xx",} 0.0 solr_metrics_jetty_response_total{base_url="http://localhost:8984/solr",status="1xx",} 0.0 solr_metrics_jetty_response_total{base_url="http://localhost:8984/solr",status="2xx",} 517.0 solr_metrics_jetty_response_total{base_url="http://localhost:8984/solr",status="3xx",} 0.0 solr_metrics_jetty_response_total{base_url="http://localhost:8984/solr",status="4xx",} 0.0 solr_metrics_jetty_response_total{base_url="http://localhost:8984/solr",status="5xx",} 0.0 ... [தུ] ... -
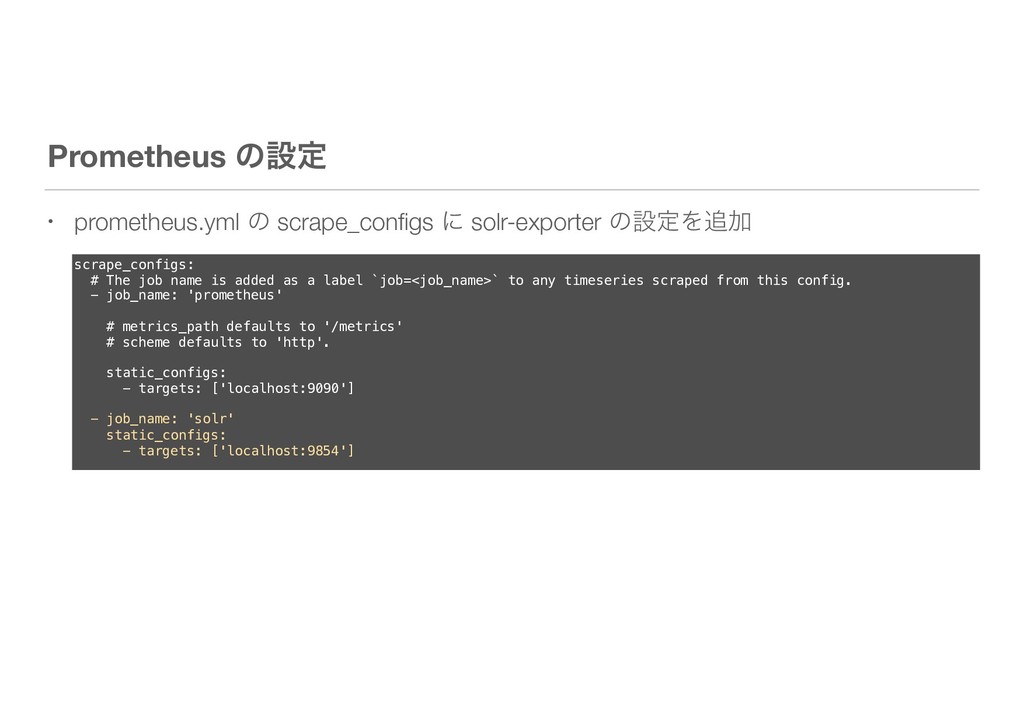
Prometheus ͷઃఆ • prometheus.yml ͷ scrape_configs ʹ solr-exporter ͷઃఆΛՃ scrape_configs:
# The job name is added as a label `job=<job_name>` to any timeseries scraped from this config. - job_name: 'prometheus' # metrics_path defaults to '/metrics' # scheme defaults to 'http'. static_configs: - targets: ['localhost:9090'] - job_name: 'solr' static_configs: - targets: ['localhost:9854'] -
• lucene-solr/solr/contrib/prometheus-exporter/conf ʹαϯϓϧͷ μογϡϘʔυΛಉࠝ - grafana-solr-dashboard.json • Grafana ʹμογϡϘʔυΛొ͙ͯ͢͠ར༻։࢝Ͱ͖Δ •
ඞཁʹԠͯ͡μογϡϘʔυΛฤूͯ͠ΧελϚΠζ Grafana μογϡϘʔυ -
solr-exporter ΛͬͯͰ͖ΔΑ͏ʹͳΔ͜ͱ • Solr ͷ༷ʑͳϝτϦΫεΛऩूՄೳ • Solr ͷΠϯσοΫεͷ༰ΛϝτϦΫεͱͯ͠ऩूՄೳ - ΞΫηεϩάΞϓϦέʔγϣϯϩάΛΠϯσοΫε͍ͯͨ͠Β...
- ΞΫηε݅ͷՄࢹԽɺΞϓϦέʔγϣϯͷΤϥʔͷݕ - EC αʔϏεͰใΛΠϯσοΫε͍ͯͨ͠Β... - ΧςΰϦʔຖͷͷਪҠɺҧ๏ͷݕ - SNS ͳͲͷϢʔβߘܕͷσʔλΛΠϯσοΫε͍ͯͨ͠Β... - ߘ͞ΕΔίϯςϯπʹؚ·ΕΔΩʔϫʔυͷਪҠɺެংྑଏʹ͢Δίϯςϯπͷݕ - etc.. -
·ͱΊ • Solr ͷՔಇঢ়گ͚ͩͰͳ͘ɺΠϯσοΫεϞχλϦϯά - CPU ετϨʔδͷར༻ͳͲͷϝτϦΫε͚ͩͰͳ͘ɺ อଘ͍ͯ͠Δσʔλ͕݈શͳঢ়ଶ͔νΣοΫͰ͖Δ • ͦΕͧΕͷ༻్ʹ߹ΘͤͯιϑτΣΞΛબͿ
- సஔΠϯσοΫεΛͬͨσʔλͷݕࡧݕࡧΤϯδϯ - ࣌ܥྻσʔλͷूܭղੳͳͲ࣌ܥྻσʔλϕʔε