Upgrade to Pro — share decks privately, control downloads, hide ads and more …

Monitoring for reliability

Monitoring for reliability

Running a production operation without monitoring is like driving a car without looking out at the road. This presentation aims to convince that monitoring is essential, show how it can be added to any application, and give some examples of what you can achieve with a well reasoned monitoring set-up.
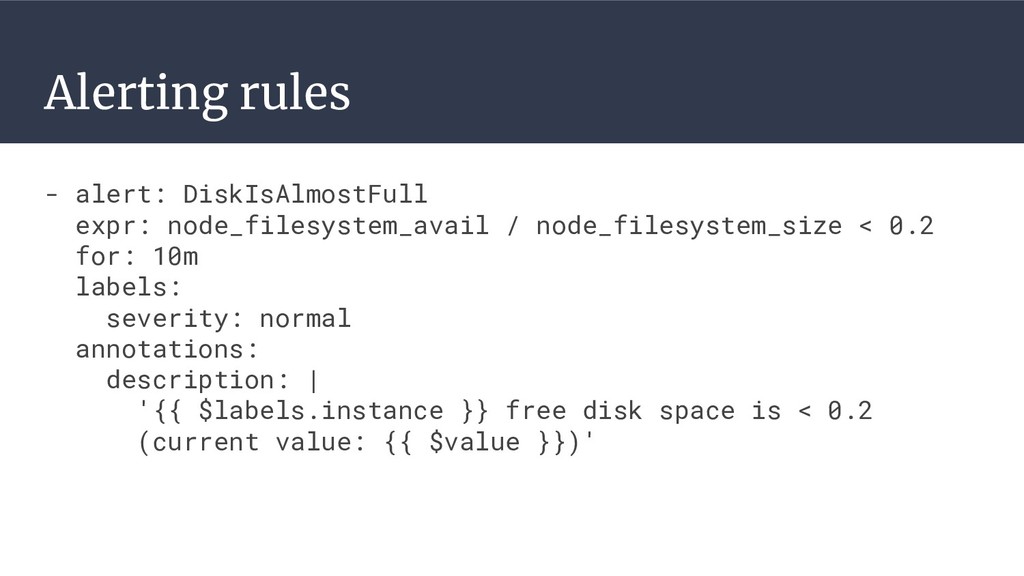
Michele Pittoni

October 14, 2018
Tweet

More Decks by Michele Pittoni

Other Decks in Technology

Transcript

  1. Load balancer AAA Proxy AAA DB API API DB Elasticsearch

    3rd party HAproxy HAproxy HAproxy Consul
  2. Why do we monitor? • Alerts • Dashboards • Debugging

    • Experiments • Long-term trends
  3. Rate Errors Duration Focussed on services Useful proxy of user

    happiness Good indication of service level Weak for predicting problems
  4. Utilisation Saturation Errors Focussed on resources Good for: • predicting

    problems • capacity planning • debugging outages Weak correlation with user experience
  5. Service Level * Service Level Indicators a.k.a. Metrics Service Level

    Objectives • Approved by stakeholders • Realistic (achievable) • Have consequences • Are continuously refined Service Level Agreement contractual form of SLOs
  6. Error budget & policy Error budget = 100% - SLO

    Error budget policy defines what to do when the budget is exhausted, e.g. • Stopping new features • Shifting priority to bug fixing • Assigning more resources • Relaxing SLO
  7. Alerting rules Only one alert per problem Only if it’s

    urgent Only if it’s actionable Only if it requires human intelligence
  8. Alerting rules - alert: DiskIsAlmostFull expr: node_filesystem_avail / node_filesystem_size <

    0.2 for: 10m labels: severity: normal annotations: description: | '{{ $labels.instance }} free disk space is < 0.2 (current value: {{ $value }})'
  9. Alerting rules - alert: CpuCreditsWillFinish expr: predict_linear(cpu_credits[1h], 2 * 3600)

    < 0 for: 5m labels: severity: medium annotations: description: | Credits for instance {{ $labels.instance }} are predicted to finish in 2 hours.
  10. Alerting rules - alert: HighErrorRate expr: slo_errors_per_request:ratio_rate10m >= 0.001 -

    record: slo_errors_per_request:ratio_rate10m expr: sum(rate(slo_errors[10m])) / sum(rate(slo_requests[10m]))
  11. Alert + webhook = awesome routes: - match: alertname: CeleryStuck

    receiver: restart_celery receivers: - name: restart_celery url: https://your.alert.receiver/endpoint