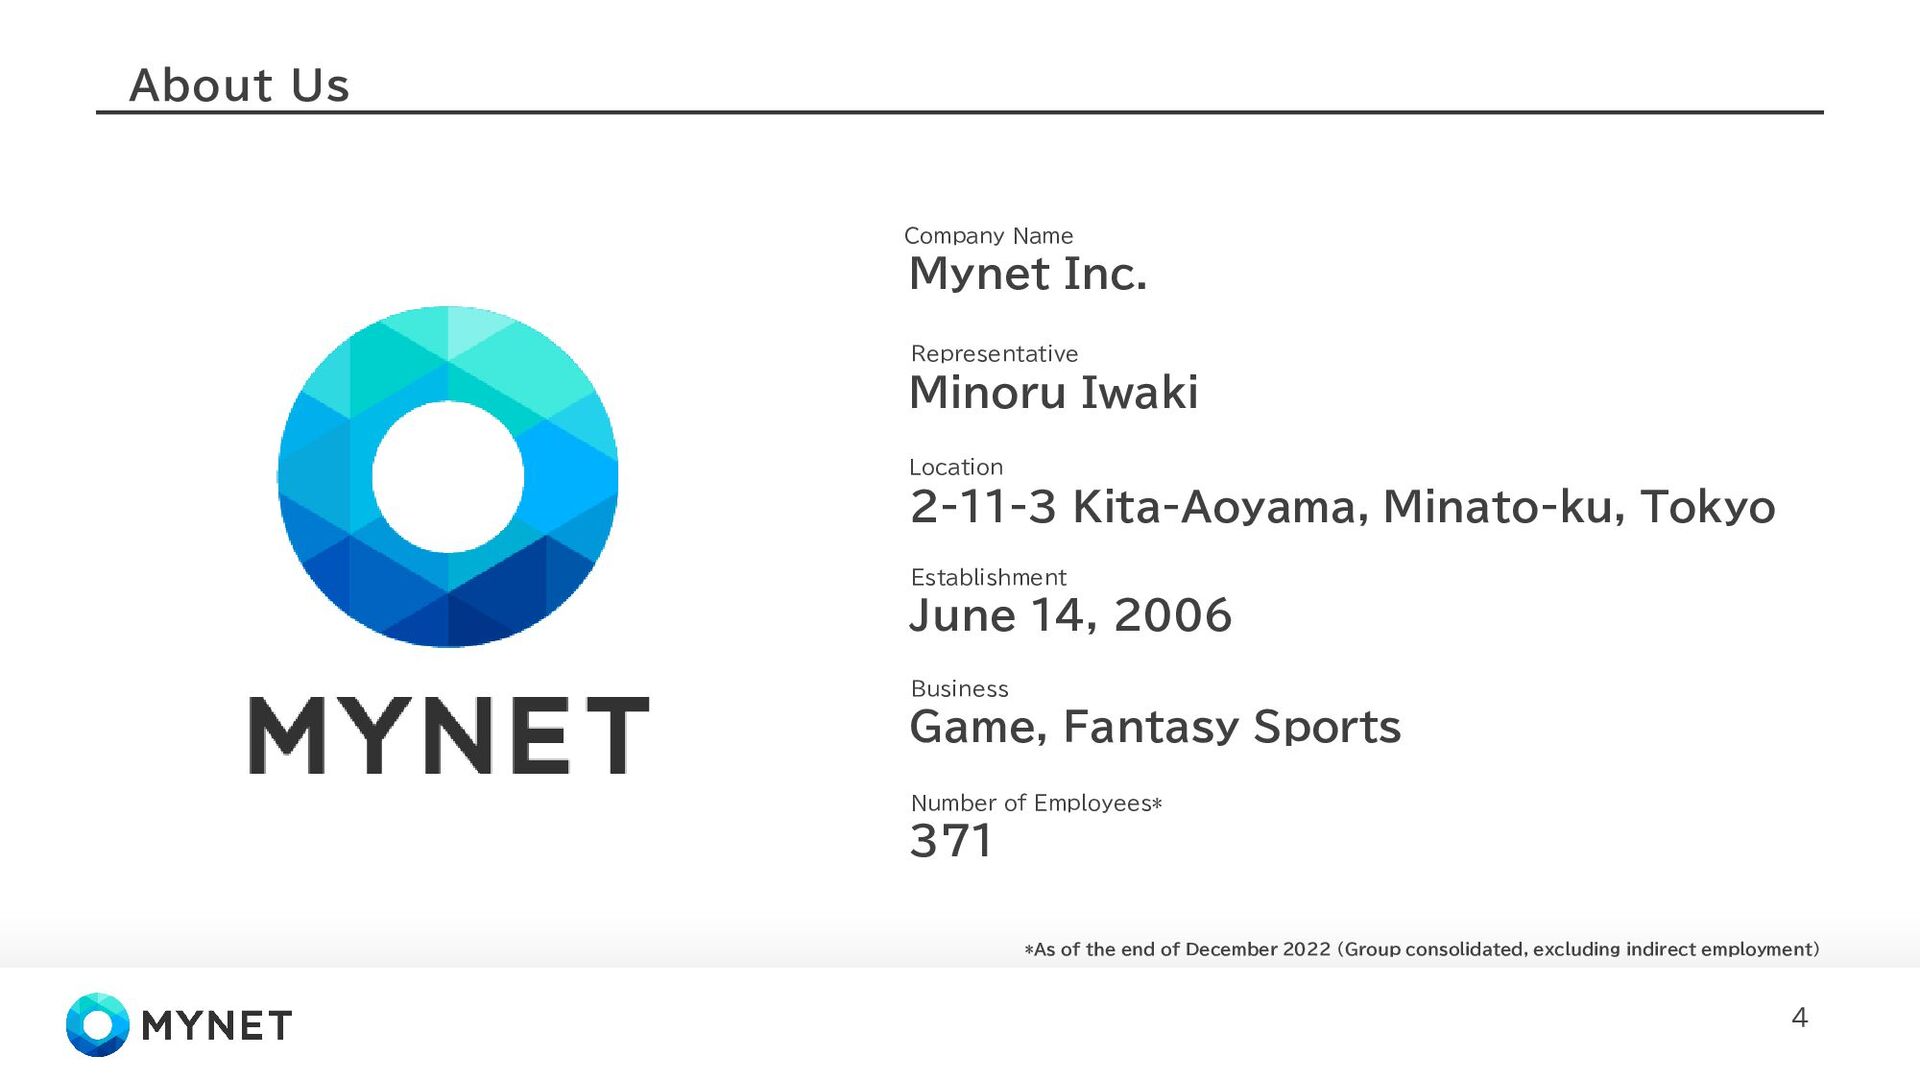
Minoru Iwaki Location 2-11-3 Kita-Aoyama, Minato-ku, Tokyo Establishment June 14, 2006 Business Game Business Domain Game Business: Secondary, Talent Matching, Development Solutions New Business : Sports Contents, Other Industries Employee Count* 262 *As of December 31, 2025 Key Growth Areas are underlined
daily entertainment is an essential part of life. Mynet is an entertainment company that brings color and excitement to people's daily lives through games. Mid-term Vision GATE26 – NEXT LEVEL By 2026, Mynet will expand its diversity as a gaming and entertainment company. Mynet is committed to expanding its presence across geographies, platforms, and industries until 2026.
services (Talent Matching/Dev) Offering unique services: Fantasy Sports & dev-integrated consulting Game Business New Business End-to-end strategy and execution support Sports Contents Development and operation of fantasy sports Talent Matching, Development Solutions Responding to diverse needs within the game industry Secondary Long-term management of game titles with proprietary know-how
to Profitability 2024-2025 Growth Driver Creation / Stabilization of Revenue Base 2026- Transition to Regrowth Phase Divestment of unprofitable businesses Optimization of company-wide costs Building a stable revenue base (Efficiency and investment management) Selection and concentration in new business areas Strategic investment in Key Growth Areas for the regrowth phase Business expansion and monetization of new businesses Flexible capital policy for the next growth stage (Optimal allocation including growth investment and shareholder returns) Shifting from "Cost Reform" to "Growth Driver Creation," entering Regrowth Phase from FY2026
Key Growth Areas and transitioning to full-scale monetization Strategic Investment Policy Business Strategy for Key Growth Areas Sports Contents Talent Matching Other Industries Development Solutions Profits generated from the Secondary Sector Key Growth Areas with high potential Business expansion through multi-sports rollout Increasing project volume through enhanced sales structures. Evolution into a hybrid "Strategic Consulting x BPO" model Expanding business operations based on projects secured in 2025
improved performance through state-of-the-art tech, and cost optimization via comprehensive FinOps Security Reinforcement Cost Optimization through FinOps Strengthening security infrastructure for comprehensive multi-cloud coverage Increasingly sophisticated and diverse cyber threats Minimizing service downtime and failure risks Status Response Established sustainable cost optimization through historical strategic tech selection performance 1.8x cost reduction 50 % 2021 2025 100%
foundation for flexible execution of future measures by optimizing capital structure Financial Base Setup Optimizing Capital Allocation Optimizing Capital Structure and Enhancing Financial Flexibility Elevating corporate value to the next level by driving a virtuous cycle of growth and returns. Shareholder returns Strategic investment × Step 1 Step 2 Financial base for agile investments & shareholder returns Securing Distributable Amount Purpose Objectives
strengths in Key Growth Areas. Secondary Key Growth Areas Sports Contents Sales Development Operating Strengths Other Industries Talent Matching Development Solutions Key Growth Areas
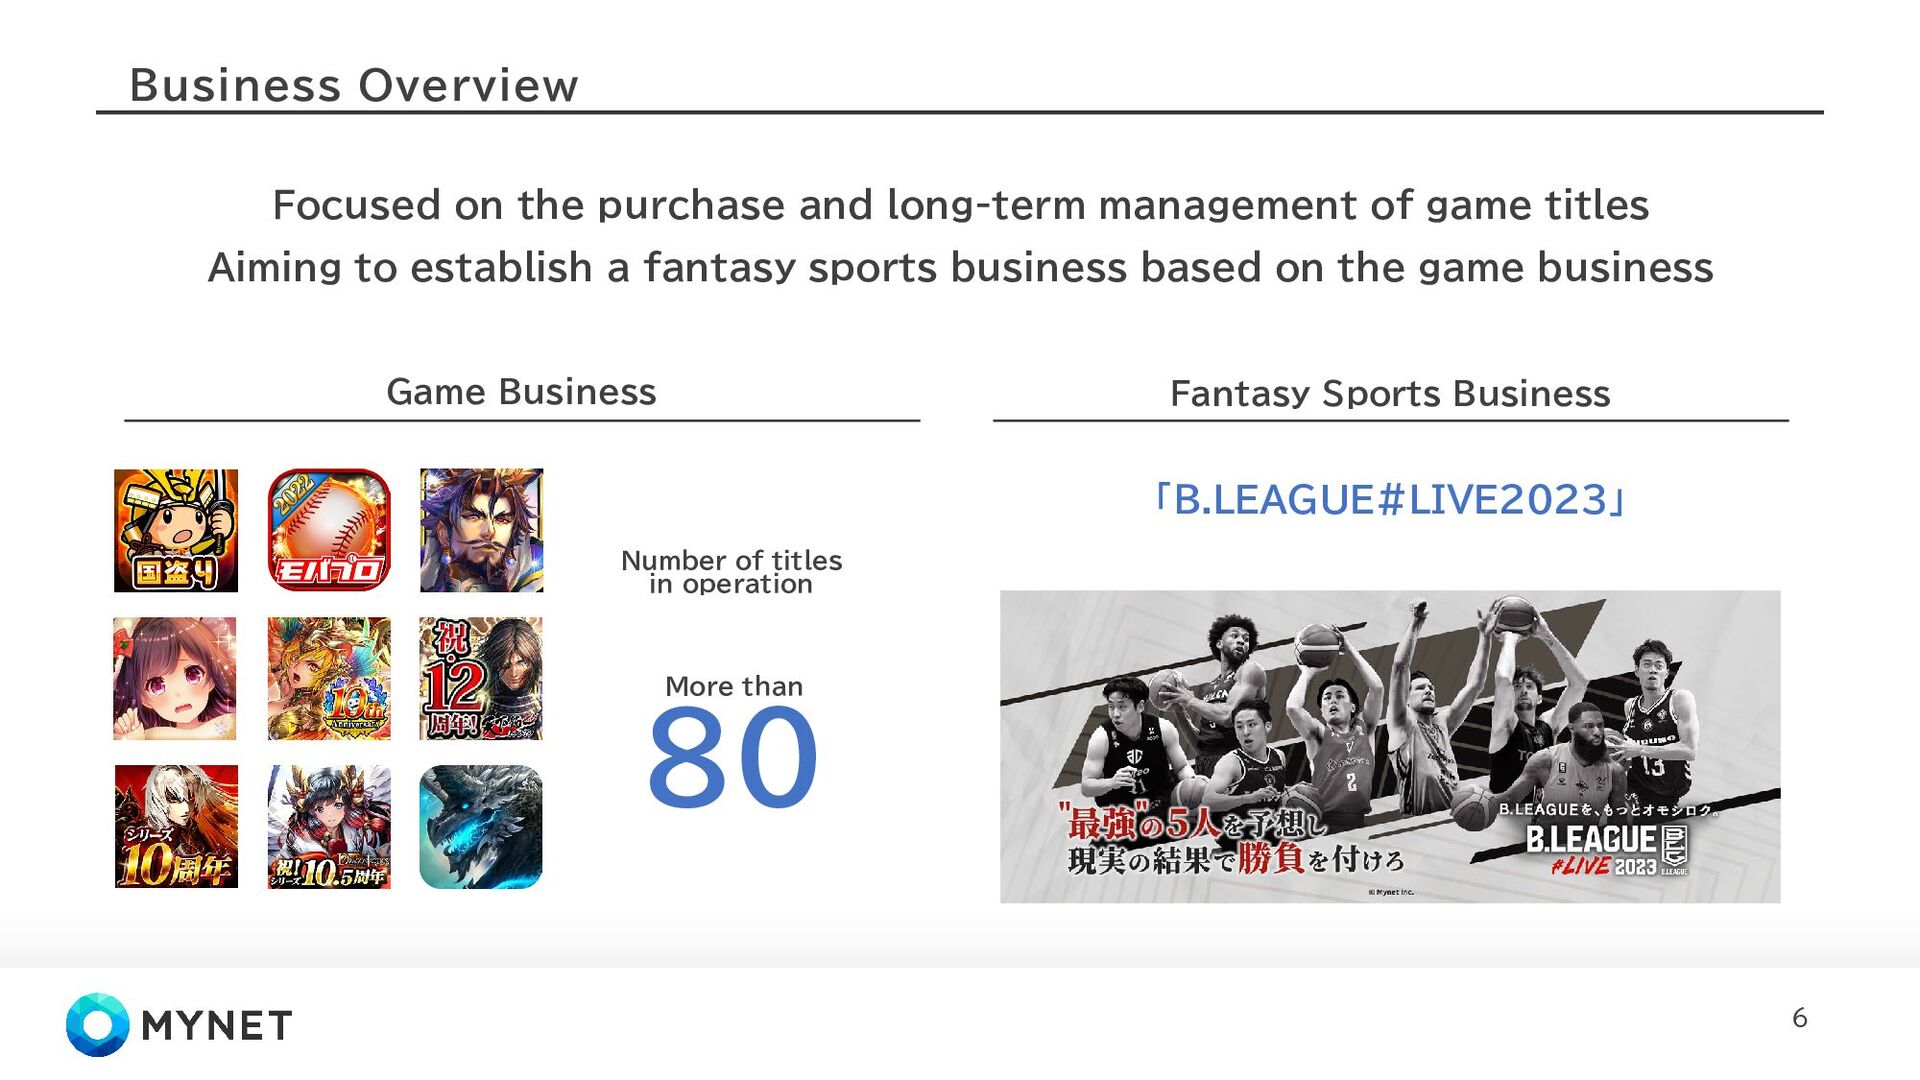
and product evolution. Competitiveness Business Development 11 Three Strengths Services Partnership Development and Operations League / Club Official Over 80 titles managed; numerous sports content development projects Trading cards, fantasy sports, and various other fan engagement tools Expansion of Target Sports Product Evolution and Expansion 1 2 3 Key Growth Areas
real athletes Score players' performances in real-life games and compete for points 12 Actual matches 2 Actual Match 3 Score Fixed 1 Player Selection Fantasy Sports 1 Player Selection 2 Actual Match 3 Score Fixed Linking of latest stats data Player Results Team Results Appearance Information Team Information Player Information stats data* *Data on team winning percentage and player performance, etc. *The key is to create a virtual team by predicting which players will perform well. Key Growth Areas
size is expanding year after year This growth is led by fantasy sports, especially in North America 13 Global Market Major Players (Unit: Billion USD) Source:Mordor Intelligence 2023 37.2B 2030 71.2B Key Growth Areas
Supporting client transformation from strategy to execution. Point 1 Consulting Experienced strategic consultant Point 2 BPO IT infrastructure support (Servers/PCs) for strategy execution Point 3 New Tech Supporting the latest technology 14 Key Growth Areas
gaming industry through talent matching and development solutions 01 02 03 Diverse needs within the gaming industry Our strengths in operation and development Solving Issues Key Growth Areas
Kita-Aoyama, Minato-ku, Tokyo President and CEO Minoru Iwaki Established April 1, 2024 Business Areas Sports Contents Company Name Digon Inc. Location 2-11-3 Kita-Aoyama, Minato-ku, Tokyo President and CEO Minoru Iwaki Established February 6, 2018 Business Areas Other Industries Company Name Mynet Games Inc. Location 2-11-3 Kita-Aoyama, Minato-ku, Tokyo President and CEO Minoru Iwaki Established November 8, 2007 Business Areas Secondary, Talent Matching, Development Solutions
Yen mobile game market. Mobile Game Market Size Major Markets by Country Domestic Mobile Game Market Trends 4.02 1.91 1.66 0.80 0.38 Secondary US China Japan Korea Taiwan 1.73 1.74 1.66 2023 2025 2024 (Unit: Trillion yen) Source : FAMITSU Mobile Game HAKUSHO 2026 Source : FAMITSU Mobile Game HAKUSHO 2026 (Unit: Trillion yen)
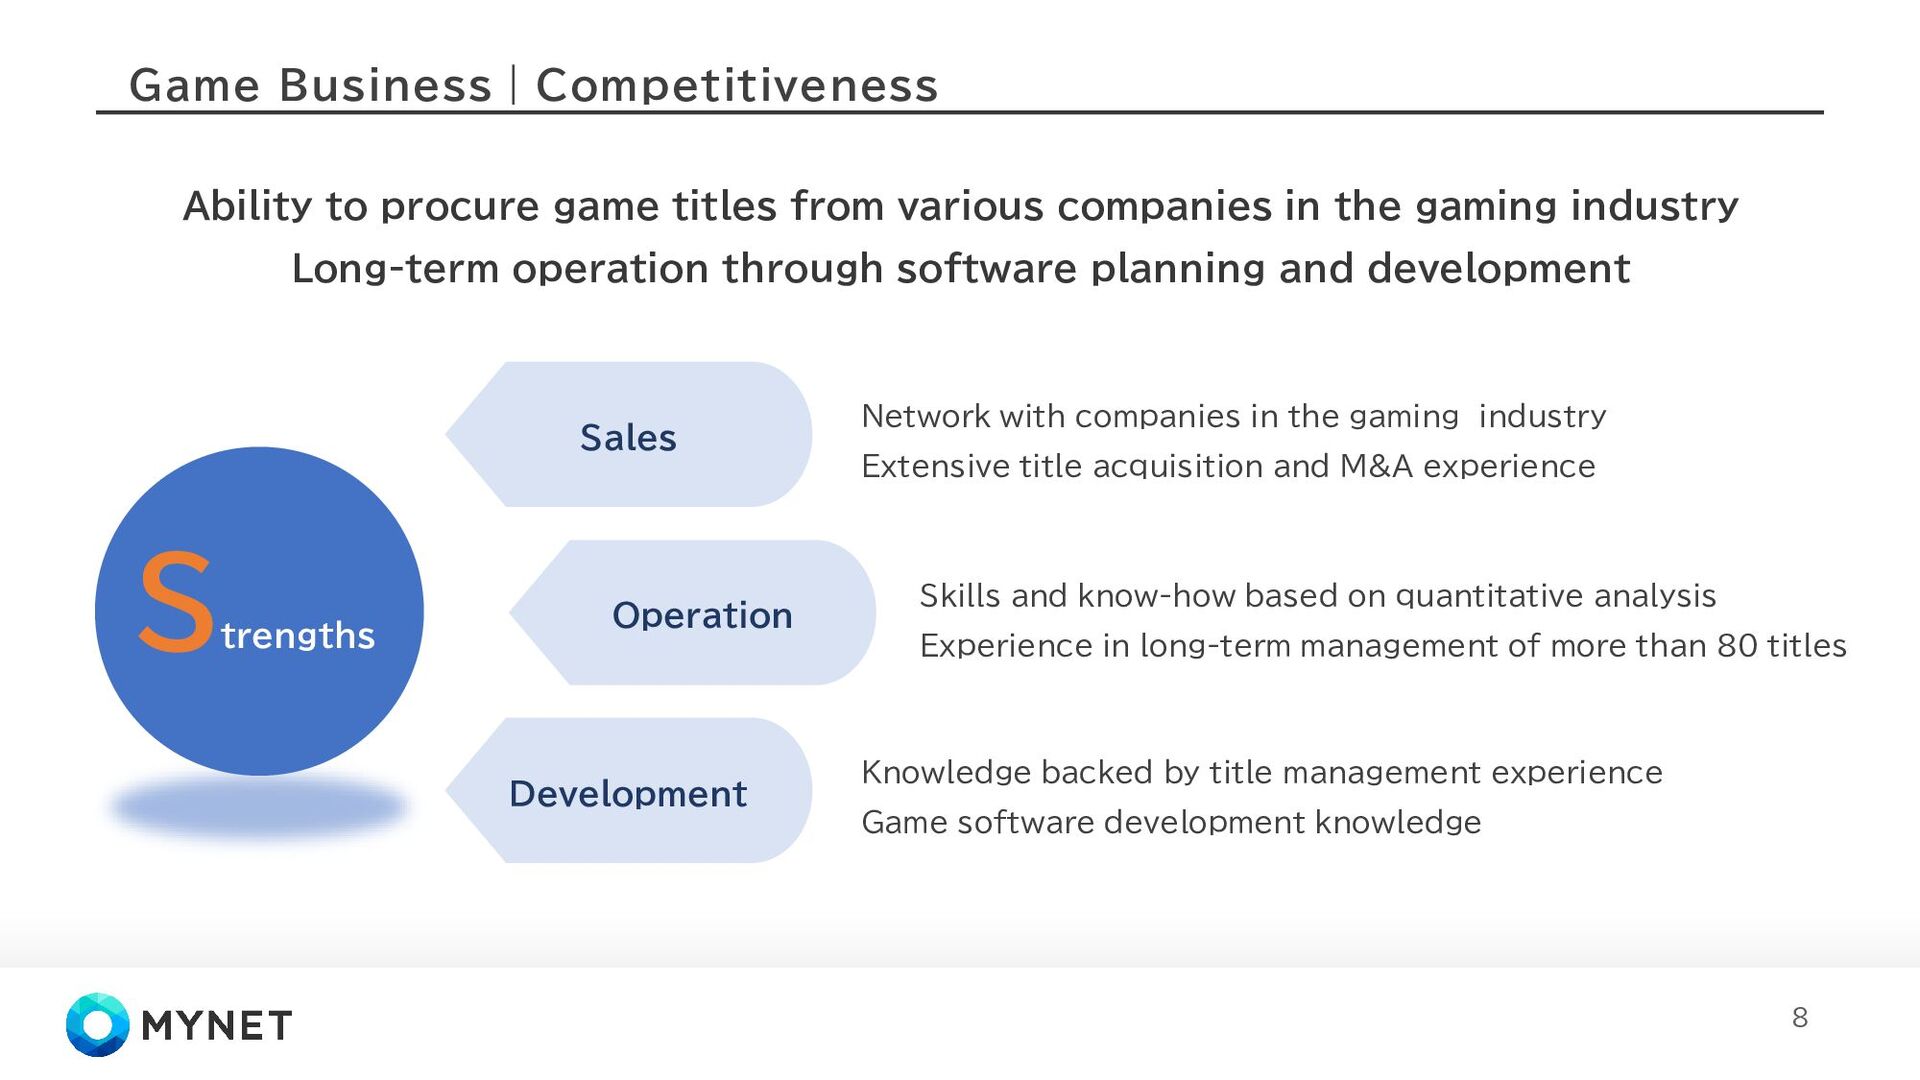
operational, and development capabilities Network with companies in the gaming industry Extensive title acquisition and M&A experience Sales Development Operation S trengths Skills and know-how based on quantitative analysis Experience in long-term management of more than 80 titles Knowledge backed by title management experience Game software development knowledge Secondary
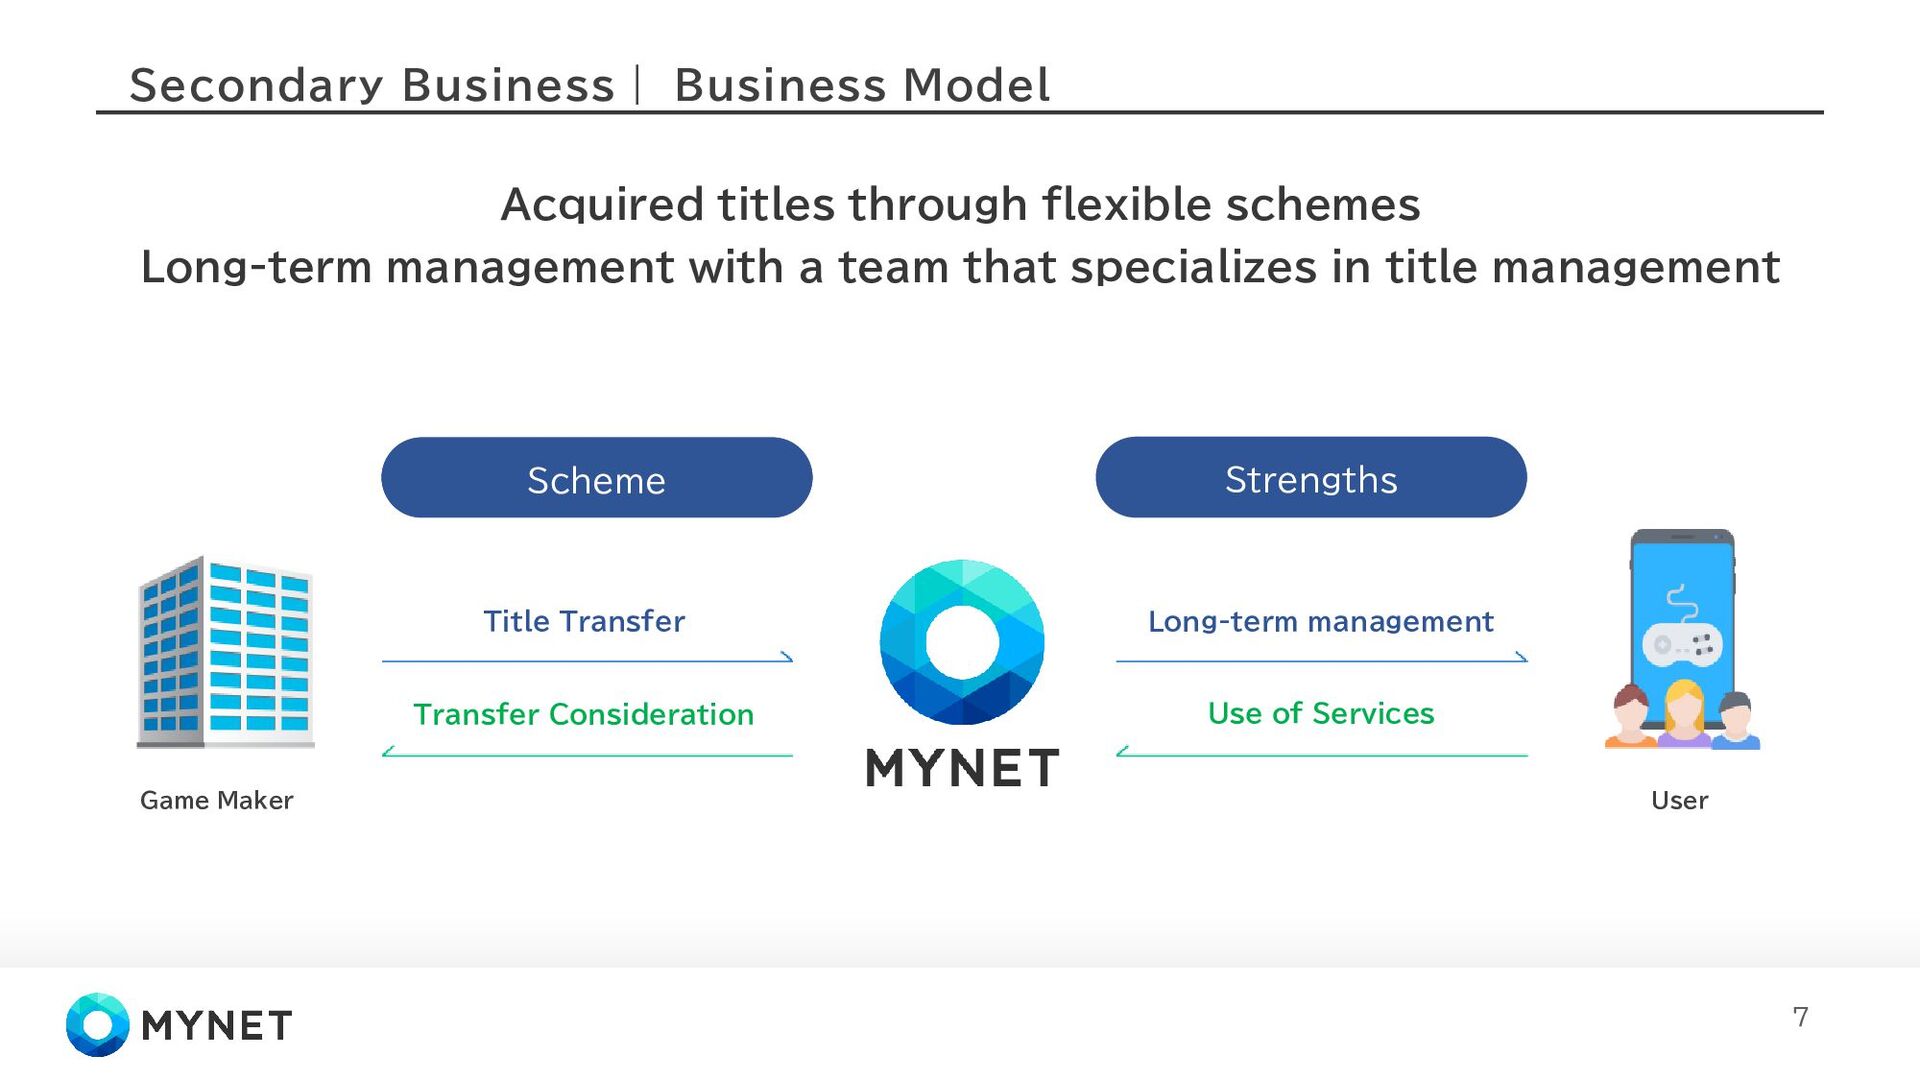
a team that specializes in title management Scheme Strengths Game Maker User Long-term management Use of Services Transfer Consideration Title Transfer Secondary
returns Secured approx. 700 million yen for returns through financial restructuring; accelerating preparations for flexible execution. 1 2 3 Strong momentum for "J.LEAGUE FANTASY CARD" Steady growth in both pack revenue and marketplace transactions during this strategic investment phase. BPO in Other Industries sector becoming a stable revenue pillar Achieved significant growth with revenue reaching 1.7x year-on-year. 4 Secondary sector remains resilient with stable profits Outperformed revenue plan at 101%. Maintaining a virtuous cycle of generating investment capital for Key Growth Areas.
2026 Q1 YoY YoY% Revenue 2,130 2,003 (126) (5.9%) Operating Income 147 (101) (248) - Ordinary Income 114 (115) (229) - Net Income 96 (126) (223) - Revenue remained consistent year-on-year Strategic investments were executed to drive growth in the sports contents sector
Impacted by a temporary rise in advertising and development costs Progress against initial forecasts 22.3% On track 9,000Million yen On track On track 390Million yen 345Million yen 285Million yen ±0 Revenue Operating Income Net Income Ordinary Income 2,003 Million yen (101) Million yen (126) Million yen (115) Million yen Initial Forecast 100%
a distributable amount as capital; examining shareholder returns within the current fiscal year. 28 Review Progress Q4 Q3 Q4 Q1 Q2 Q3 2026 2025 Strengthening the Financial Foundation Target execution resolution based on market conditions Formulation of Policy Status of Financial Foundation Setup Approx ¥ 700M Securing distributable surplus Strategic Capital Allocation Framework Completed Shareholder Returns
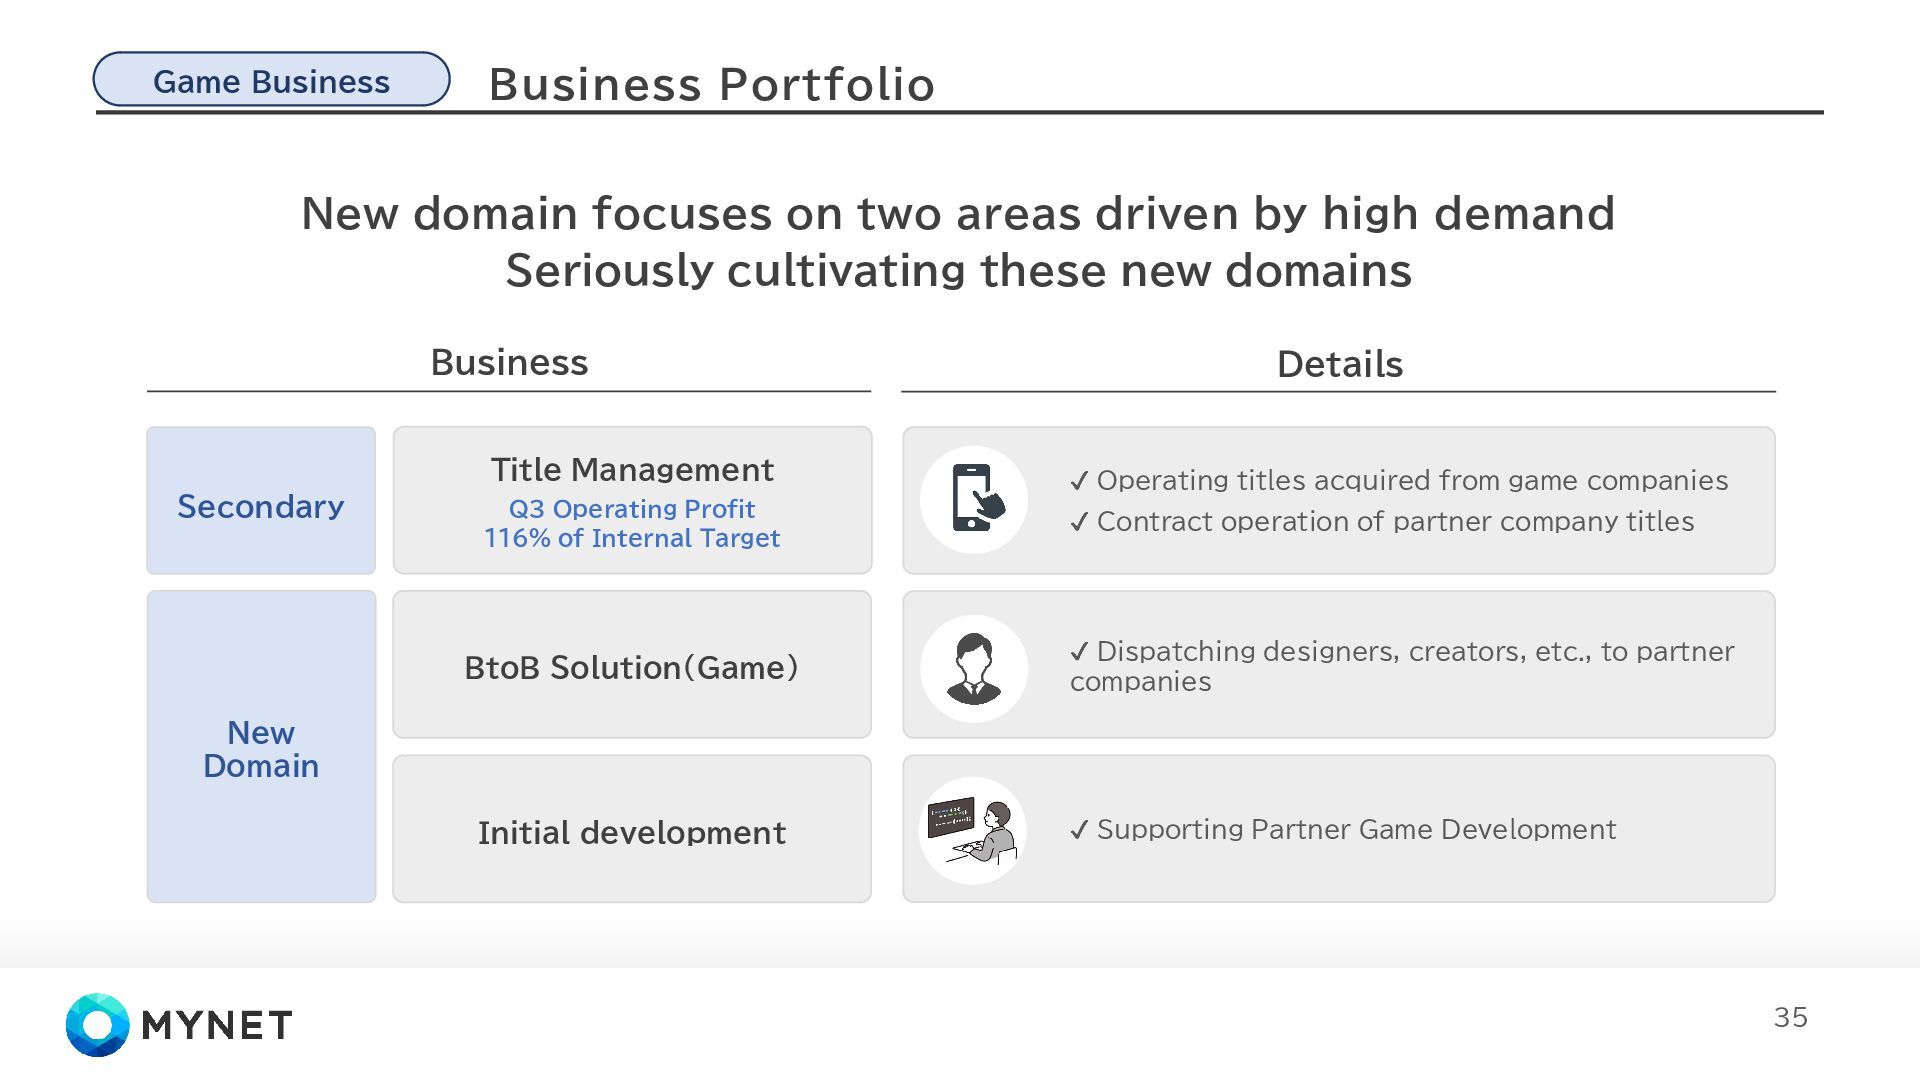
Growth Areas, anchored by secondary sector revenue Game Business New Business Secondary New Domain Sports DX BtoB Solutions Secondary Development Solutions Sports Contents Other Industries Talent Matching Game Business New Business FY2025 FY2026 Key Growth Areas
Mar Apr Significant GMV growth in primary & secondary markets in tandem All activity KPIs—including card merging and physical conversions—performed strongly *As of May 11, 2026 May (As of May 11) ▪Primary Market: Cumulative Pack Revenue ▪Secondary Market: Cumulative Marketplace GMV 56% 44% Established a self-sustaining ecosystem where both markets mutually drive growth. Key KPIs 1,610 K Paid Pack Sales Volume 511 K Marketplace Trades 877 K Synthesis / Evolutions 226 K Physical Card Requests 2,400 K Fantasy Team Entries 3,060 K Campaign Entries Key Growth Areas
Service Model Elevating "Digital Ownership" to "Tangible Assets" Physical Card Delivery Launching Soon A new frontier blending digital and physical trading card experiences Home delivery of serial-numbered physical cards Multidimensional Engagement High-Quality Rare Collectibles Fantasy Game: Linked to real-world match performance Vibrant Community: Active in-game secondary marketplace Hybrid Utility: Seamless physical conversion & automated delivery Premium design: High-end visual appeal Rigorous management: Strict control over rarity Superior print quality: Verifiable premium scarcity Key Growth Areas
out faster than expected Expanded lineup features first autographs and J2/J3 players initial revenue outpaced Edition 1 SOLD OUT SOLD OUT SOLD OUT SOLD OUT SOLD OUT SOLD OUT SOLD OUT SOLD OUT SOLD OUT SOLD OUT Edition 2 Launched - Introducing autographs, jerseys, and 1-of-1 case hits - J2/J3 players debut in All-Star lineup ahead of the 26-27 season. Key Growth Areas
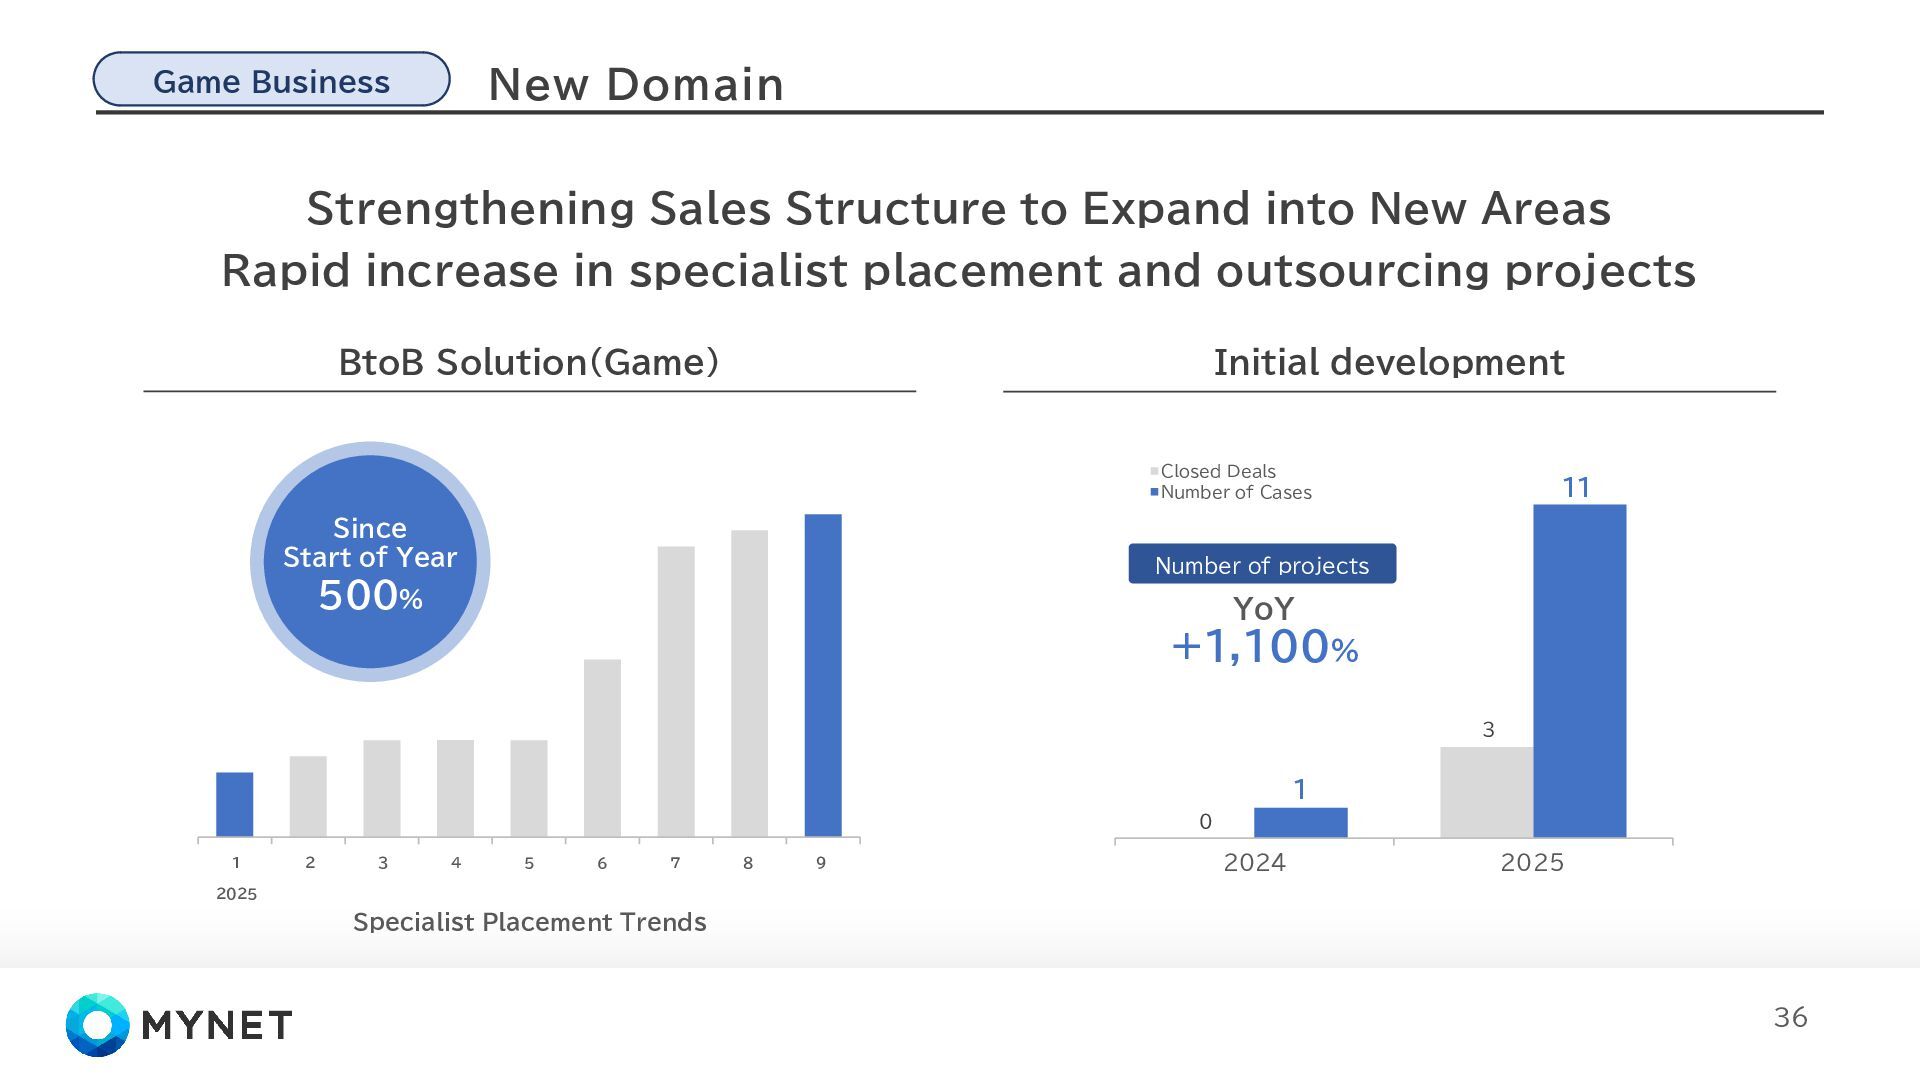
Talent Matching: Scaled 10x YoY via expert team integration Dev Solutions: Expanded contract projects in 3D, VR, & porting 4 7 12 11 43.6 2026 2025 Q1 Q4 Q3 Q2 Q1 10 x YoY 3D Advanced 3D graphics & modeling development VR Immersive VR content development leveraging spatial computing technology Porting Multi-platform optimization & porting development Expanding contract projects by meeting diverse development needs. Development Solutions (Unit: Million yen) Key Growth Areas
new acquisition & operations Solid revenue base reliably generating growth investment capital Secondary Operating Income Revenue 101% 108% Q1 Q2 Q3 Q4 Q1 2025 2026 Plan Actual Plan Actual Stable Revenue Maintenance Both revenue and operating profit outperformed internal plans.
presentation contain so-called “forward-looking statements.” They are based on current expectations, forecasts, and assumptions that involve risks and uncertainties that could cause actual results to differ materially from those in the forward-looking statements. These risks and uncertainties include general industry and market conditions, and general national and international economic conditions, such as interest rate and currency exchange fluctuations. We undertake no obligation to update or revise any forward-looking statements contained in this presentation, whether as a result of new information, future events, or otherwise. Inquiries In order to ensure fair and accurate responses, we do not respond to IR-related inquiries by telephone. Please use the form at the following URL when making inquiries. Contact Form: https://www.mynet.co.jp/ir/contact