Upgrade to Pro — share decks privately, control downloads, hide ads and more …

biz com 07

biz com 07

visual aids

najibahmad

July 02, 2014
Tweet

More Decks by najibahmad

Other Decks in Education

Transcript

  1. Purposes of Visual Aids •  Improve clarity of complex ideas

    •  Improve retention of information •  Provide interest and variety Ch 12 - 2
  2. Using Visual Aids in Reports • Visual aids help communicate ideas.

    • Each should have a specific purpose. • Use and placement enhance the effectiveness of your communication. Ch 12 - 3
  3. Developing Visual Aids • Tables •  Word tables •  Numeric data

    tables • Charts •  Column charts and bar charts •  Line charts •  Pie charts •  Doughnut charts Ch 12 - 5
  4. Planning and Interpreting Visual Displays •  Planning – use visual

    aids and multimedia to support a message •  Ethical considerations •  Other planning considerations – color and contrast Ch 12 - 13
  5. To Improve Retention of Information •  Visual aids promote retention

    of information. •  Slides and transparencies summarize main points. •  Handouts promote note taking. •  Physical objects appeal to vision and touch. Ch 12 - 15
  6. Multimedia Presentations • Include several types of media—visual, sound, action • 

    Computer presentations •  Audio •  Transitions—dissolves, fades, swipes •  Computer links •  Websites •  Podcasts •  Blogs •  Video clips Ch 12 - 16
  7. To Improve Clarity of Complex Ideas •  Tables and graph

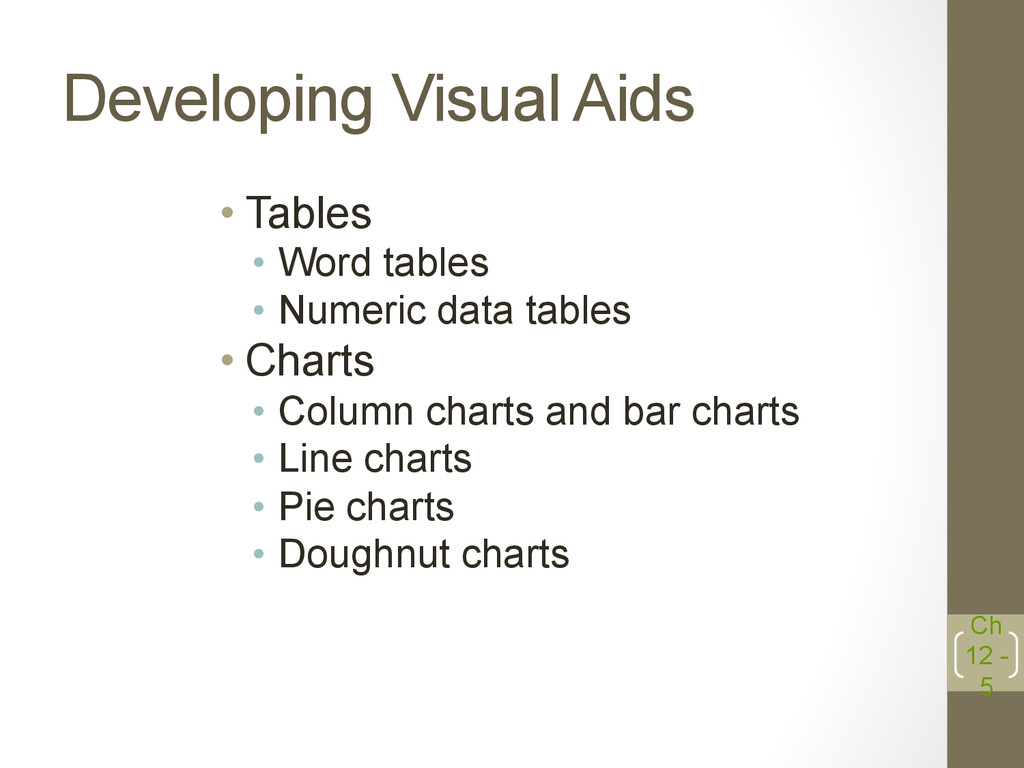
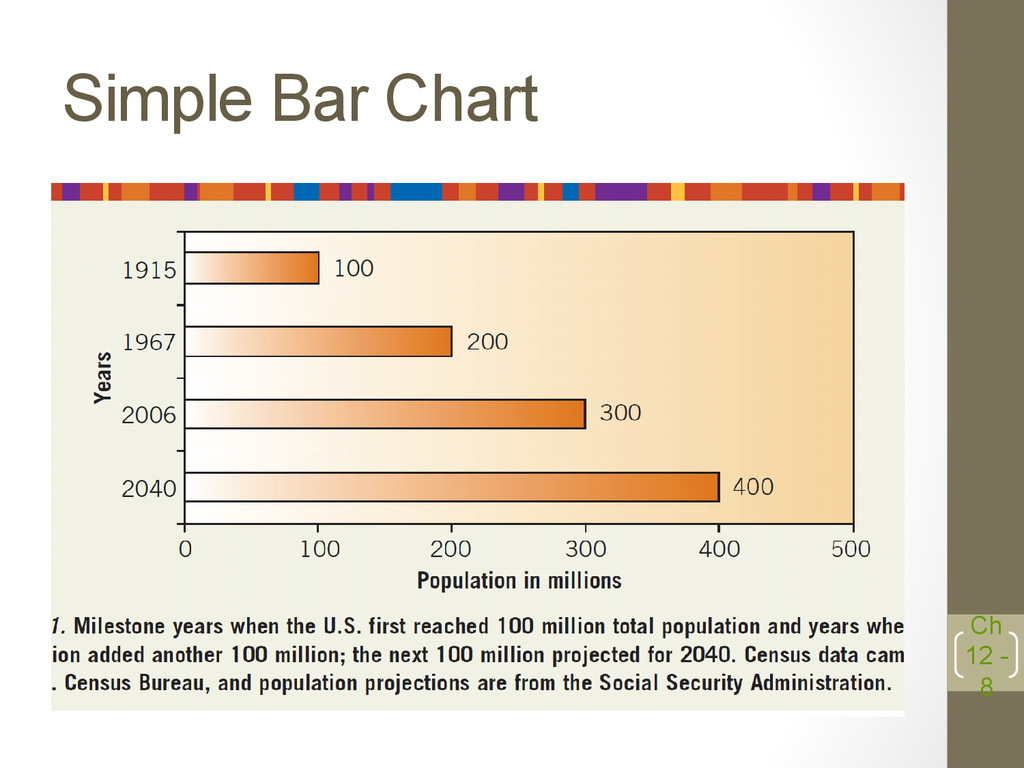
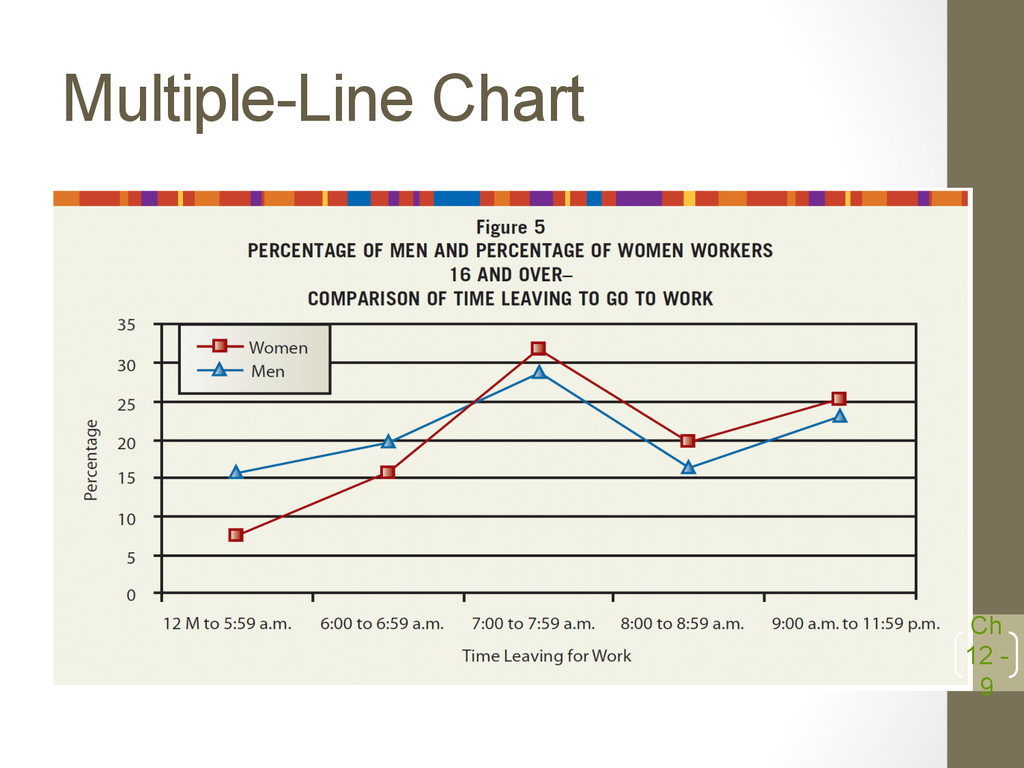
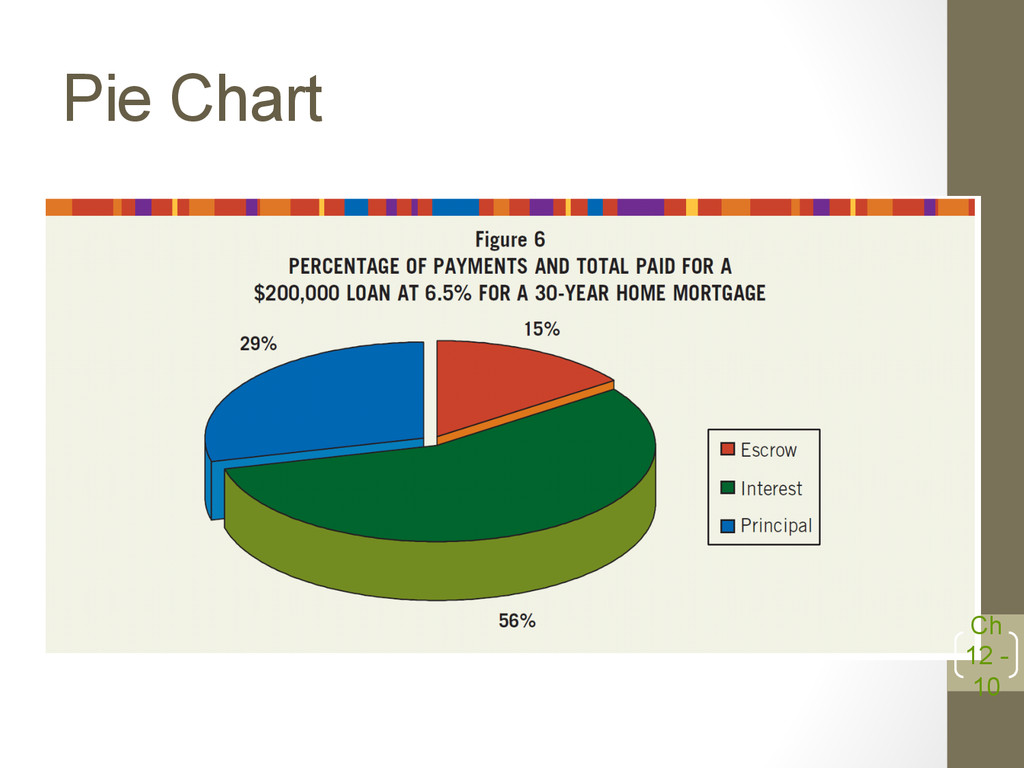
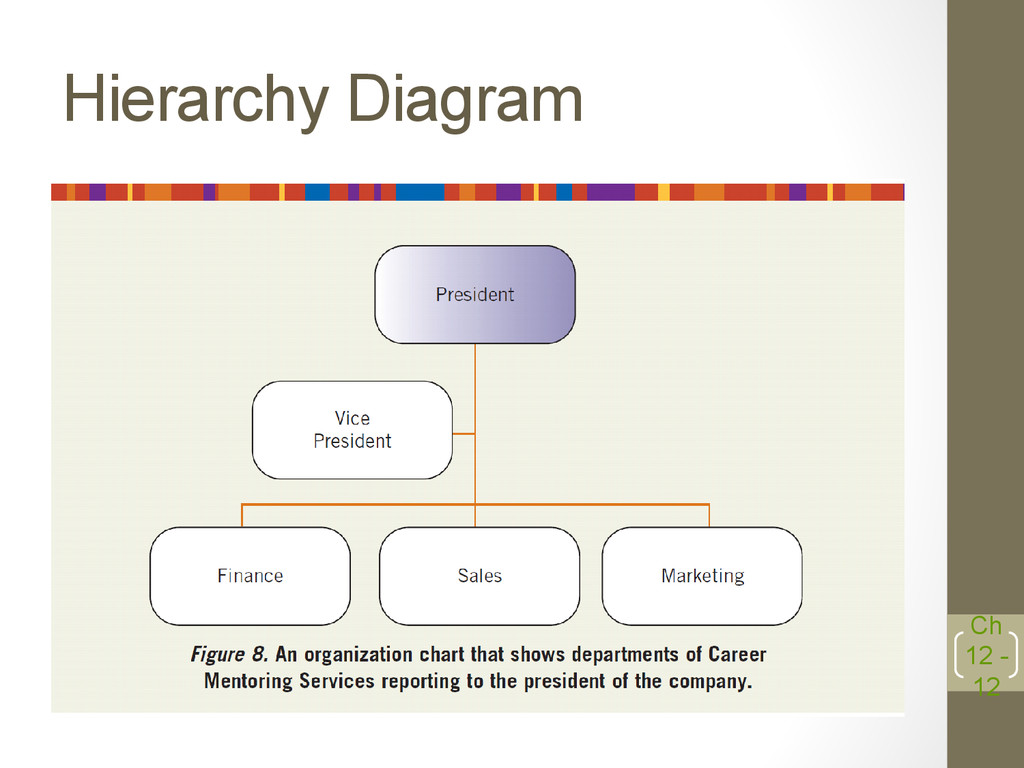
    charts make data comparison easy. Tables present complex numeric data better than charts. •  Hierarchy diagrams present relationships; process diagrams illustrate steps for procedures •  Pie and doughnut charts show relationships of parts to the whole. •  Bar charts compare value variations, different data types at one time, or the same data type over time. •  Multiple-bar charts represent more than one value at one time; stacked-bar charts present values of each part within a variable. Ch 12 - 17
  8. To Create Interest and Improve Retention of Information • Illustrations, audio,

    video, web links, and podcasts emphasize detail and provide variety. • Visuals added to text or used for oral presentations create interest and promote retention of information. • Major points stated briefly and clearly on slides or transparencies aid retention. • Handouts promote note taking and make information available for the future. Ch 12 - 18