Upgrade to Pro
— share decks privately, control downloads, hide ads and more …
Speaker Deck
Features
Speaker Deck
PRO
Sign in
Sign up for free
Search
Search
Measuring Web Performance: Metrics & Tools
Search
Michael Geers
March 25, 2017
Technology
760
2
Share
Embed
Copy iframe code
Copy JS code
Copy link
Start on current slide
Measuring Web Performance: Metrics & Tools
The talk was presented on JSUnconf.eu 2017 in Hamburg
Michael Geers
March 25, 2017
More Decks by Michael Geers
See All by Michael Geers
Bits & Bäume x evcc - Energie zuhause smart nutzen
naltatis
0
16
Was macht AI mit dem Open Source?
naltatis
0
72
More Hearts than Stars: Smart Charging & Community Funding
naltatis
0
380
Micro Frontends - True End-to-End Decoupling in Practice
naltatis
1
300
evcc: Sonne, Autos & dynamische Stromtarife
naltatis
0
1.4k
Tractor Store 2.0 - TodoMVC for Micro Frontends
naltatis
0
410
Die nächste Framework Generation? Was kommt nach React, Vue.js und Angular?
naltatis
0
300
evcc – Open Source Sonne tanken
naltatis
0
2.3k
How Deep Is Your Micro Frontend
naltatis
2
980
Other Decks in Technology
See All in Technology
そのドキュメント、自動化しませんか?
yuksew
1
390
変更し続けられるシステムをどう保つか — AI時代のSSoTという設計原則
kawauso
1
990
設計レビューとAIハーネスで向き合う AIが生み出した新しいボトルネックの対処法 / Design Reviews and AI Harnesses Against New Bottlenecks Created by AI
nstock
3
390
【公開用】AI_Dev_Ex2026_AI_登壇資料
matsuritechnologies
PRO
1
430
AI時代のPlaywright活用(システムテストを自動化する ー 実行エンジンにPla ywrightを選んだ理由)
ynisqa1988
2
900
シンガポールで登壇してきます
yama3133
0
340
AI、CDK と協働する Full TypeScript アプリケーション開発 / Full TypeScript Application with AI and CDK
geekplus_tech
2
450
PHPで作って学ぶリアルタイム音声対話AIとWebSocket入門 by ムナカタ
munakata
0
110
第67回コンピュータビジョン勉強会CVPR2026読会前編
tsukamotokenji
0
160
Oracle Exadata Database Service on Cloud@Customer X11M (ExaDB-C@C) サービス概要
oracle4engineer
PRO
2
8.5k
AI時代の開発生産性は、個人技からチーム設計へ
moongift
PRO
4
2.5k
AI時代の開発生産性を捉え直す — 経営と現場をつなぐ「開発組織のオブザーバビリティ」— / AI Dev Ex Conference 2026
tkyowa
1
1.2k
Featured
See All Featured
[RailsConf 2023 Opening Keynote] The Magic of Rails
eileencodes
31
10k
Sam Torres - BigQuery for SEOs
techseoconnect
PRO
0
440
The Cult of Friendly URLs
andyhume
79
7k
XXLCSS - How to scale CSS and keep your sanity
sugarenia
249
1.3M
4 Signs Your Business is Dying
shpigford
187
22k
The Curious Case for Waylosing
cassininazir
1
440
How to build an LLM SEO readiness audit: a practical framework
nmsamuel
1
810
Winning Ecommerce Organic Search in an AI Era - #searchnstuff2025
aleyda
1
2.1k
Connecting the Dots Between Site Speed, User Experience & Your Business [WebExpo 2025]
tammyeverts
11
970
Crafting Experiences
bethany
1
230
Highjacked: Video Game Concept Design
rkendrick25
PRO
1
410
実際に使うSQLの書き方 徹底解説 / pgcon21j-tutorial
soudai
PRO
201
75k
Transcript
MEASURING WEB PERFORMANCE Michael Geers @naltatis JSUnconf.eu 2017
WHY MEASURE?
WHAT TO MEASURE?
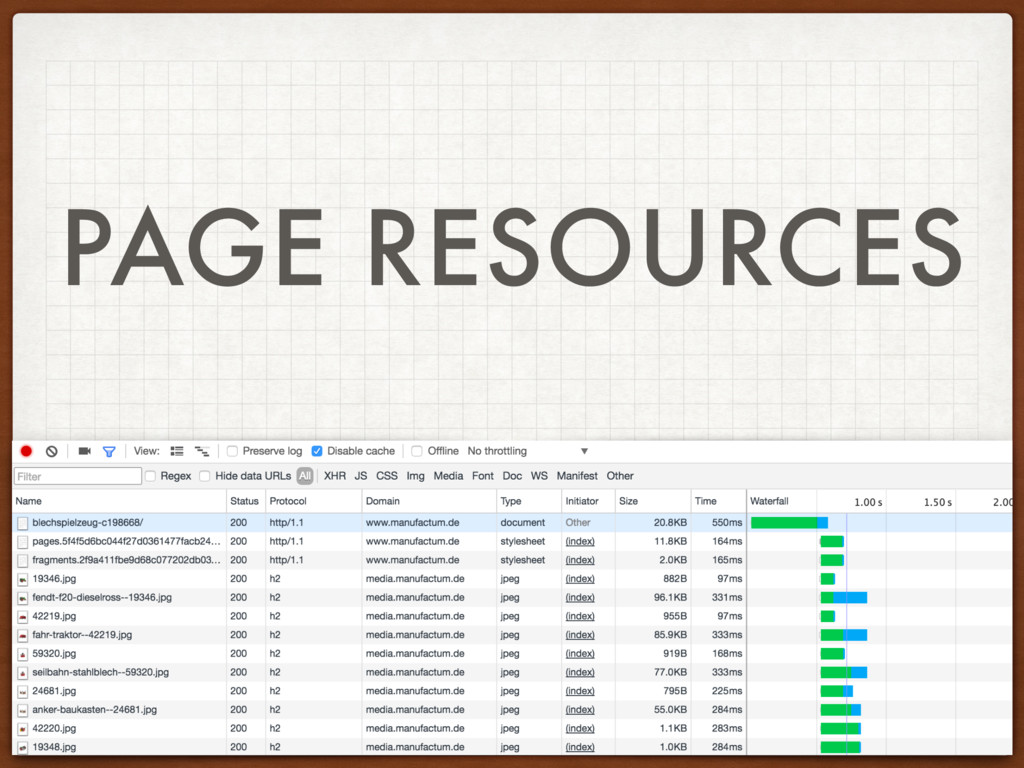
PAGE RESOURCES
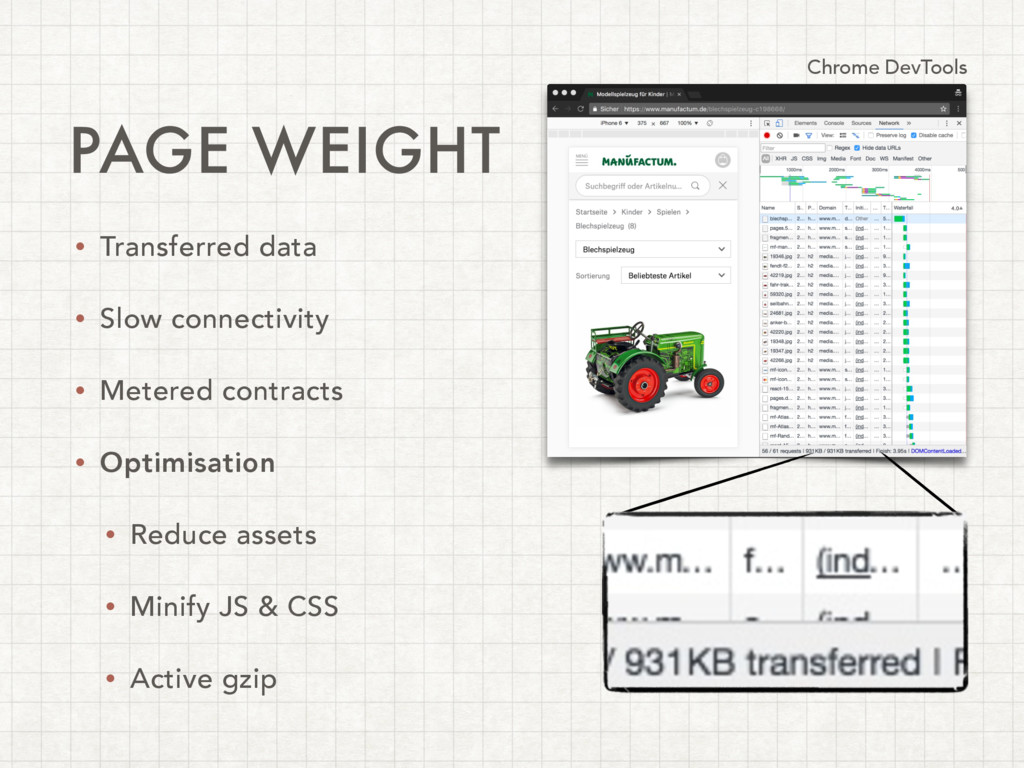
PAGE WEIGHT • Transferred data • Slow connectivity • Metered
contracts • Optimisation • Reduce assets • Minify JS & CSS • Active gzip Chrome DevTools
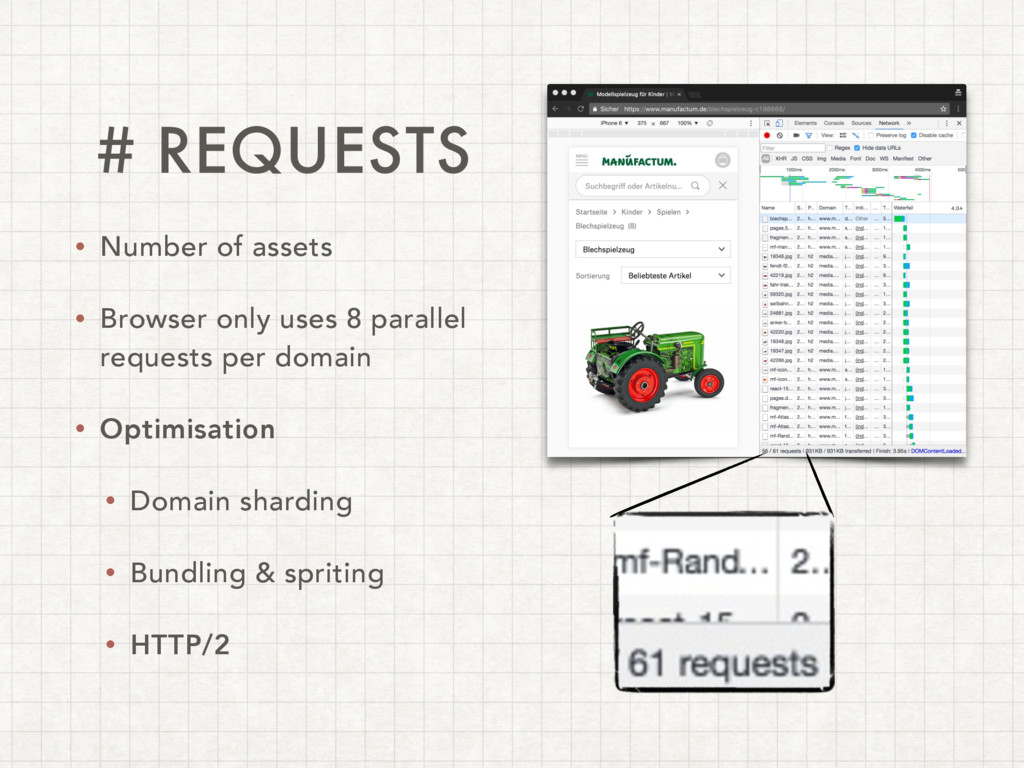
# REQUESTS • Number of assets • Browser only uses
8 parallel requests per domain • Optimisation • Domain sharding • Bundling & spriting • HTTP/2
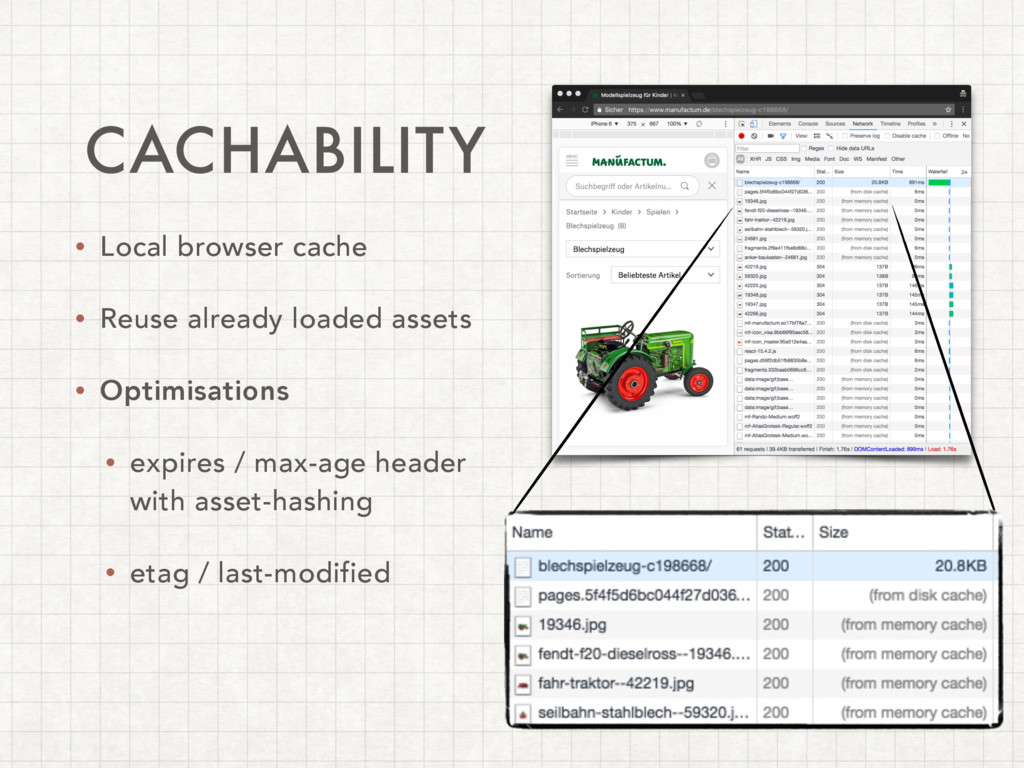
CACHABILITY • Local browser cache • Reuse already loaded assets
• Optimisations • expires / max-age header with asset-hashing • etag / last-modified
TIMINGS
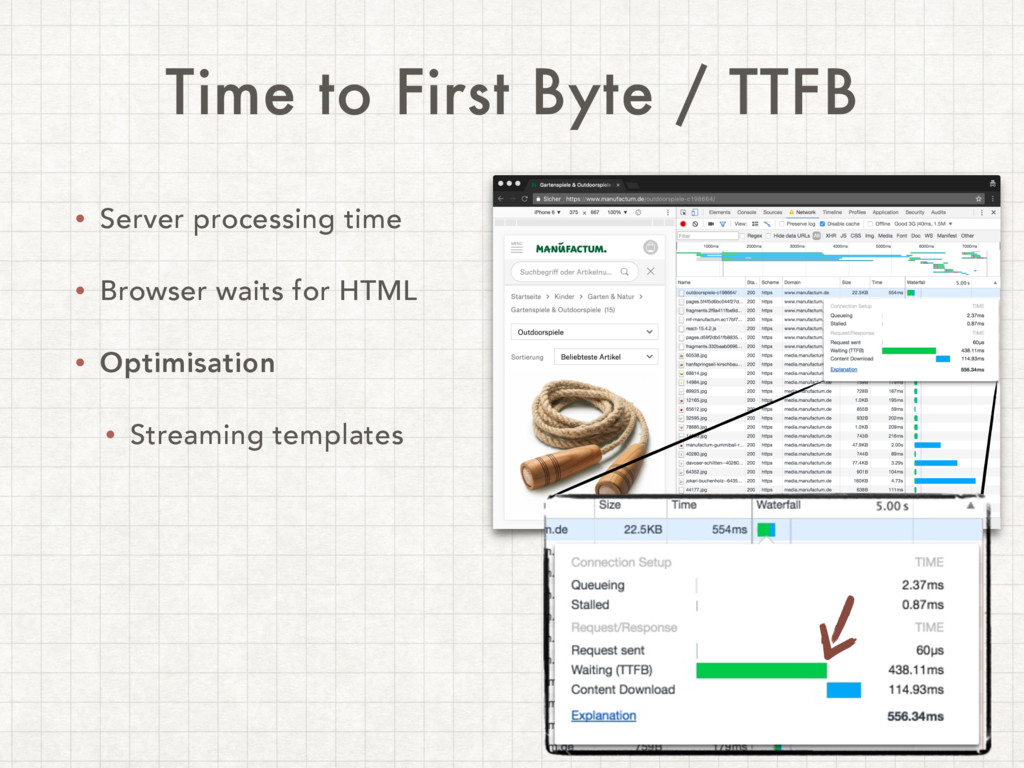
• Server processing time • Browser waits for HTML •
Optimisation • Streaming templates Time to First Byte / TTFB
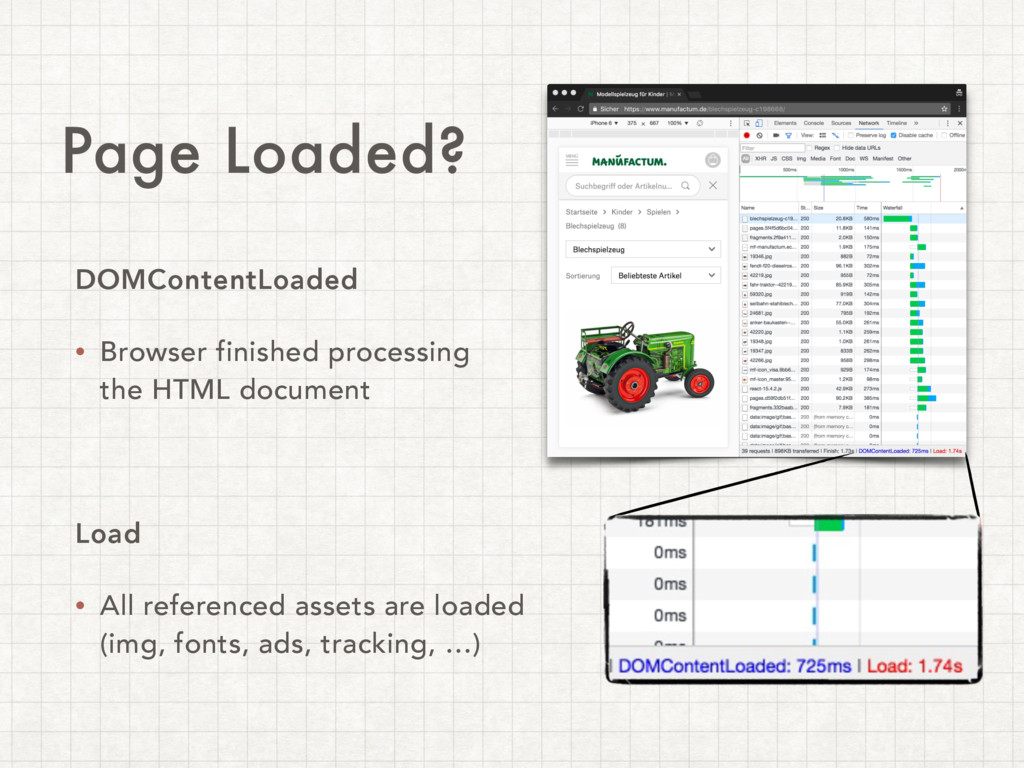
Page Loaded? DOMContentLoaded • Browser finished processing the HTML document
Load • All referenced assets are loaded (img, fonts, ads, tracking, …)
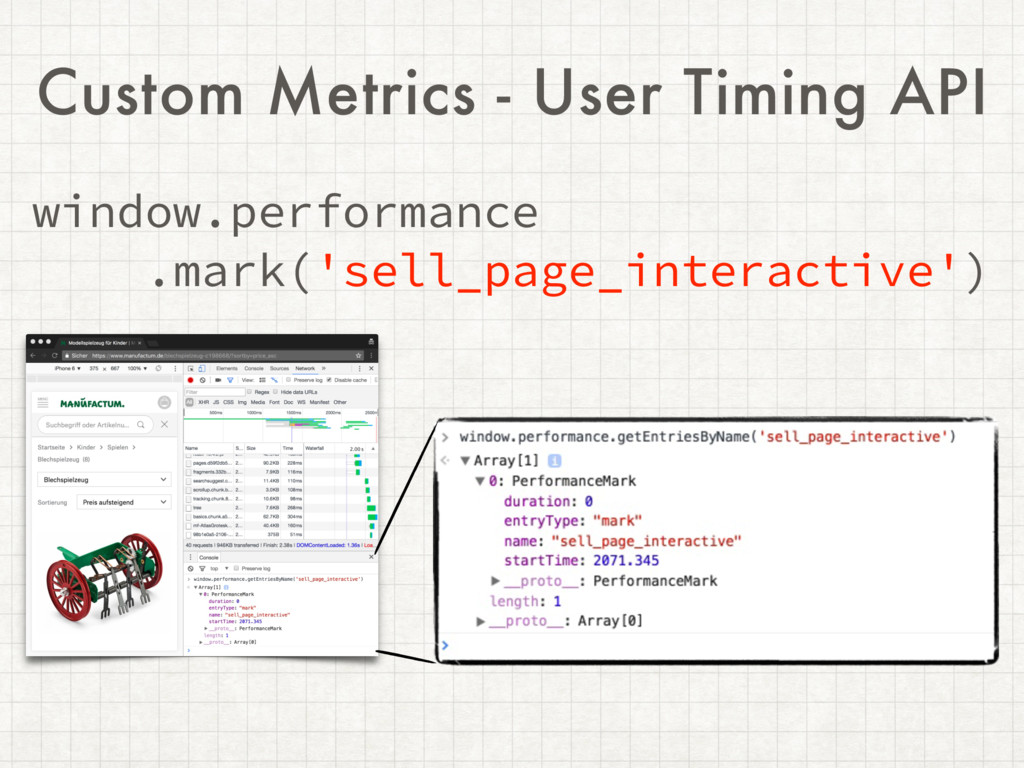
Custom Metrics - User Timing API window.performance .mark('sell_page_interactive')
VISUAL METRICS
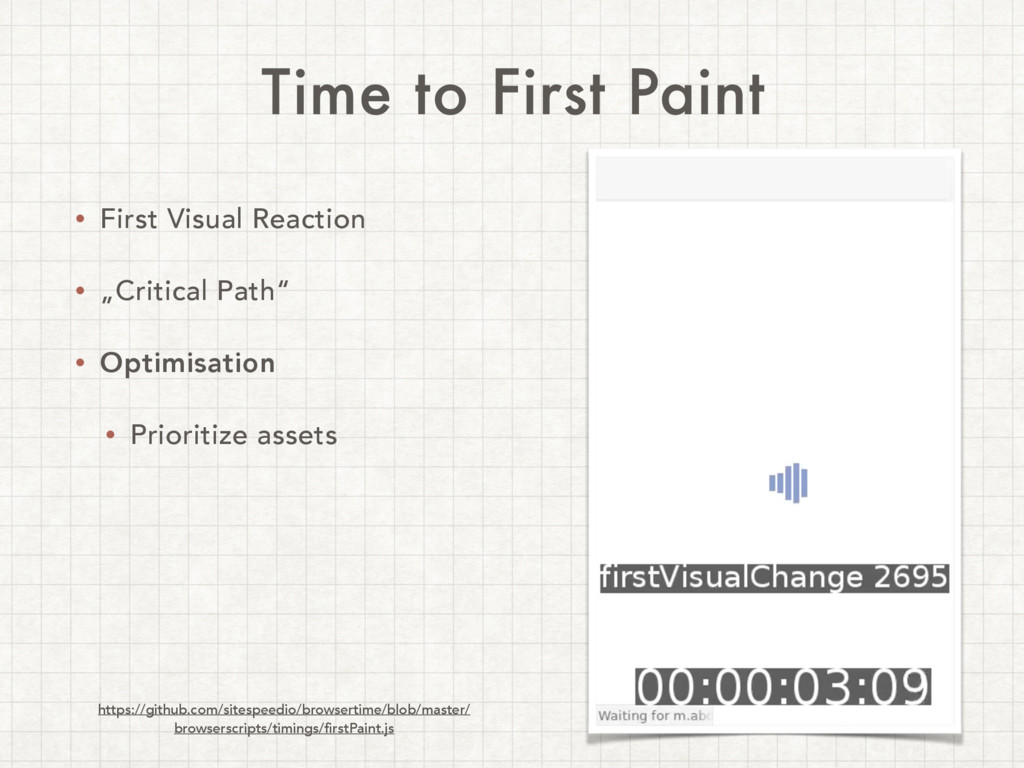
• First Visual Reaction • „Critical Path“ • Optimisation •
Prioritize assets Time to First Paint https://github.com/sitespeedio/browsertime/blob/master/ browserscripts/timings/firstPaint.js
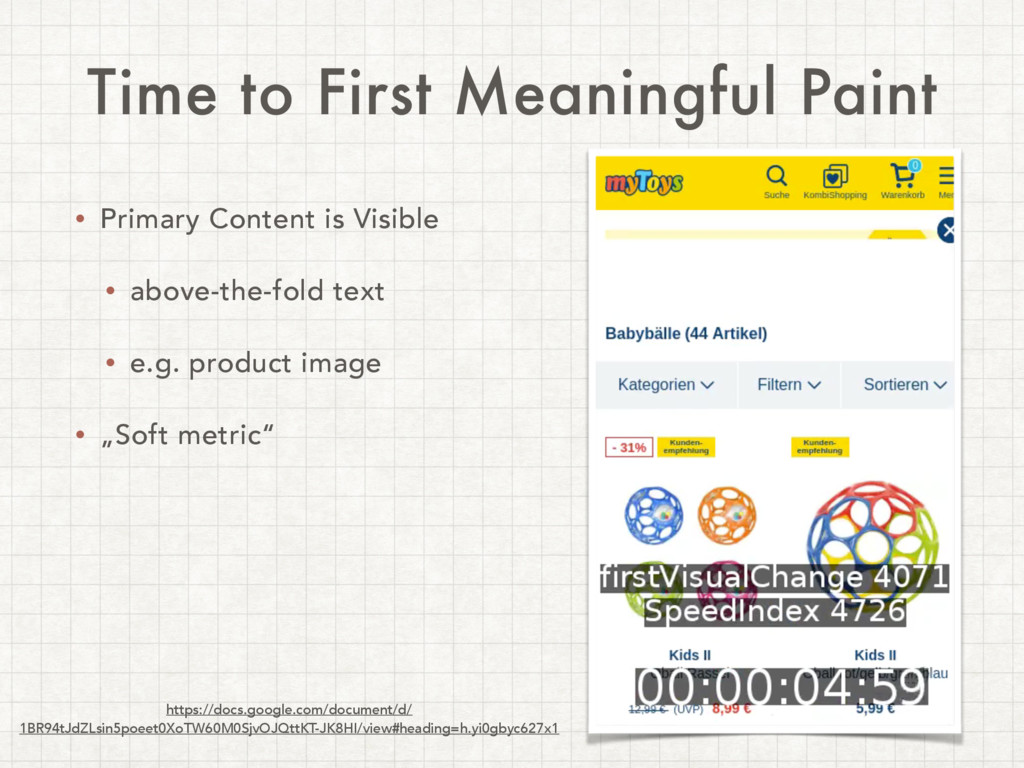
• Primary Content is Visible • above-the-fold text • e.g.
product image • „Soft metric“ Time to First Meaningful Paint https://docs.google.com/document/d/ 1BR94tJdZLsin5poeet0XoTW60M0SjvOJQttKT-JK8HI/view#heading=h.yi0gbyc627x1
• Viewport is fully rendered • Depends on screen size
Time to Visually Complete
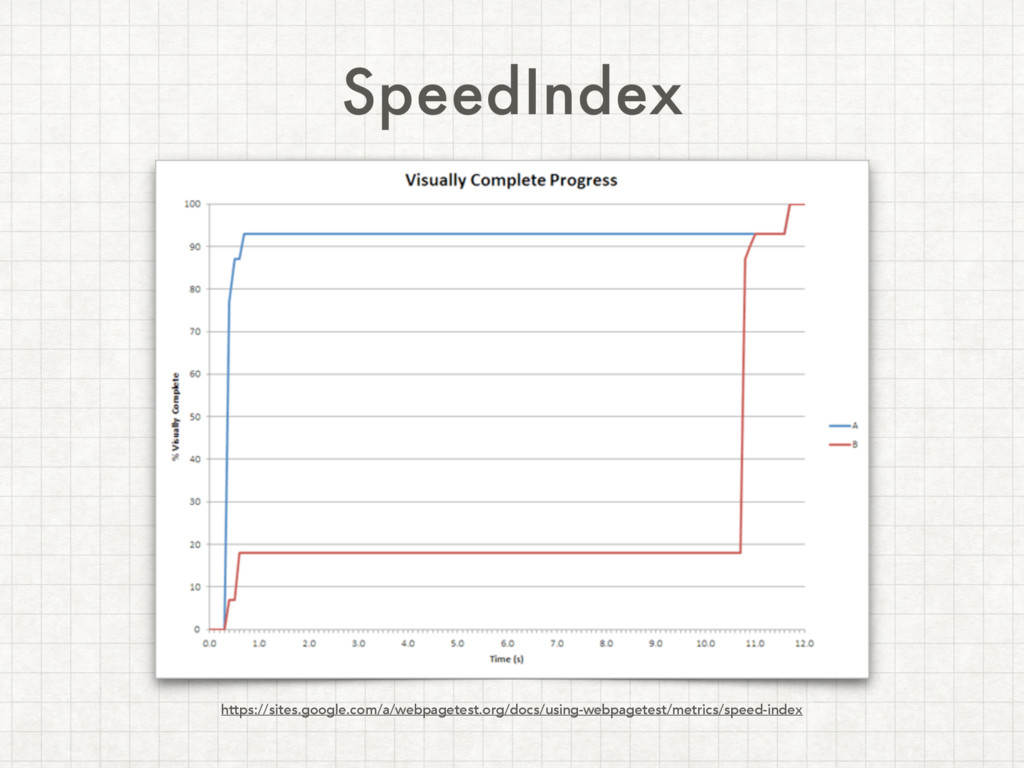
SpeedIndex https://sites.google.com/a/webpagetest.org/docs/using-webpagetest/metrics/speed-index
SpeedIndex https://sites.google.com/a/webpagetest.org/docs/using-webpagetest/metrics/speed-index lower is better
HOW TO MEASURE?
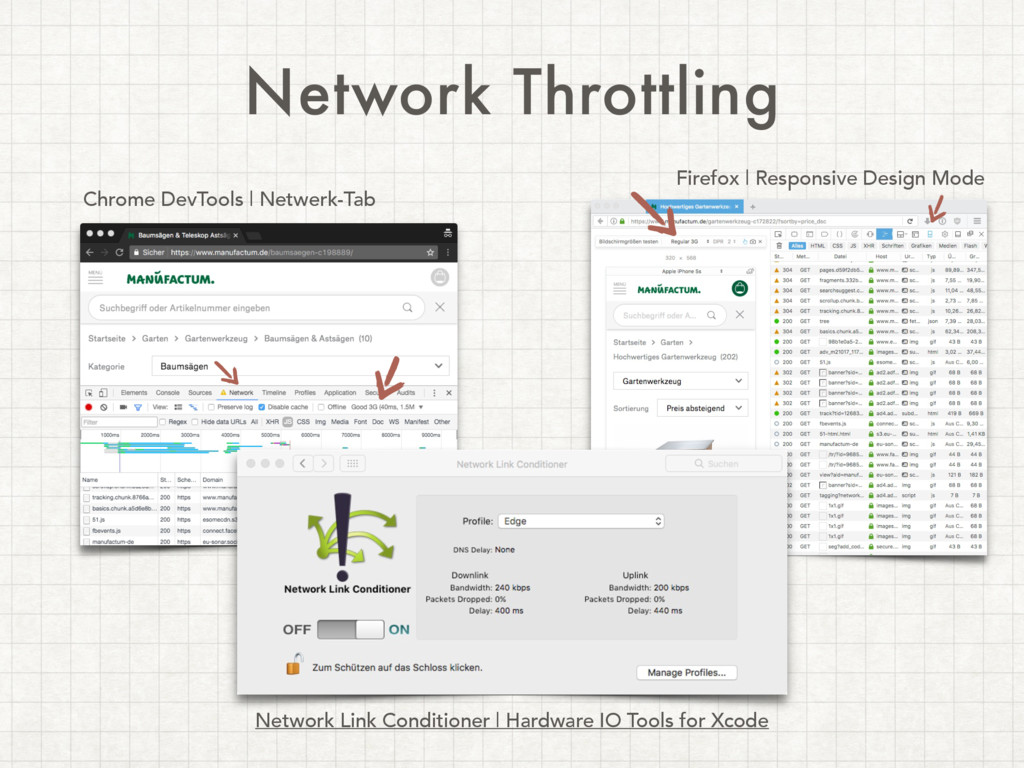
Network Throttling Chrome DevTools | Netwerk-Tab Firefox | Responsive Design
Mode Network Link Conditioner | Hardware IO Tools for Xcode
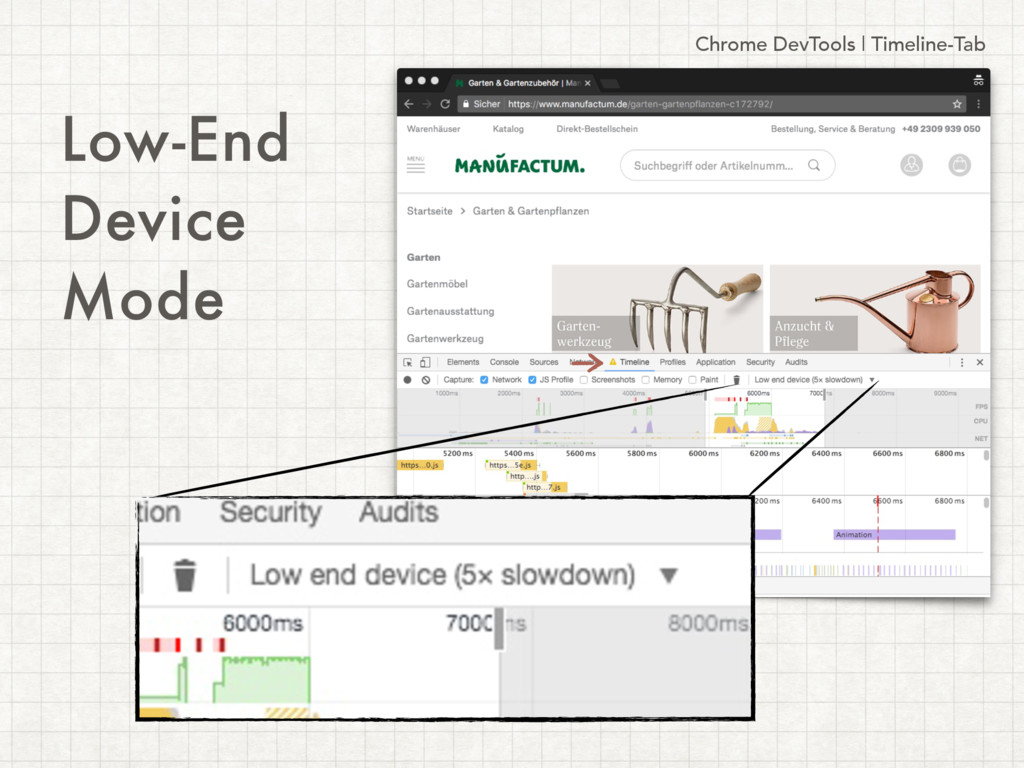
Chrome DevTools | Timeline-Tab Low-End Device Mode
5 METRIC TOOLS
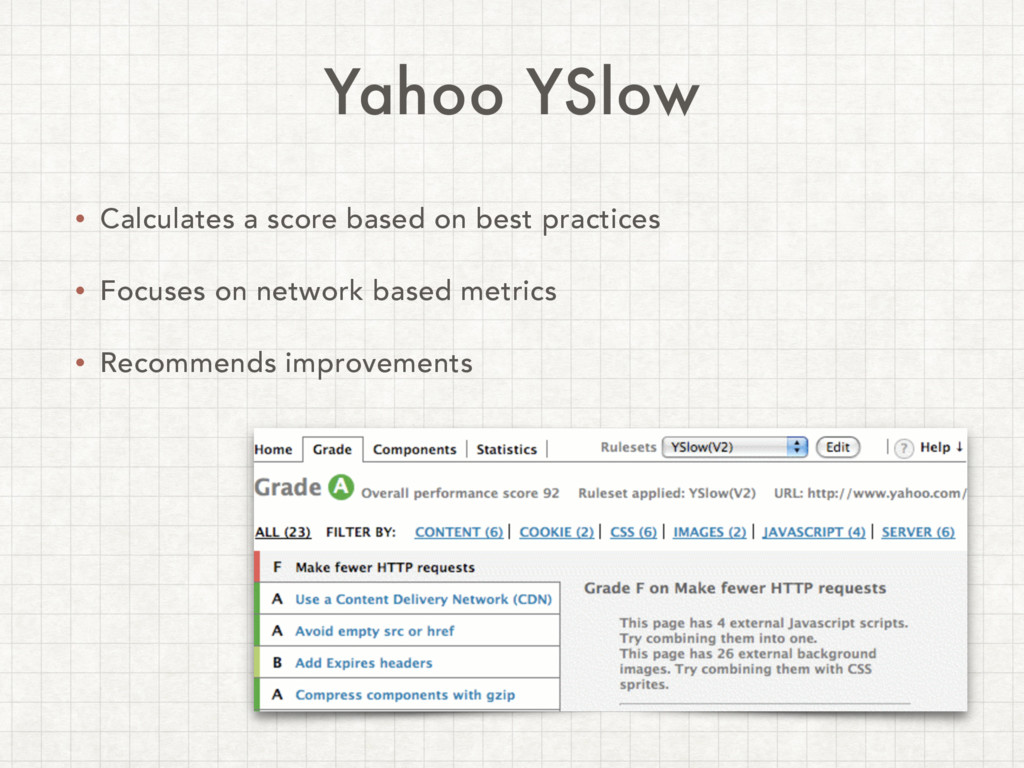
Yahoo YSlow • Calculates a score based on best practices
• Focuses on network based metrics • Recommends improvements
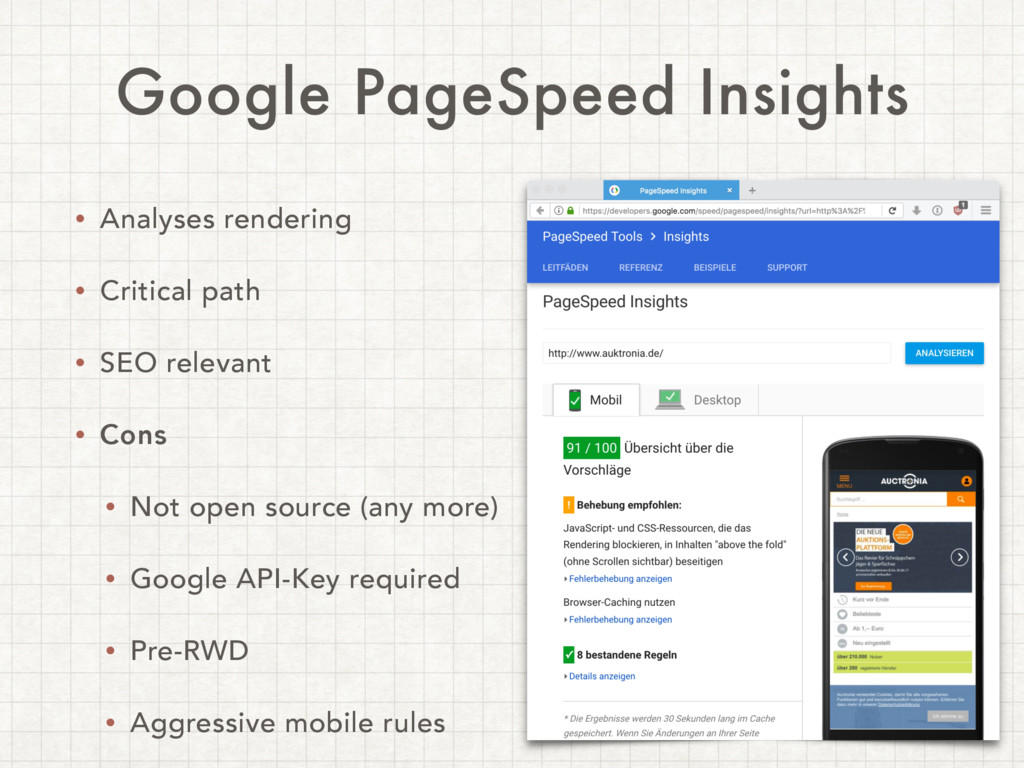
Google PageSpeed Insights • Analyses rendering • Critical path •
SEO relevant • Cons • Not open source (any more) • Google API-Key required • Pre-RWD • Aggressive mobile rules
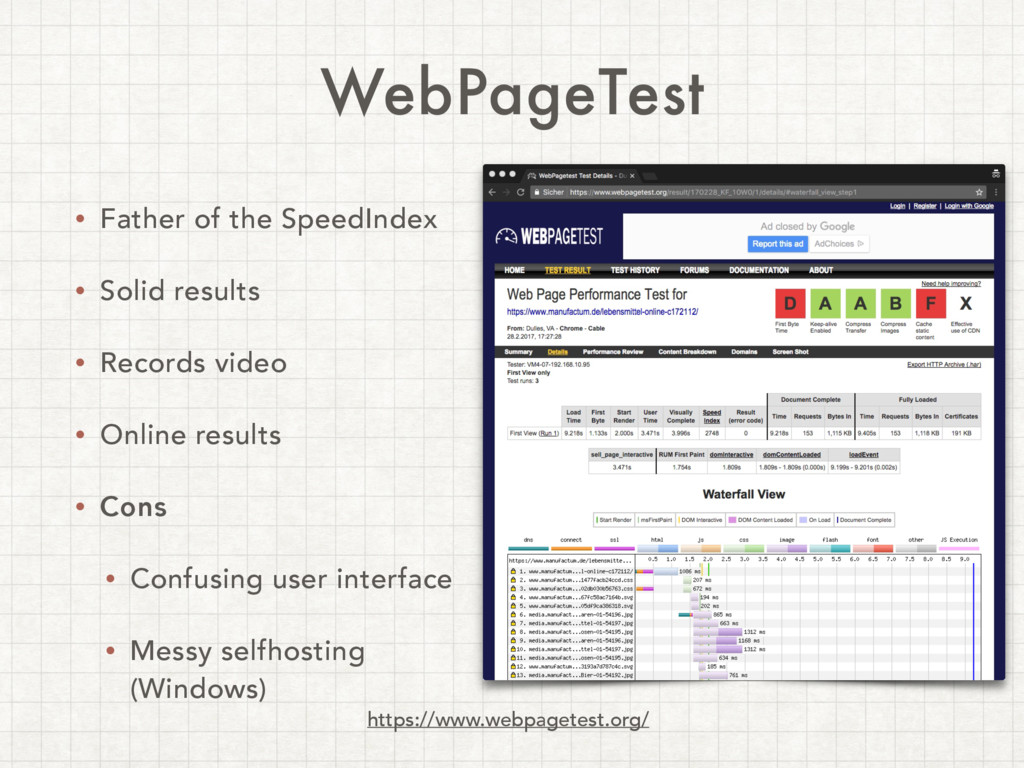
WebPageTest • Father of the SpeedIndex • Solid results •
Records video • Online results • Cons • Confusing user interface • Messy selfhosting (Windows) https://www.webpagetest.org/
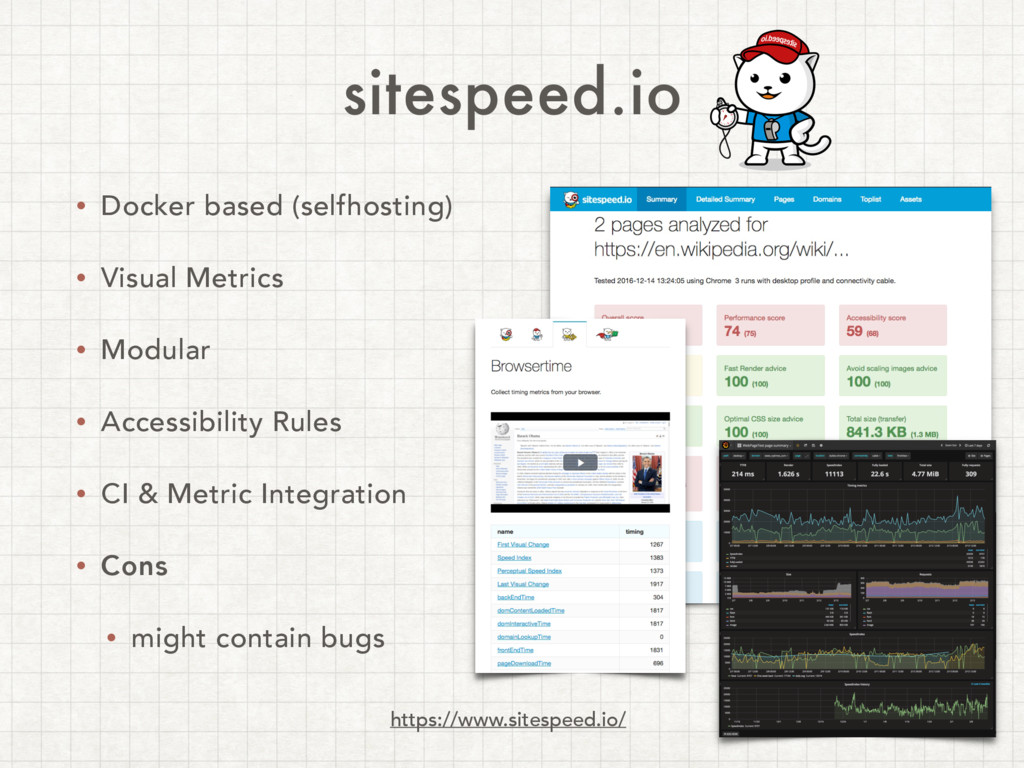
sitespeed.io • Docker based (selfhosting) • Visual Metrics • Modular
• Accessibility Rules • CI & Metric Integration • Cons • might contain bugs https://www.sitespeed.io/
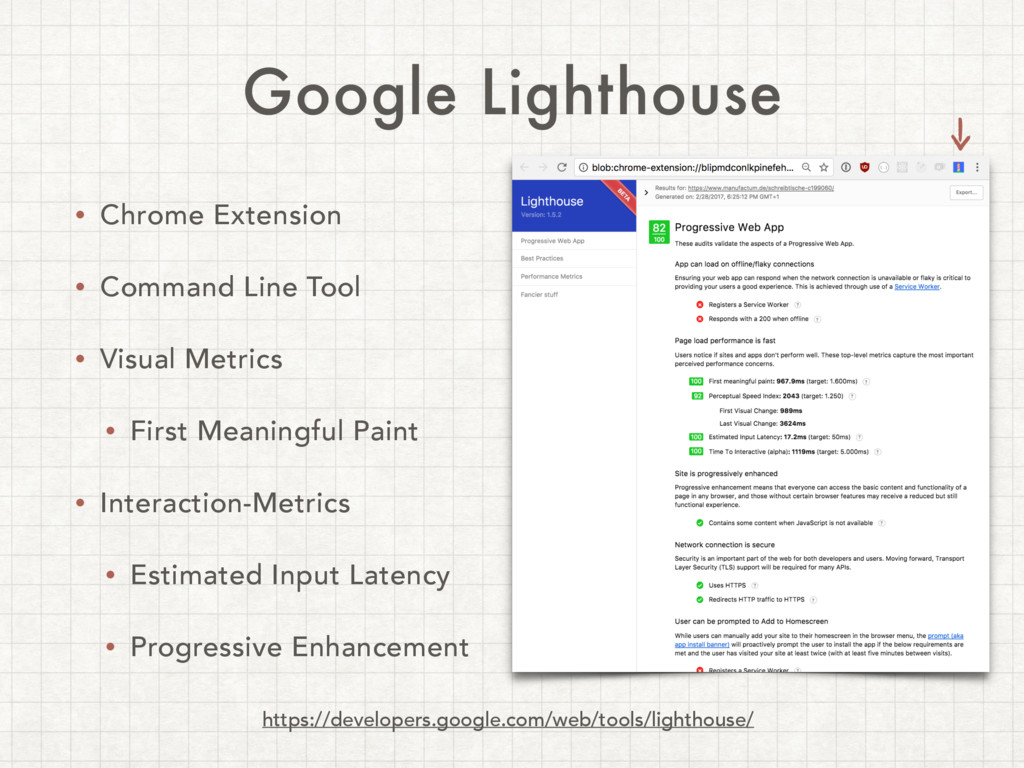
Google Lighthouse • Chrome Extension • Command Line Tool •
Visual Metrics • First Meaningful Paint • Interaction-Metrics • Estimated Input Latency • Progressive Enhancement https://developers.google.com/web/tools/lighthouse/
GETTING REAL
Real User Monitoring • Measuring inside the users browser •
real device distribution • real browser distribution • real connectivity situations
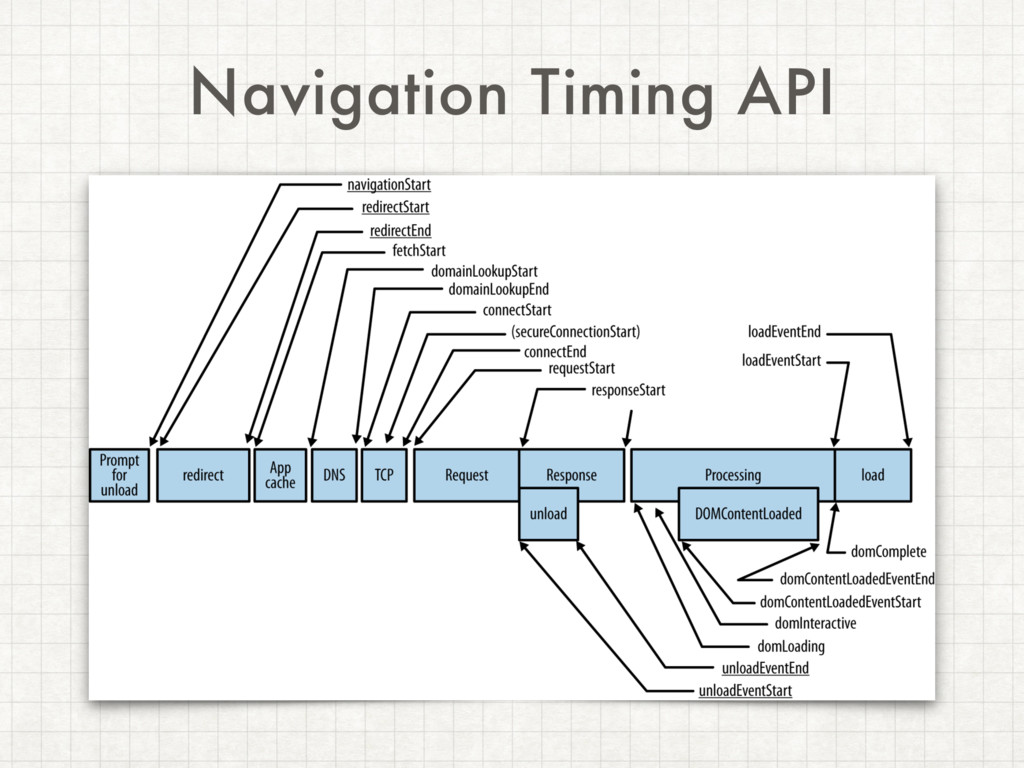
Navigation Timing API
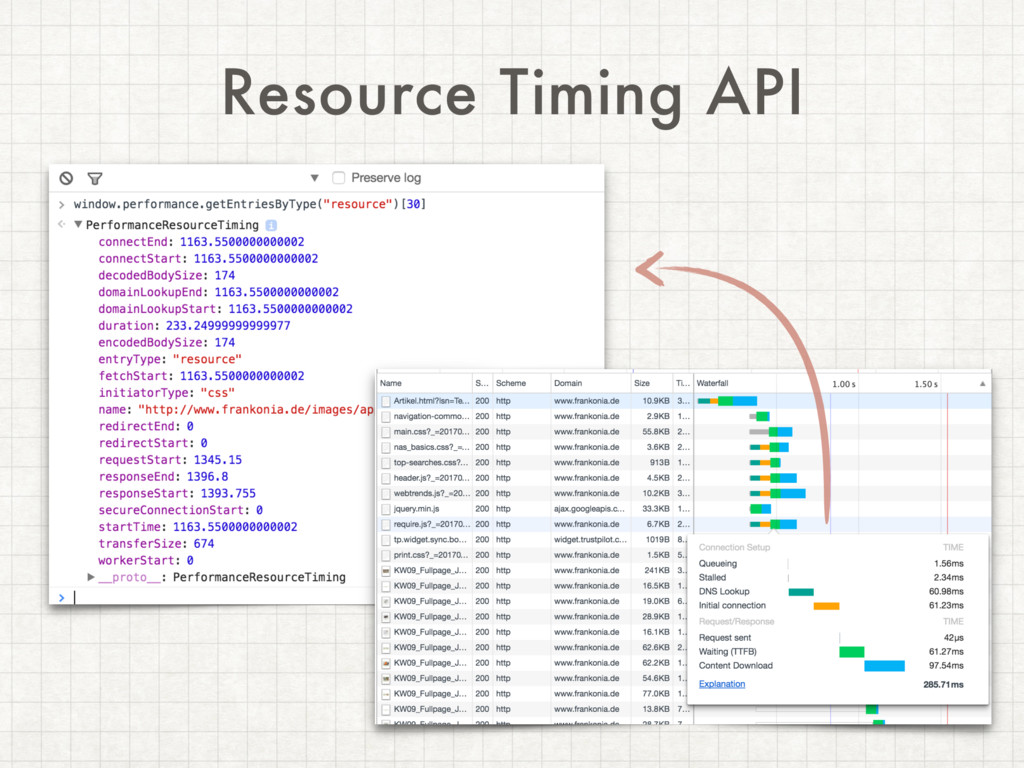
Resource Timing API
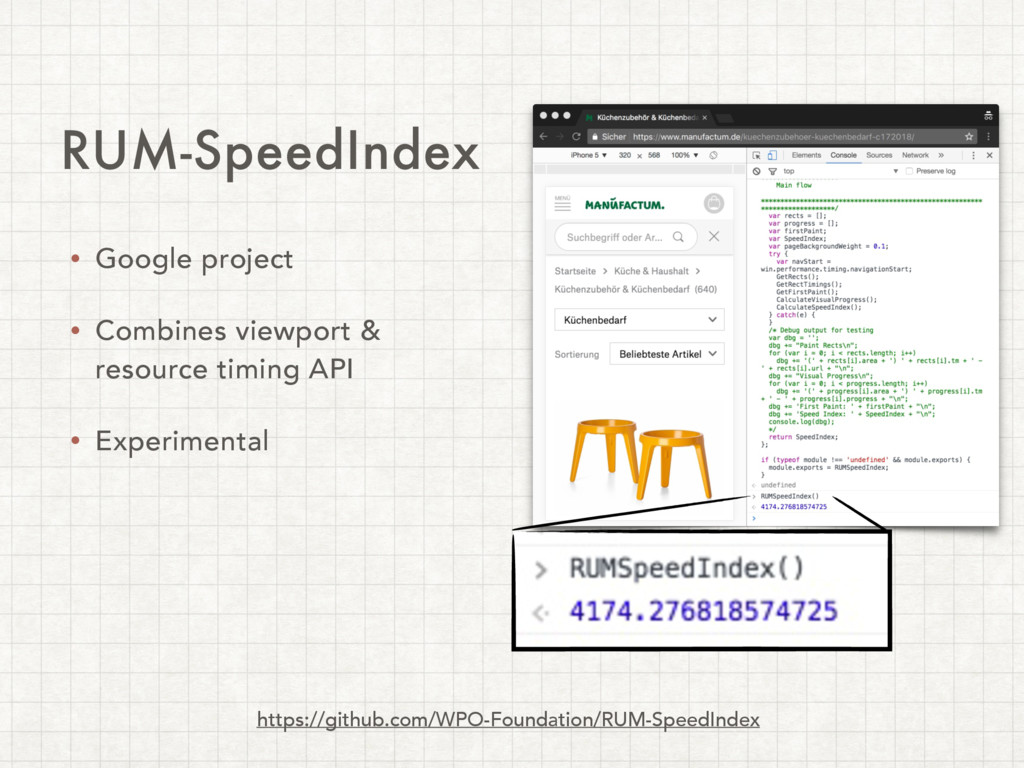
https://github.com/WPO-Foundation/RUM-SpeedIndex • Google project • Combines viewport & resource timing
API • Experimental RUM-SpeedIndex
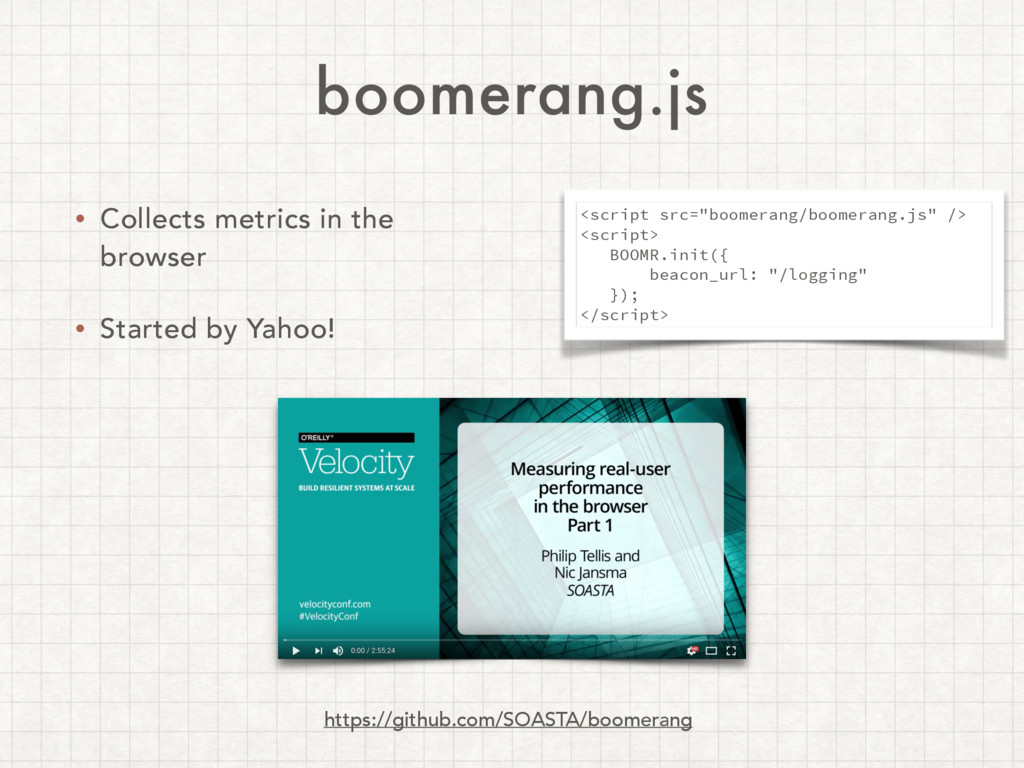
boomerang.js • Collects metrics in the browser • Started by
Yahoo! <script src="boomerang/boomerang.js" /> <script> BOOMR.init({ beacon_url: "/logging" }); </script> https://github.com/SOASTA/boomerang
browsertime • Part of sitespeed.io • Leverages browser APIs https://github.com/sitespeedio/browsertime/tree/master/browserscripts/timings
No OpenSource RUM Solution :(
TIPS
Performance Budgets https://timkadlec.com/2013/01/setting-a-performance-budget/
Continuous Integration & Visualisations
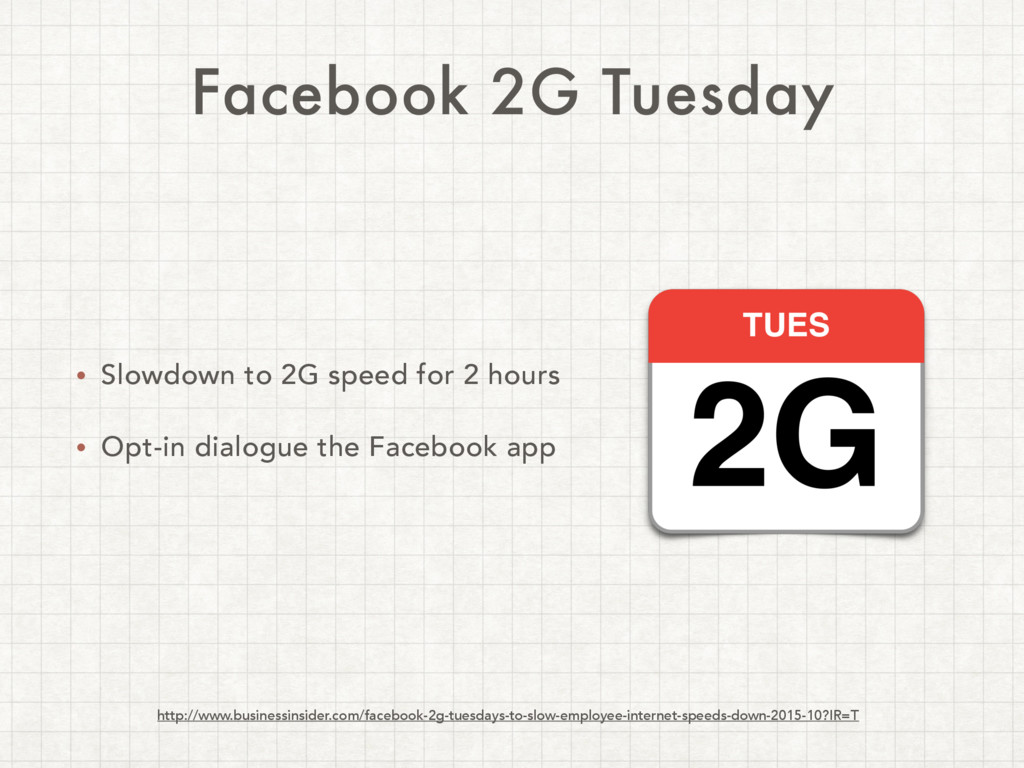
Facebook 2G Tuesday • Slowdown to 2G speed for 2
hours • Opt-in dialogue the Facebook app http://www.businessinsider.com/facebook-2g-tuesdays-to-slow-employee-internet-speeds-down-2015-10?IR=T
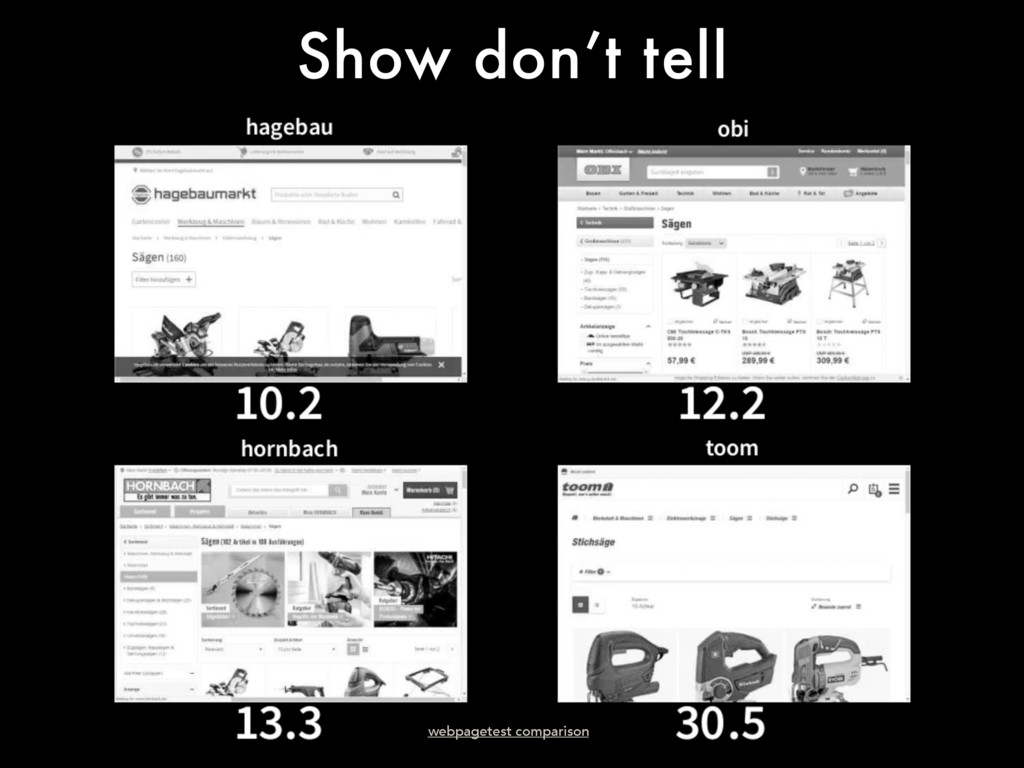
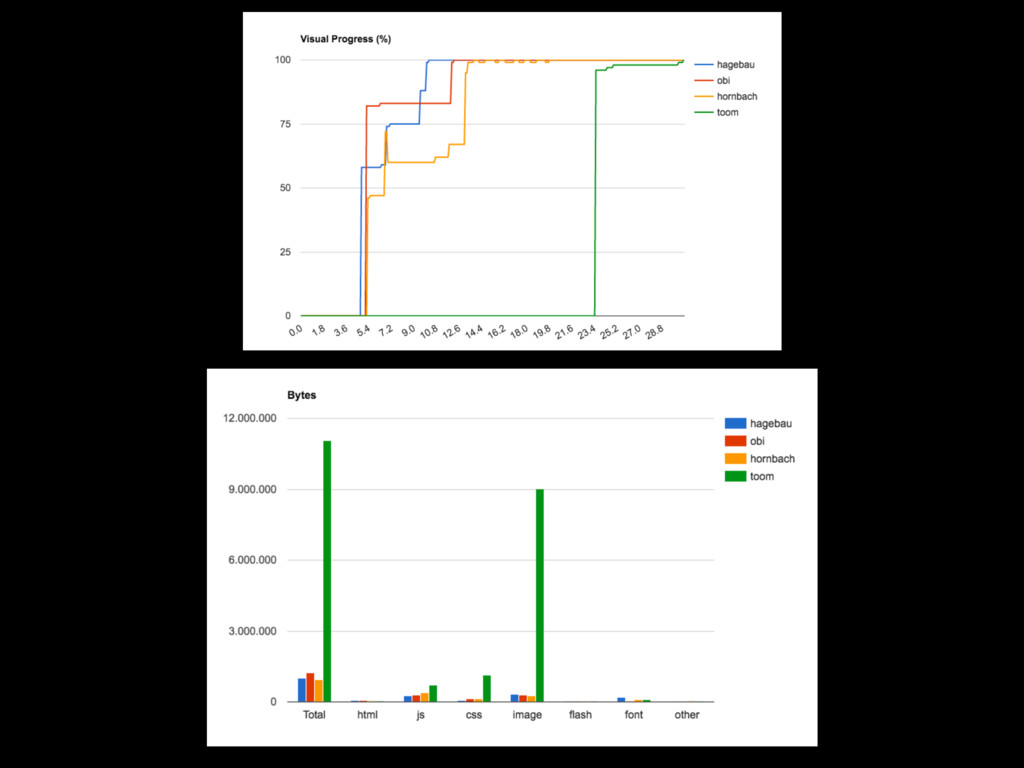
Show don’t tell webpagetest comparison
None
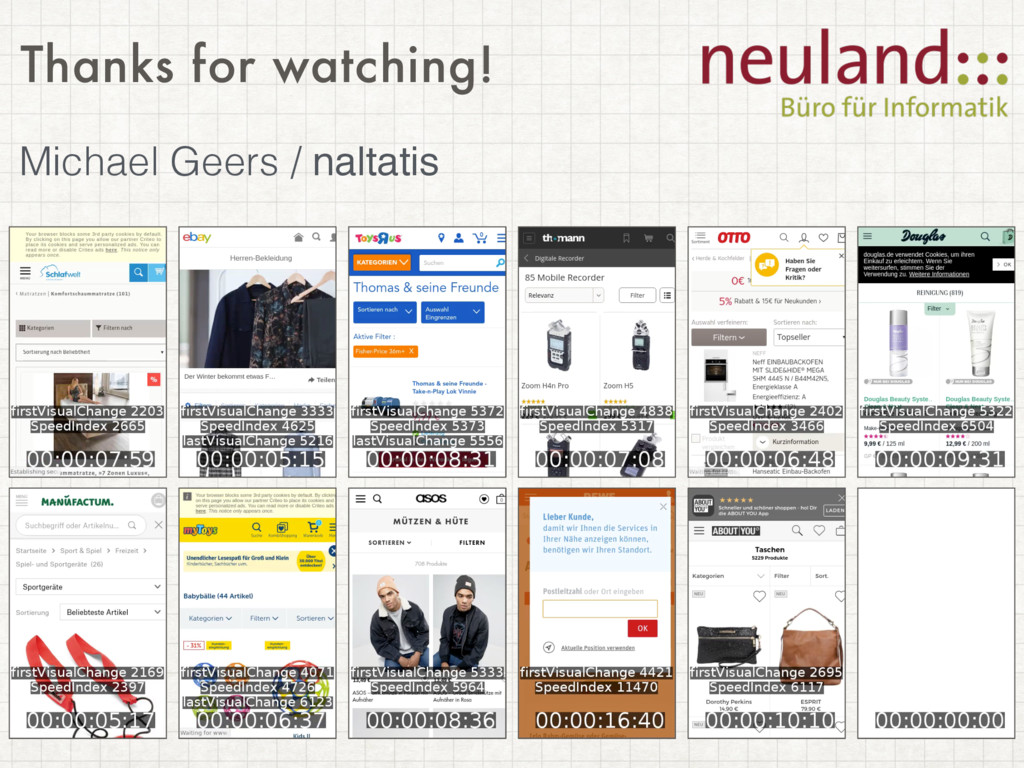
Thanks for watching! Michael Geers / naltatis