Upgrade to Pro
— share decks privately, control downloads, hide ads and more …
Speaker Deck
Features
Speaker Deck
PRO
Sign in
Sign up for free
Search
Search
NAVITIMEアプリでのパフォーマンス改善の取り組み
Search
NAVITIME JAPAN
PRO
March 27, 2019
Technology
34
0
Share
Embed
Copy iframe code
Copy JS code
Copy link
Start on current slide
NAVITIMEアプリでのパフォーマンス改善の取り組み
3/27(水)に開催されたDevLOVE様主催のイベント『ナビタイムの現場 第2経路 -ナビタイムを支える技術-』にて発表した資料です。
NAVITIME JAPAN
PRO
March 27, 2019
More Decks by NAVITIME JAPAN
See All by NAVITIME JAPAN
つよつよリーダーが 抜けたらどうする? 〜ナビタイムのAgile⽀援組織の変遷〜
navitimejapan
PRO
23
16k
実践ジオフェンス 効率的に開発するために
navitimejapan
PRO
3
1.1k
安全で使いやすいCarPlayアプリの 魅せ方:HIGと実例から学ぶ
navitimejapan
PRO
1
300
見えないユーザの声はログに埋もれている! ~ログから具体的なユーザの体験を数値化した事例紹介~
navitimejapan
PRO
6
3.4k
ユーザーのためなら 『デザイン』 以外にも手を伸ばせる
navitimejapan
PRO
2
1.9k
フツーのIT女子が、 Engineering Managerになるまで
navitimejapan
PRO
3
450
不確実性に打ち勝つOKR戦略/How to manage uncertainty with OKR strategy
navitimejapan
PRO
4
4k
アジャイルを小さいままで 組織に広める 二周目 / Agile Transformation in NAVITIME JAPAN iteration 2
navitimejapan
PRO
4
1.6k
変更障害率0%よりも「継続的な学習と実験」を価値とする 〜障害を「起こってはならないもの」としていた組織がDirtの実施に至るまで〜 / DevOps Transformation in NAVITIME JAPAN
navitimejapan
PRO
8
6.2k
Other Decks in Technology
See All in Technology
Git 研修【MIXI 26新卒技術研修】#2
mixi_engineers
PRO
1
250
システム監視入門
grimoh
2
570
A Bag-of-Documents Model for Query Specificity
dtunkelang
0
110
OpenTelemetryにおけるGoのゼロコード・コンパイル時計装について #fukuokago
quiver
0
340
Multicaで30個のミニプロジェクトをAIエージェント運用して見えてきたこと
eiei114
1
670
「休む」重要さ
smt7174
7
1.7k
【公開用】AI_Dev_Ex2026_AI_登壇資料
matsuritechnologies
PRO
2
640
ダッシュボード"開発"について 〜使われるダッシュボードのつくりかた〜
kimichan
0
230
AIが当たり前の組織で エンジニアはどう育つか
nishihira
1
1.3k
kaonavi Tech Night#1
kaonavi
0
180
複数プロダクト組織のAIネイティブ化における戦略 / AICon2026_kude
rakus_dev
0
330
全社でのソフトウェアサプライチェーン攻撃対策をやってみた with Takumi Guard
z63d
0
310
Featured
See All Featured
Amusing Abliteration
ianozsvald
1
240
Ecommerce SEO: The Keys for Success Now & Beyond - #SERPConf2024
aleyda
1
2.1k
RailsConf 2023
tenderlove
30
1.5k
I Don’t Have Time: Getting Over the Fear to Launch Your Podcast
jcasabona
34
2.8k
The Pragmatic Product Professional
lauravandoore
37
7.4k
How to Ace a Technical Interview
jacobian
281
24k
Effective software design: The role of men in debugging patriarchy in IT @ Voxxed Days AMS
baasie
0
450
Why Mistakes Are the Best Teachers: Turning Failure into a Pathway for Growth
auna
0
190
WCS-LA-2024
lcolladotor
0
760
Thoughts on Productivity
jonyablonski
76
5.3k
Lightning Talk: Beautiful Slides for Beginners
inesmontani
PRO
2
610
ReactJS: Keep Simple. Everything can be a component!
pedronauck
666
130k
Transcript
NAVITIMEアプリでの パフォーマンス改善の取り組み 株式会社ナビタイムジャパン 石井直貴
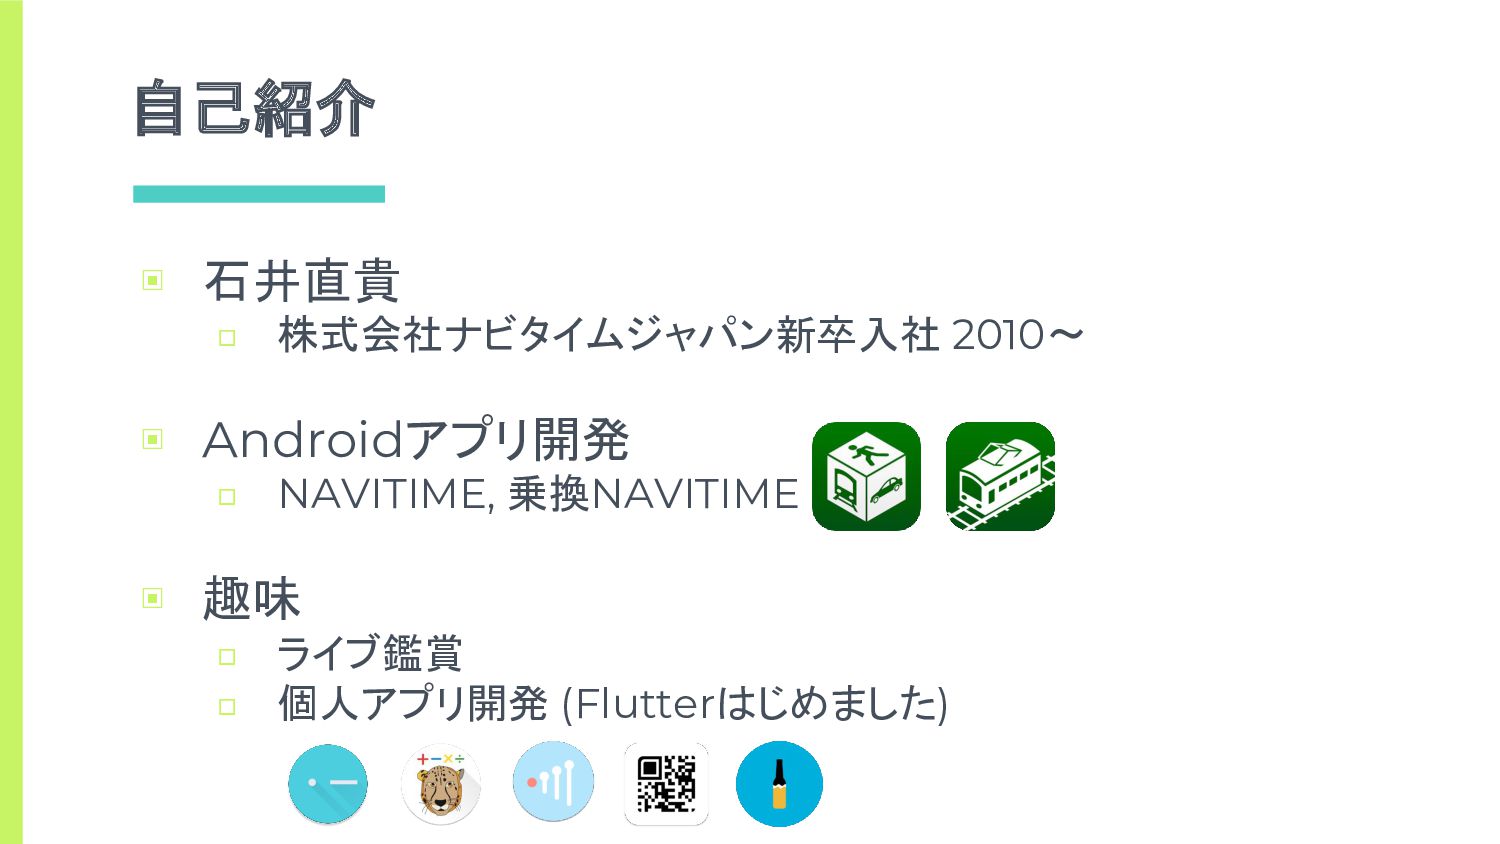
自己紹介 ▣ 石井直貴 □ 株式会社ナビタイムジャパン新卒入社 2010〜 ▣ Androidアプリ開発 □ NAVITIME,
乗換NAVITIME ▣ 趣味 □ ライブ鑑賞 □ 個人アプリ開発 (Flutterはじめました)
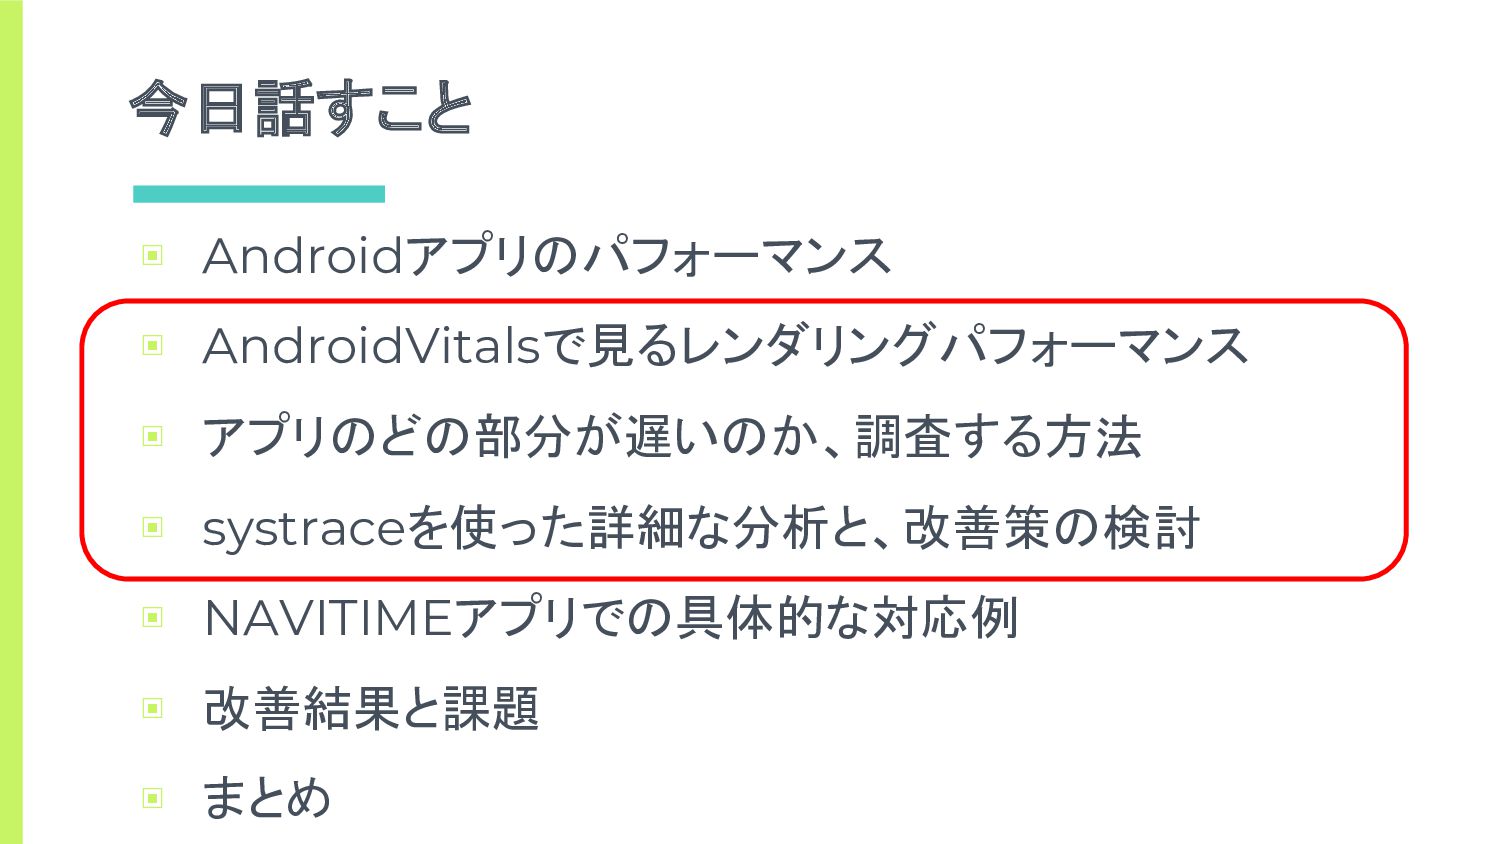
今日話すこと ▣ Androidアプリのパフォーマンス ▣ AndroidVitalsで見るレンダリングパフォーマンス ▣ アプリのどの部分が遅いのか、調査する方法 ▣ systraceを使った詳細な分析と、改善策の検討 ▣
NAVITIMEアプリでの具体的な対応例 ▣ 改善結果と課題 ▣ まとめ
アプリのパフォーマンス
パフォーマンス • 電力消費 • 通信量 • 通信速度 • レンダリング速度 •
メモリ最適化
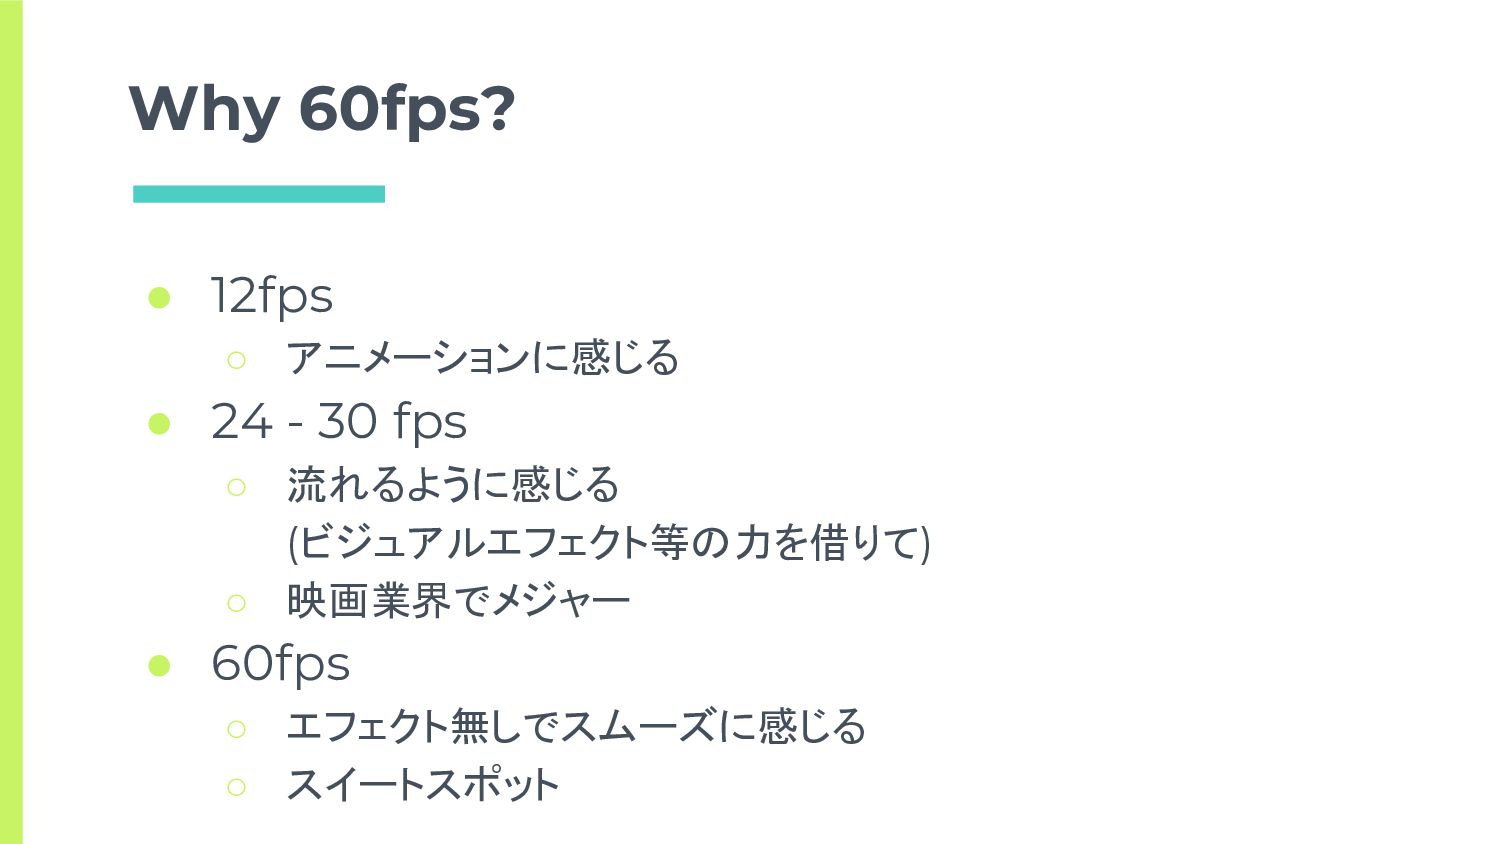
60fps fps (Frames Per Second) → 一秒間で幾つのフレームを描画できるか Android Performance Patterns:
Why 60fps?
Why 60fps? • 12fps ◦ アニメーションに感じる • 24 - 30
fps ◦ 流れるように感じる (ビジュアルエフェクト等の力を借りて) ◦ 映画業界でメジャー • 60fps ◦ エフェクト無しでスムーズに感じる ◦ スイートスポット
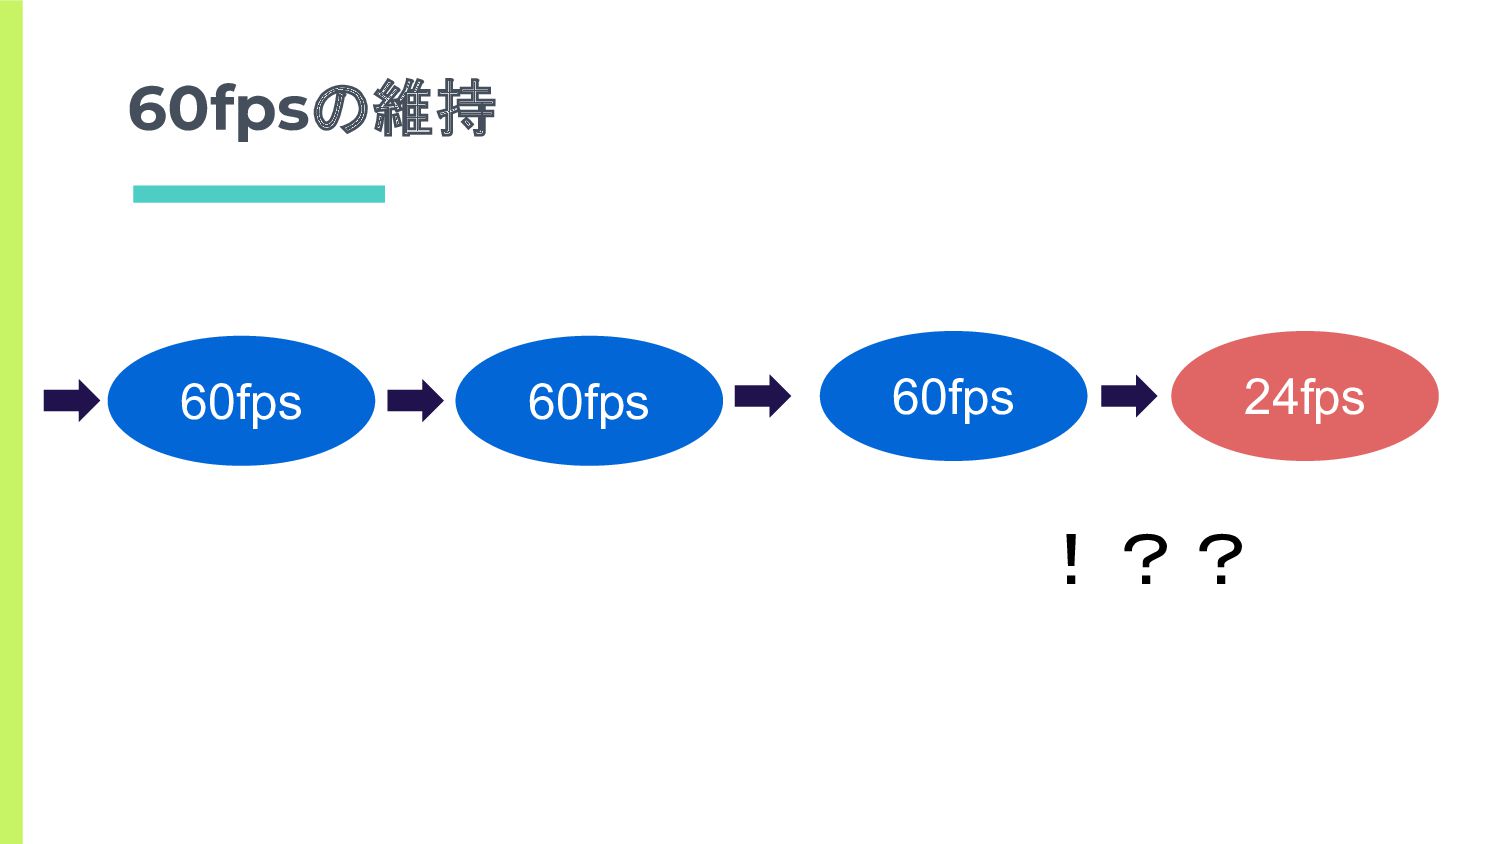
60fpsの維持 60fps 60fps 60fps 24fps !??
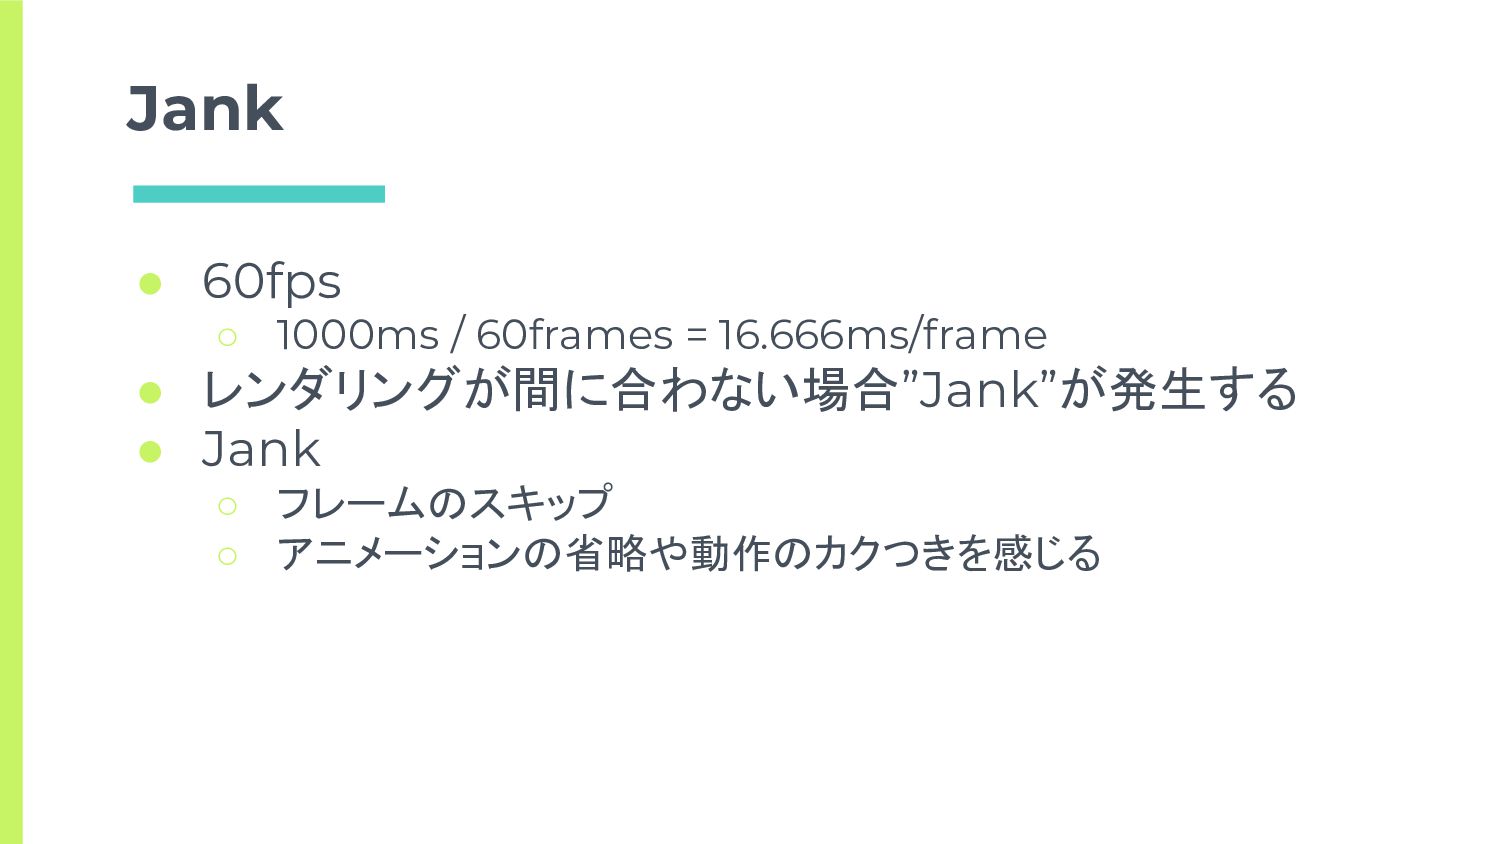
Jank • 60fps ◦ 1000ms / 60frames = 16.666ms/frame •
レンダリングが間に合わない場合”Jank”が発生する • Jank ◦ フレームのスキップ ◦ アニメーションの省略や動作のカクつきを感じる
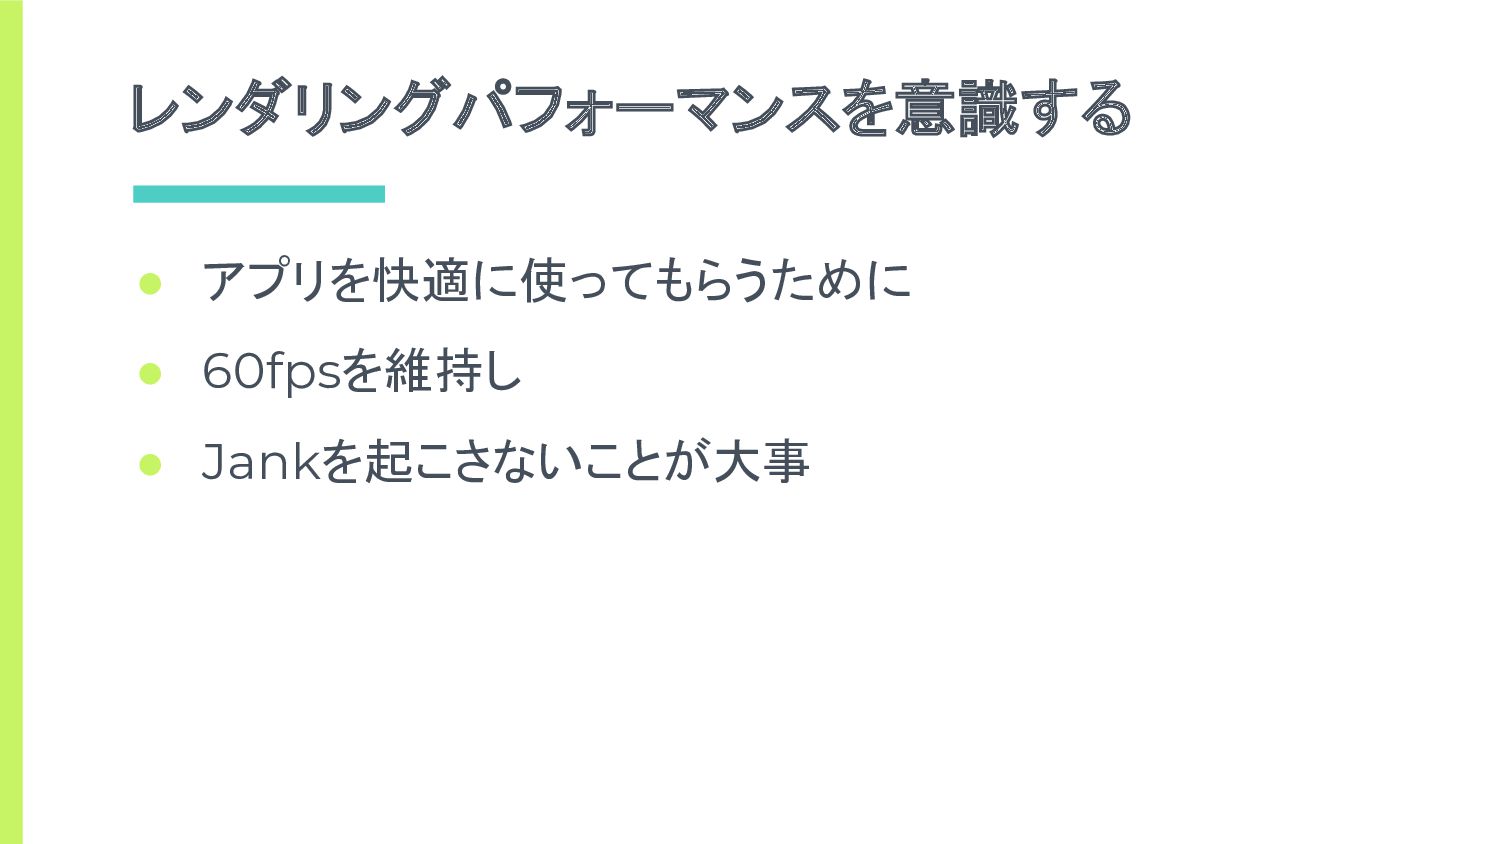
レンダリングパフォーマンスを意識する • アプリを快適に使ってもらうために • 60fpsを維持し • Jankを起こさないことが大事
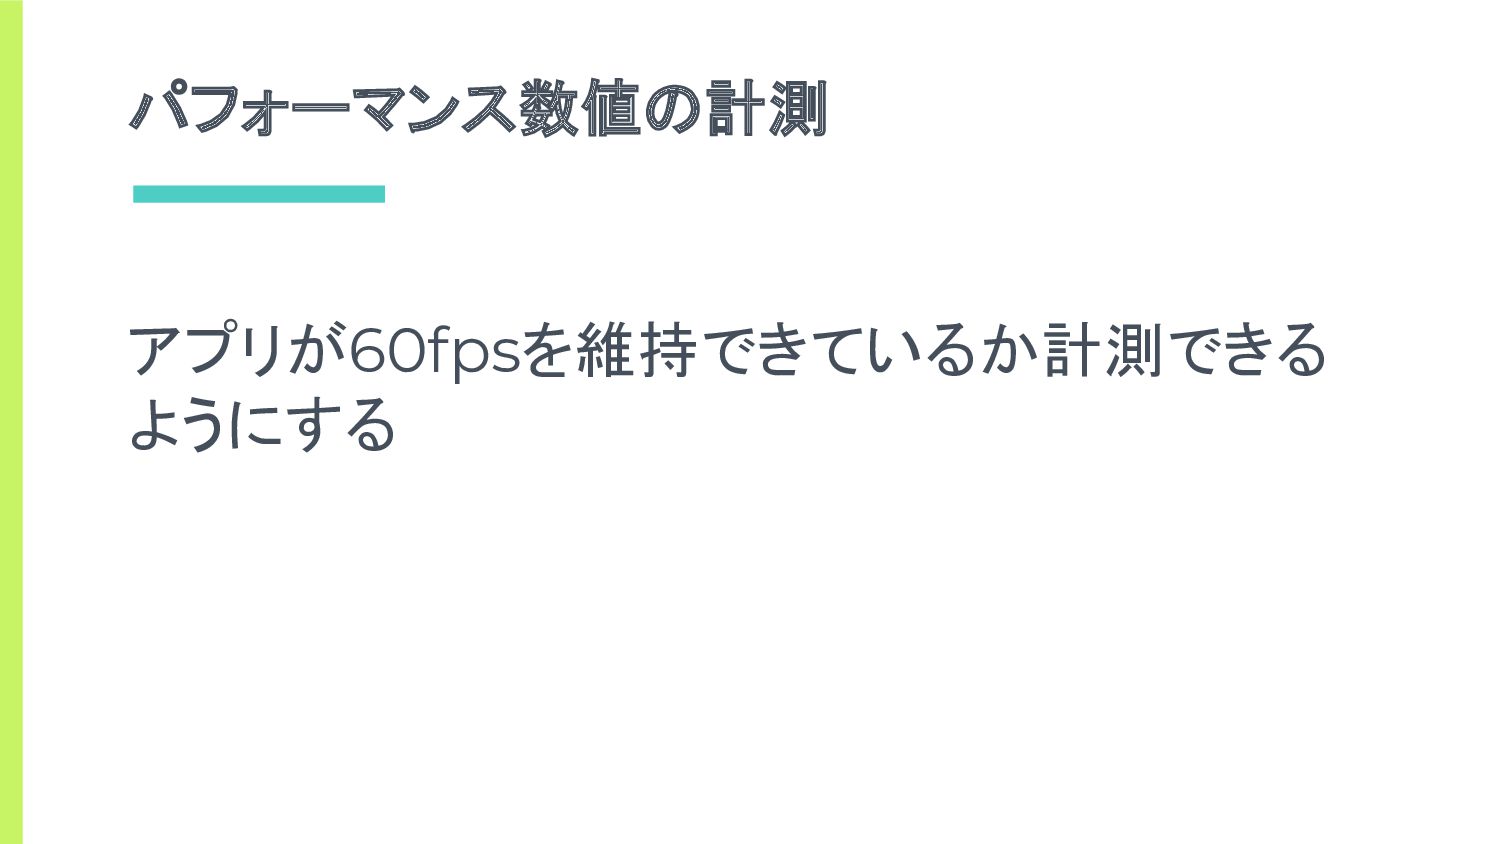
パフォーマンス数値の計測 アプリが60fpsを維持できているか計測できる ようにする
Android Vitalsでわかること
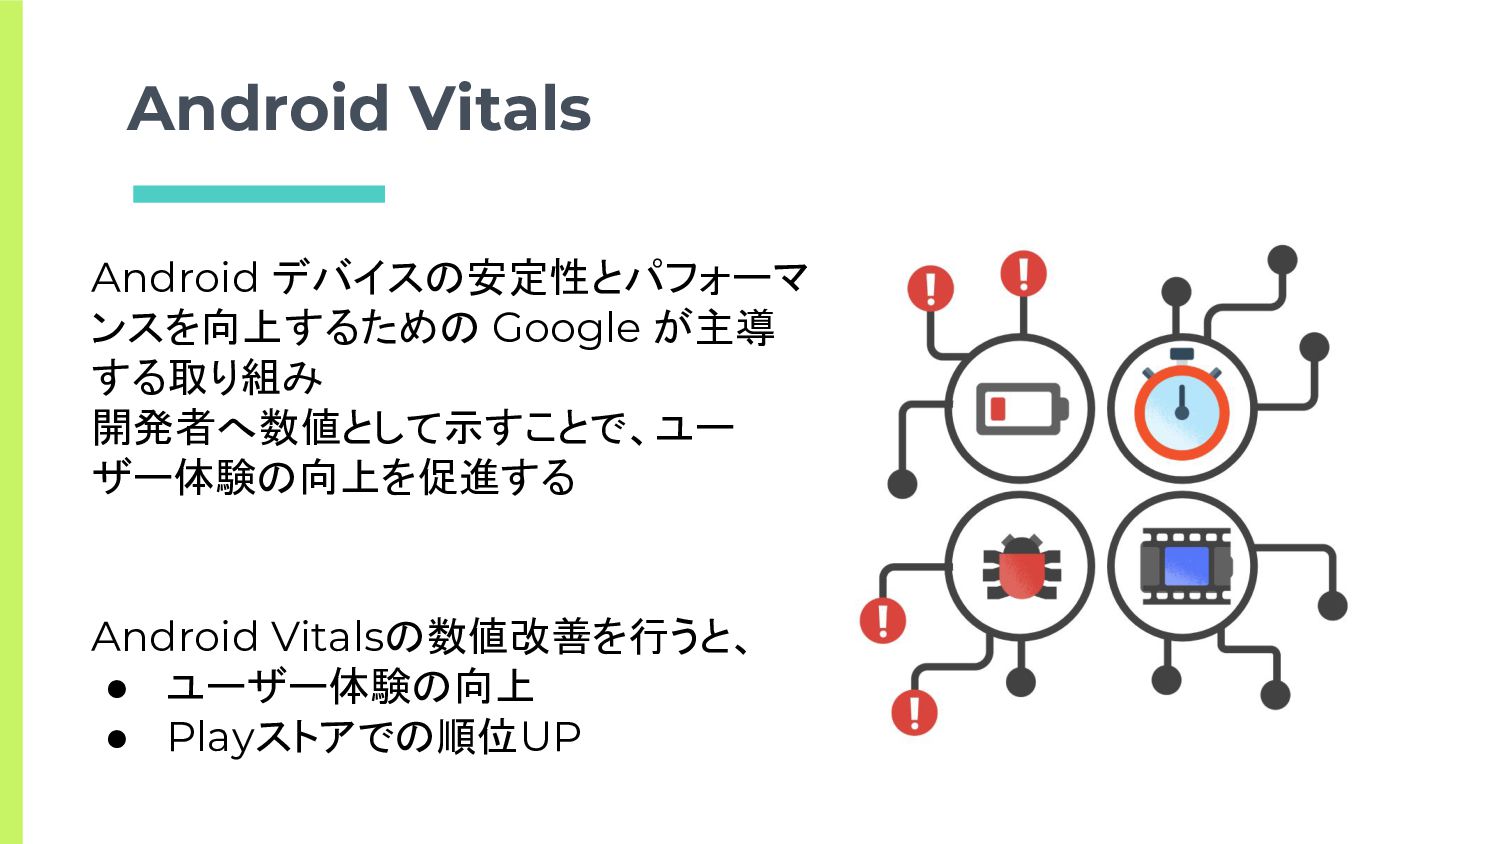
Android Vitals Android デバイスの安定性とパフォーマ ンスを向上するための Google が主導 する取り組み 開発者へ数値として示すことで、ユー ザー体験の向上を促進する
Android Vitalsの数値改善を行うと、 • ユーザー体験の向上 • Playストアでの順位UP
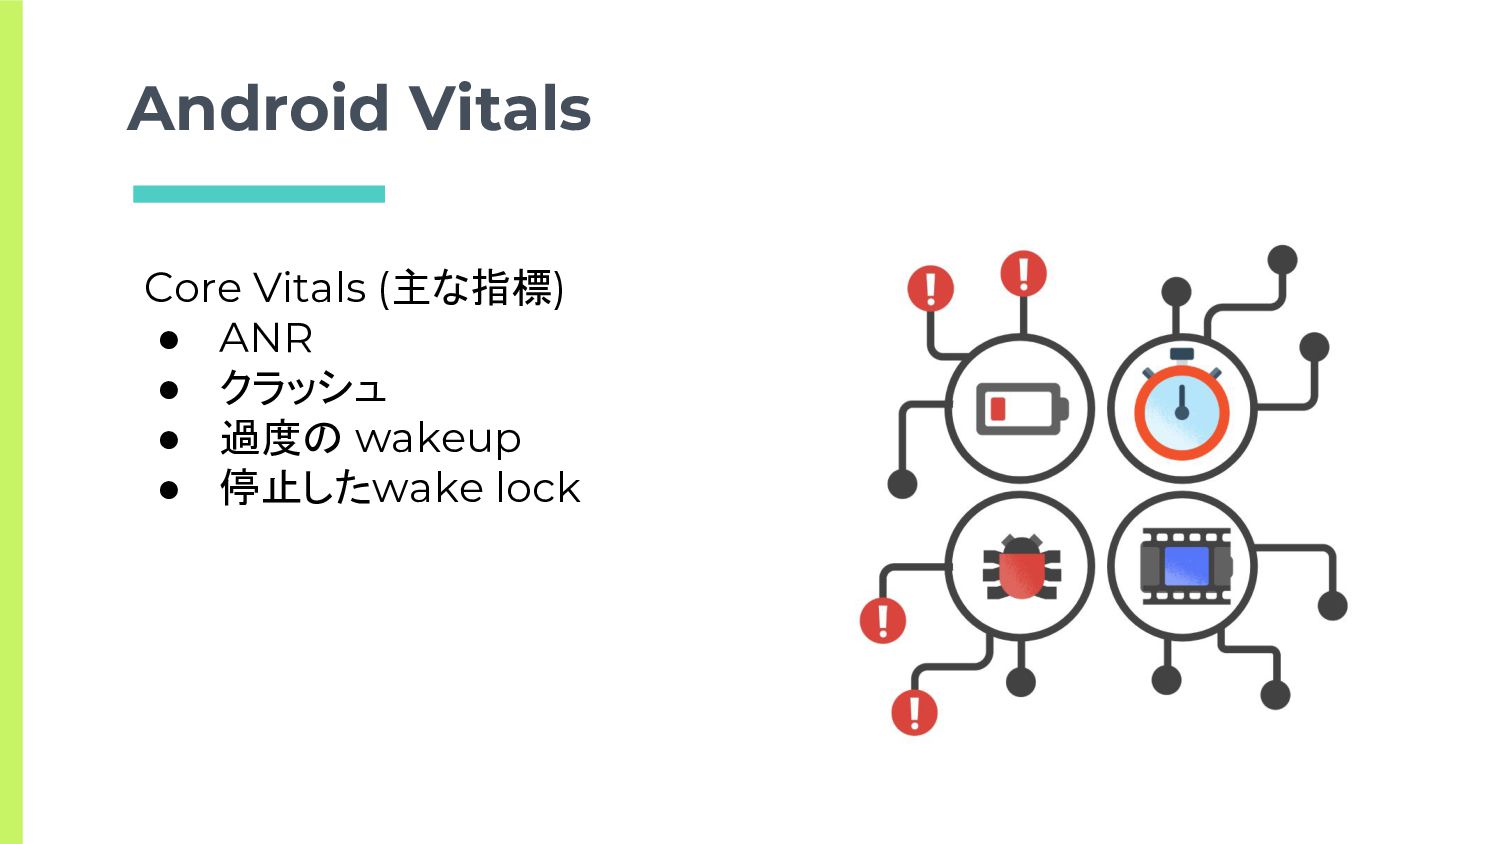
Android Vitals Core Vitals (主な指標) • ANR • クラッシュ •
過度の wakeup • 停止したwake lock
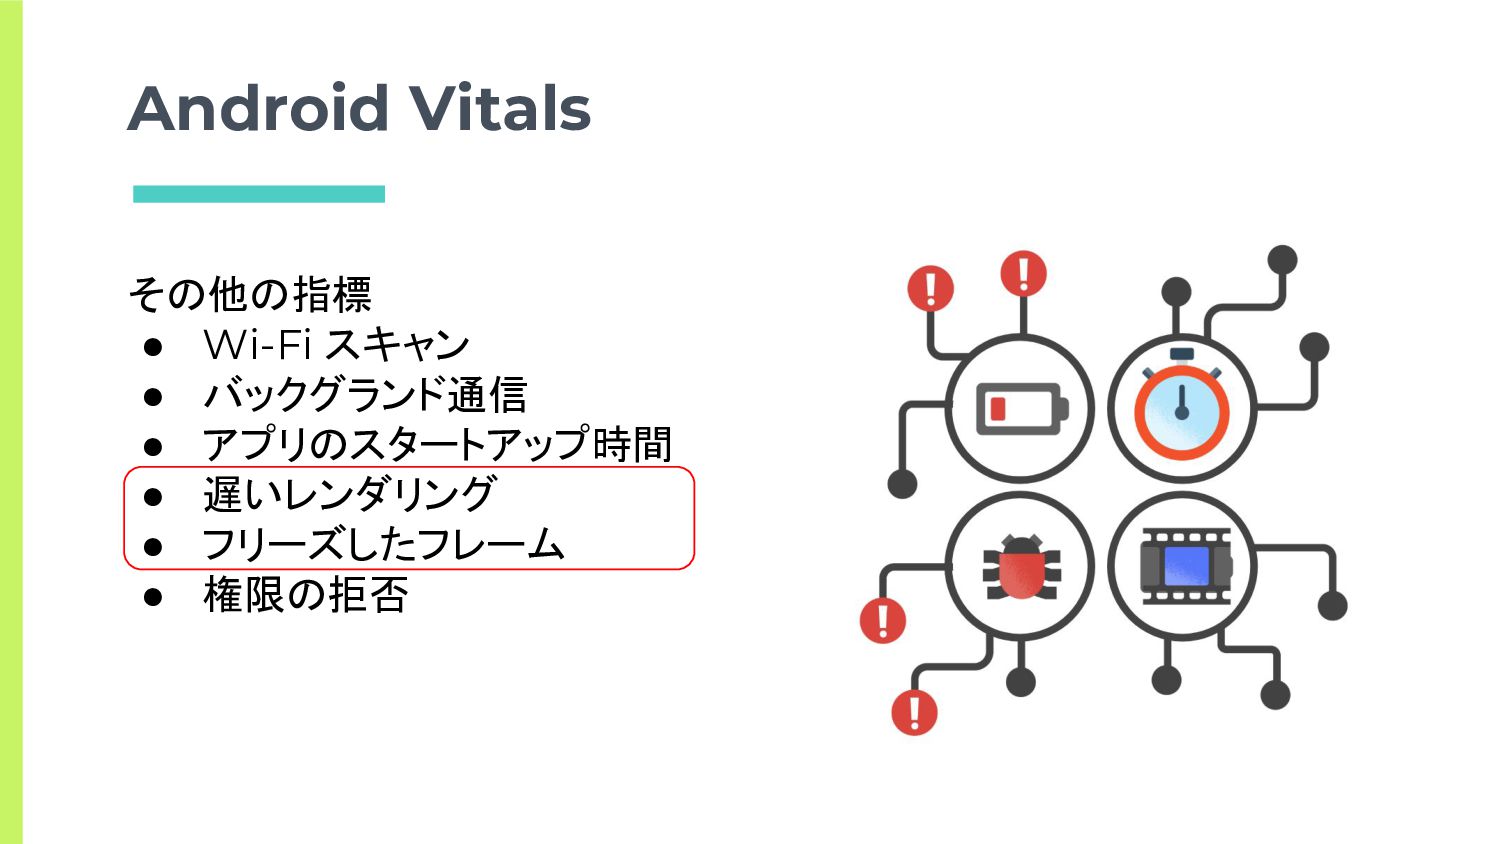
Android Vitals その他の指標 • Wi-Fi スキャン • バックグランド通信 • アプリのスタートアップ時間
• 遅いレンダリング • フリーズしたフレーム • 権限の拒否
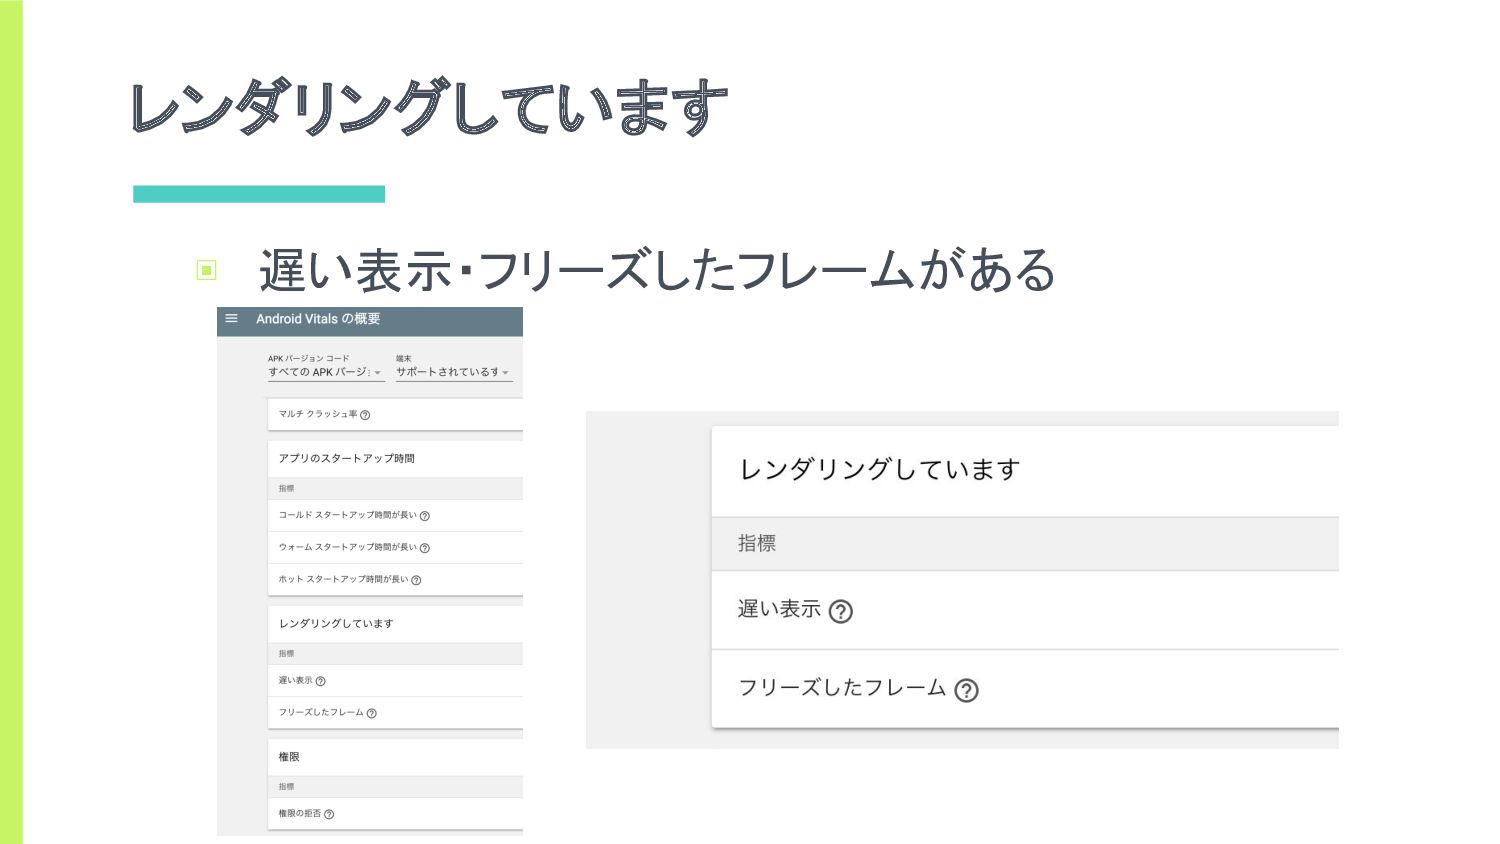
レンダリングしています ▣ 遅い表示・フリーズしたフレームがある
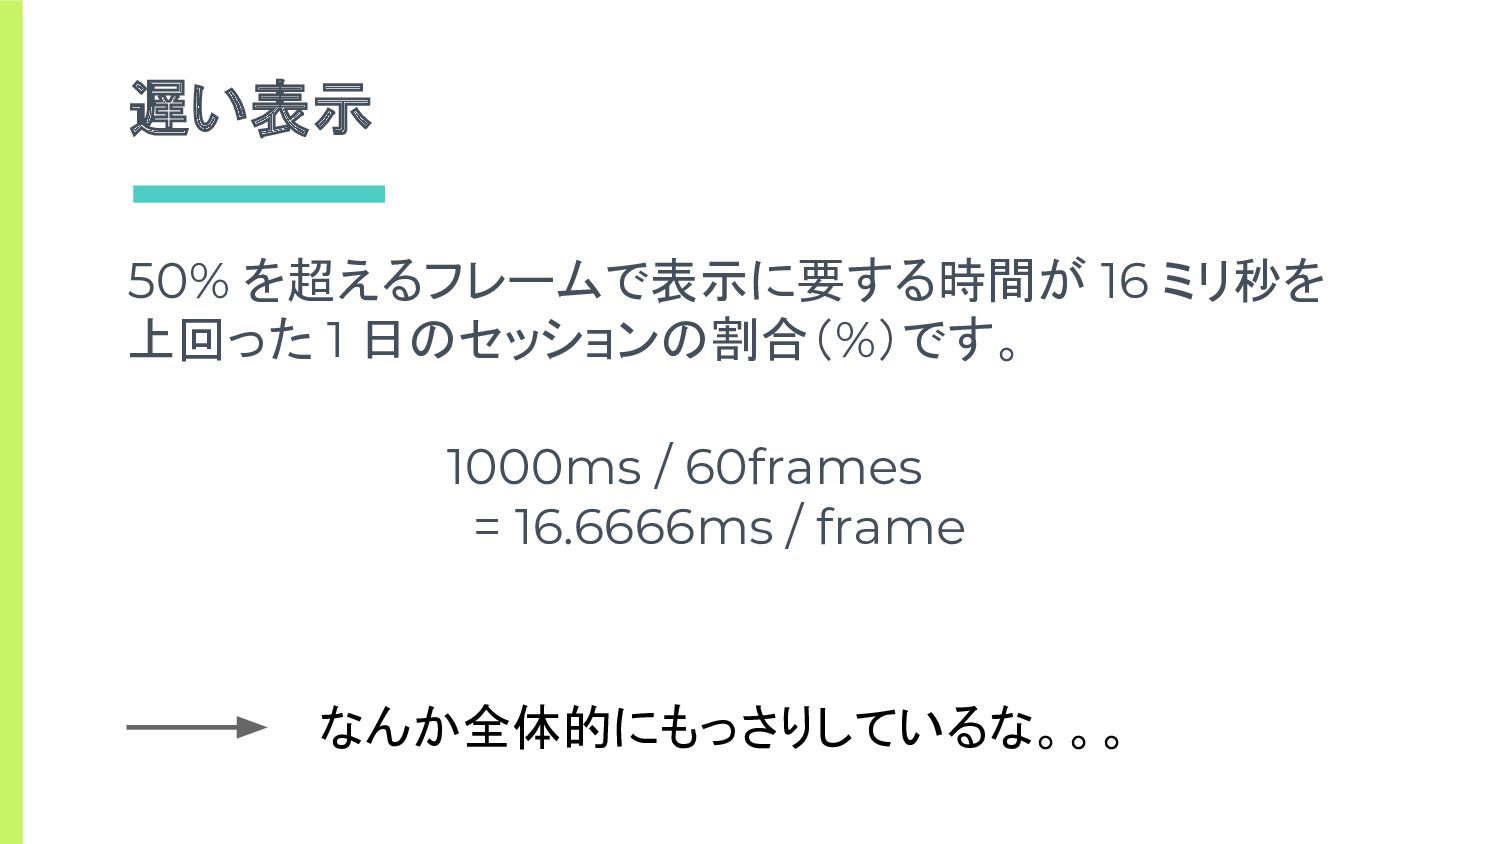
遅い表示 50% を超えるフレームで表示に要する時間が 16 ミリ秒を 上回った 1 日のセッションの割合(%)です。 1000ms /
60frames = 16.6666ms / frame なんか全体的にもっさりしているな。。。
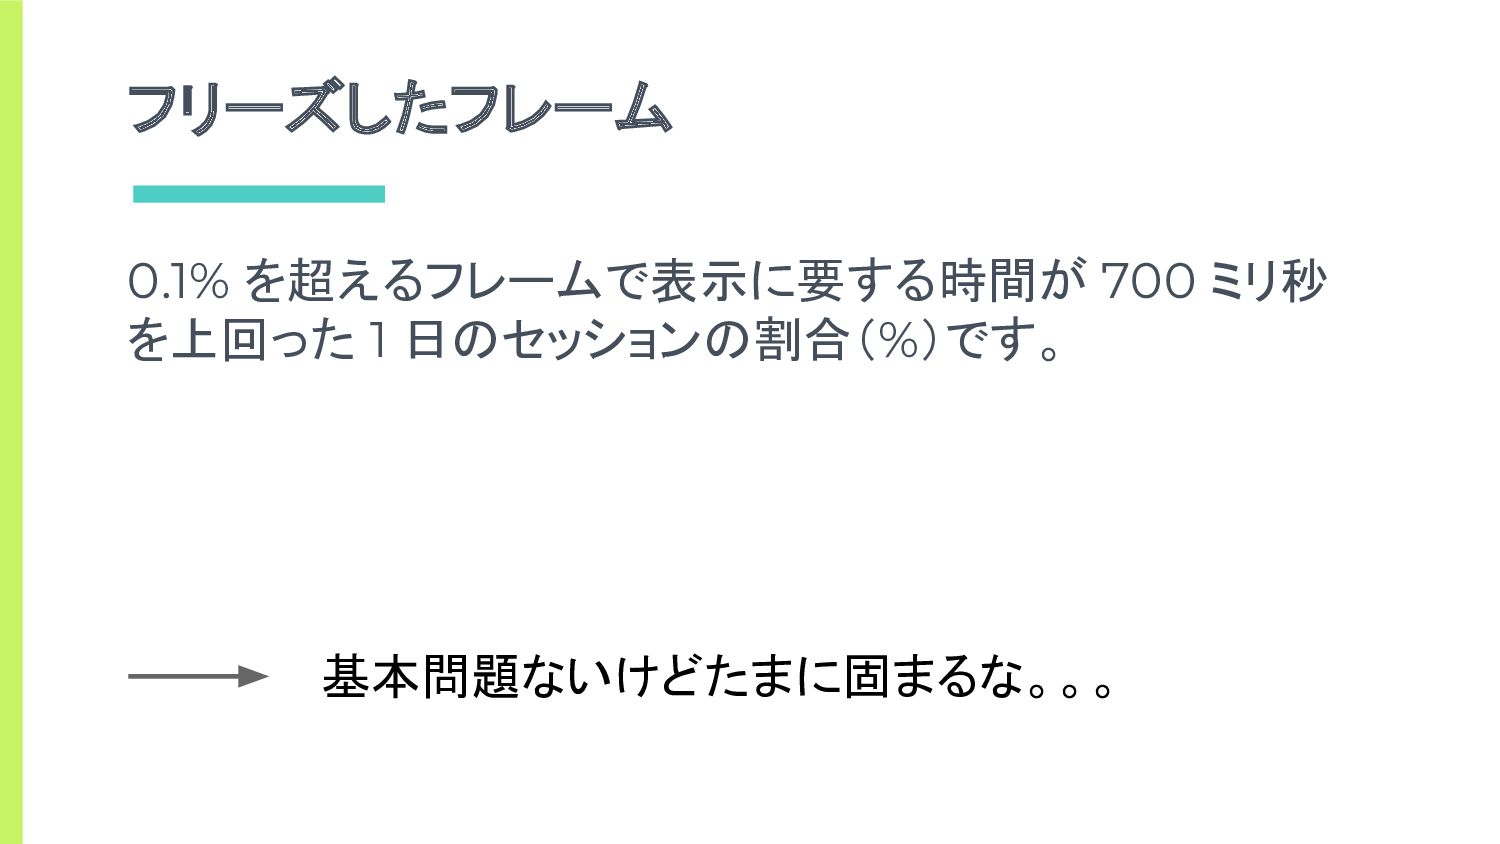
フリーズしたフレーム 0.1% を超えるフレームで表示に要する時間が 700 ミリ秒 を上回った 1 日のセッションの割合(%)です。 基本問題ないけどたまに固まるな。。。
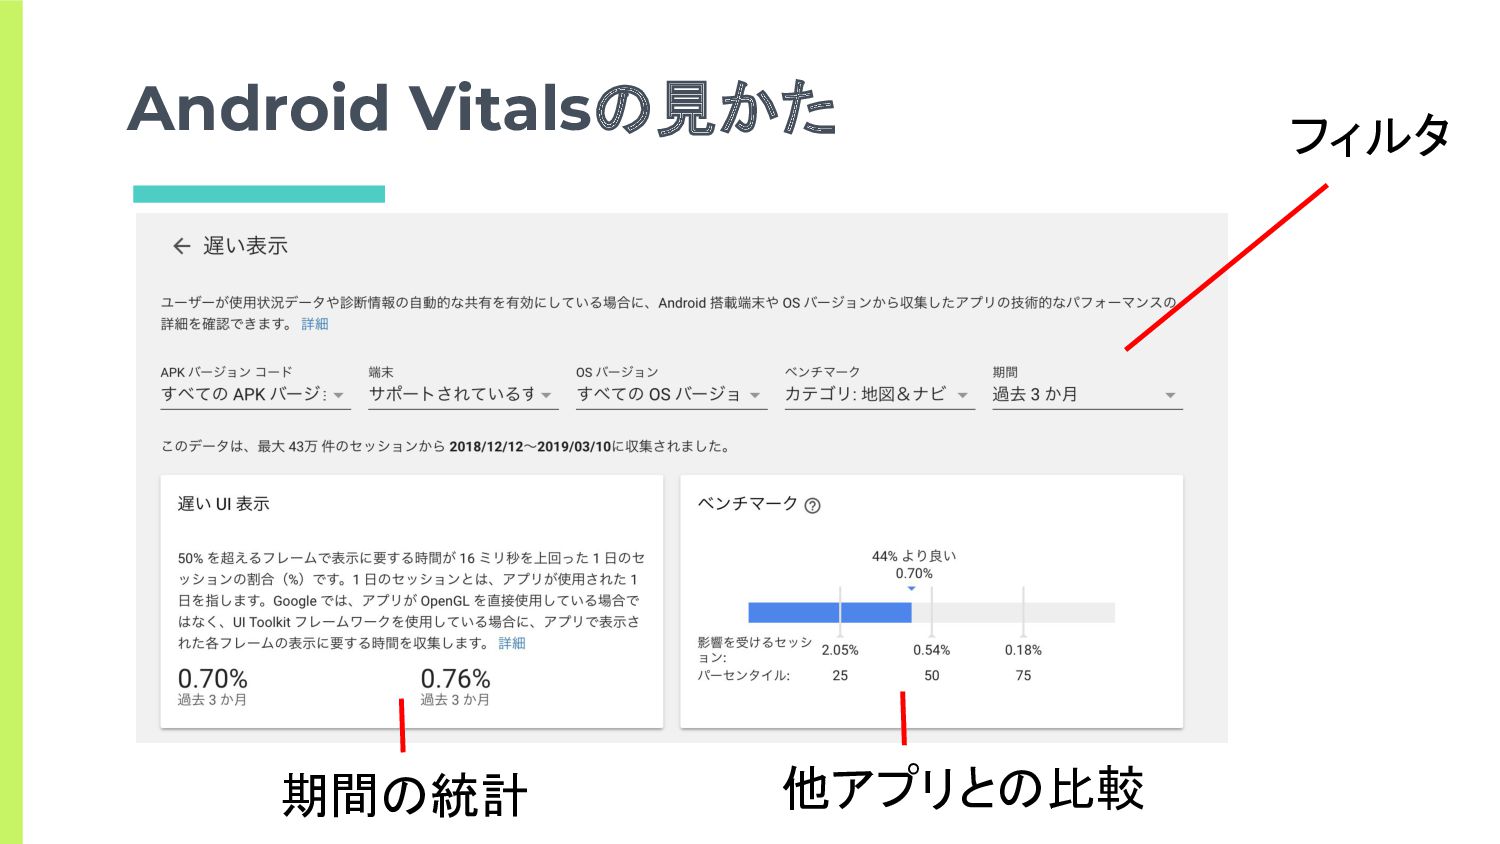
Android Vitalsの見かた フィルタ 期間の統計 他アプリとの比較
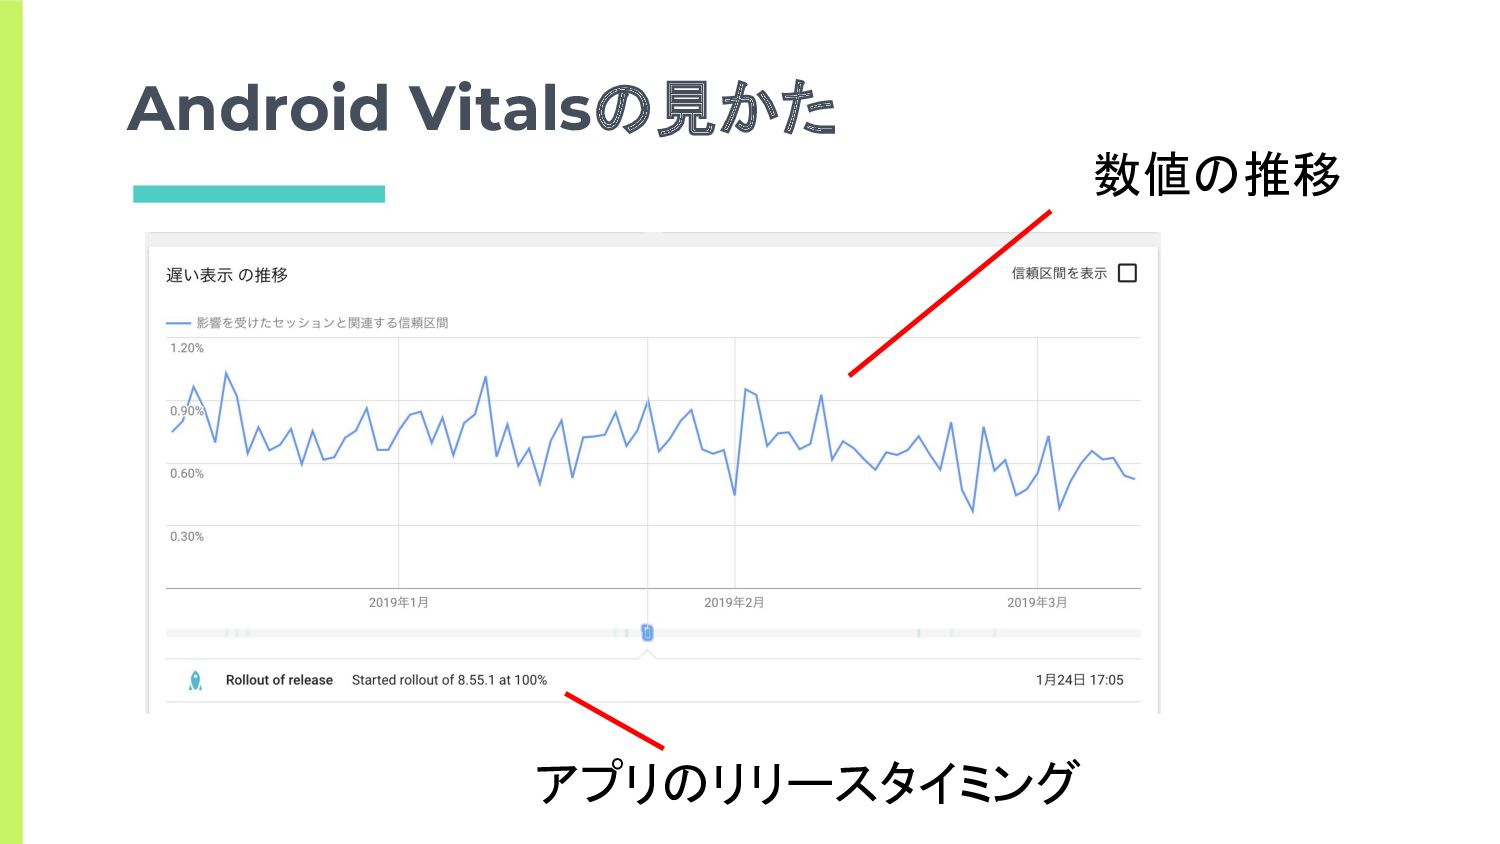
Android Vitalsの見かた 数値の推移 アプリのリリースタイミング
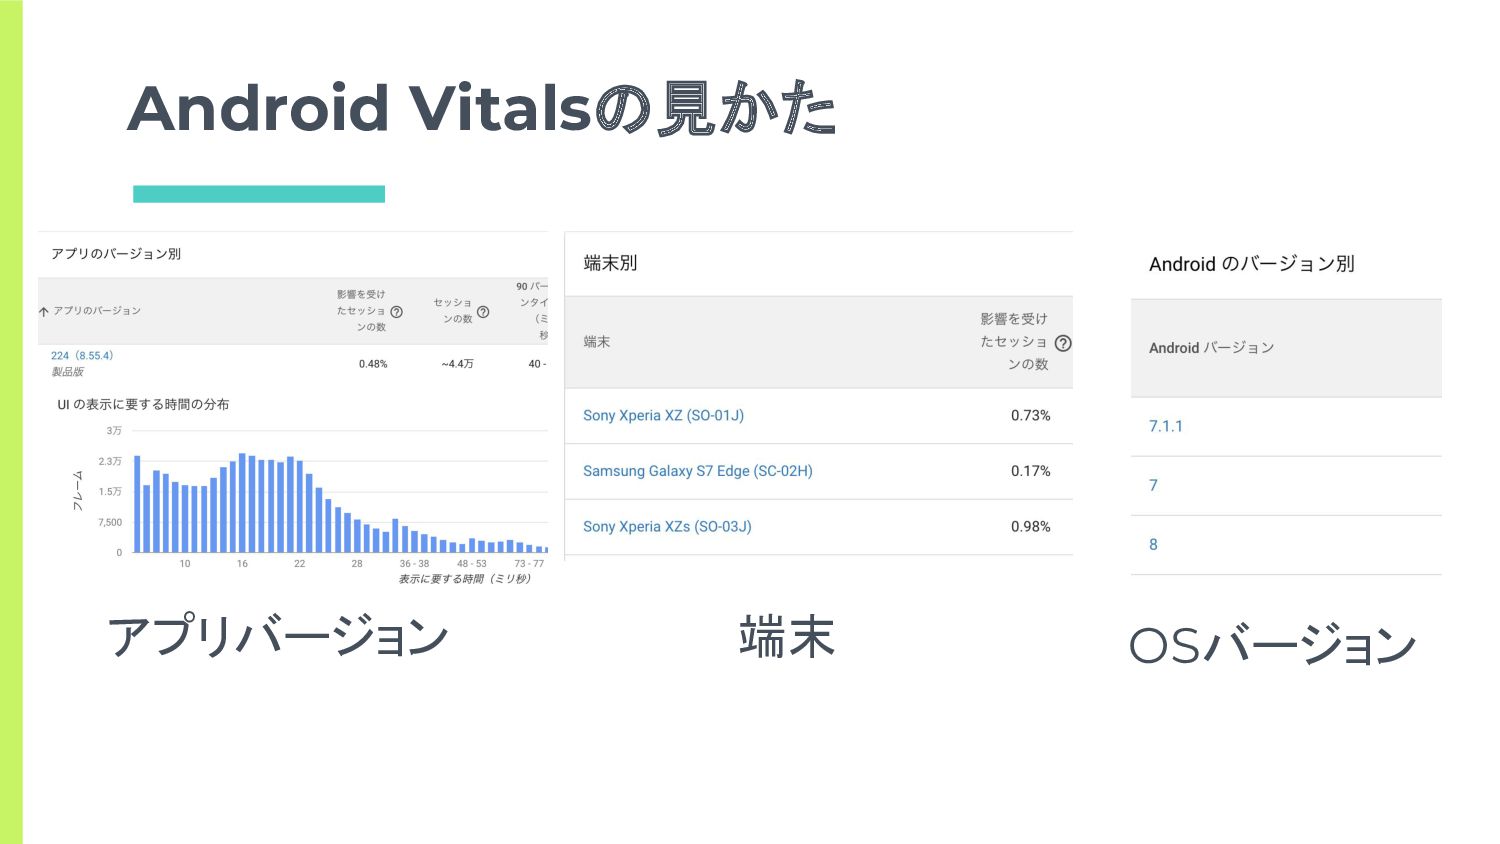
Android Vitalsの見かた アプリバージョン 端末 OSバージョン
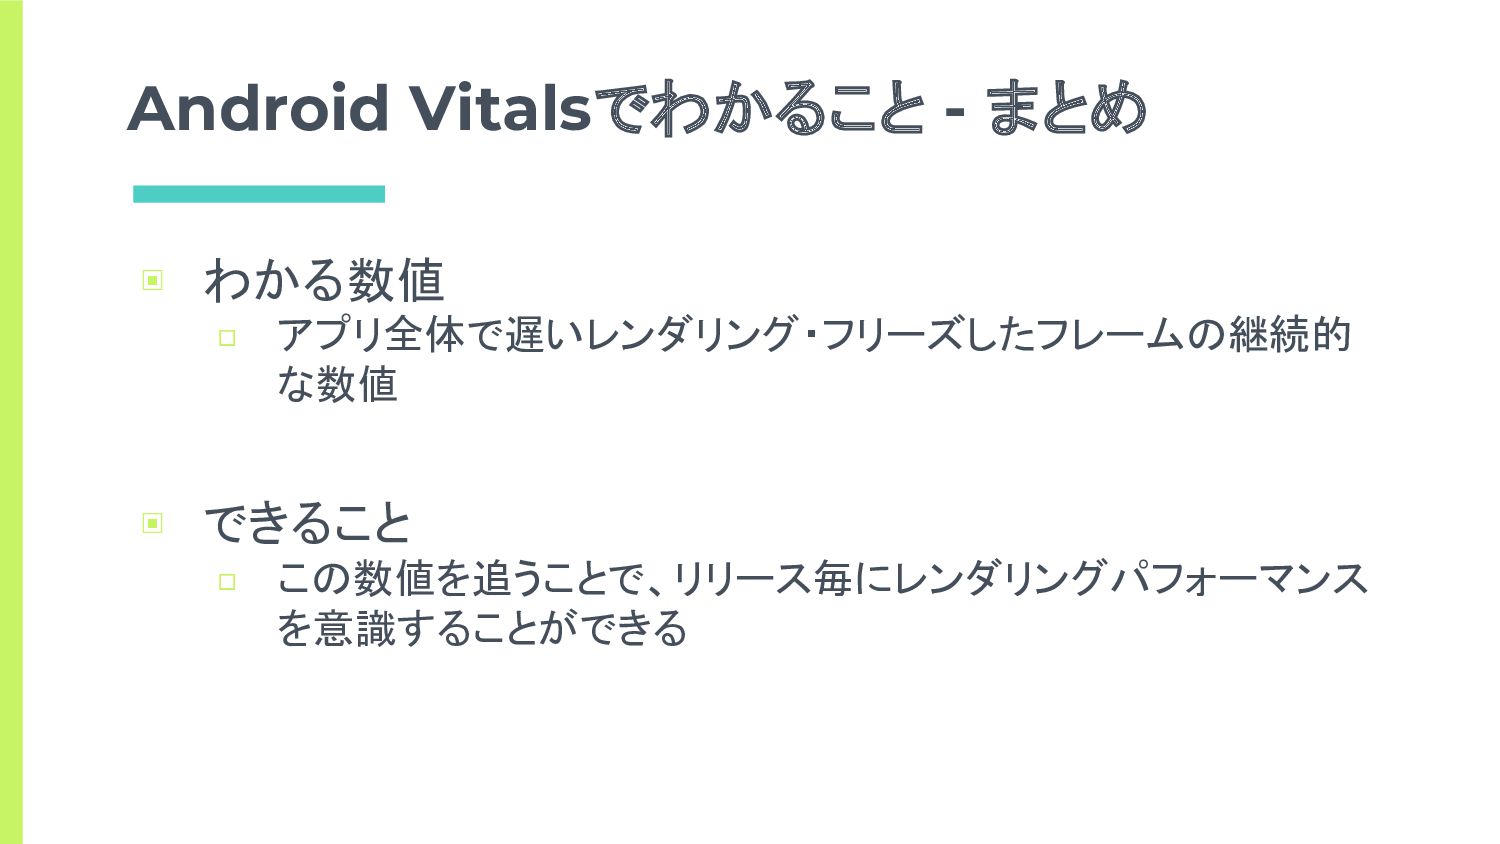
Android Vitalsでわかること - まとめ ▣ わかる数値 □ アプリ全体で遅いレンダリング・フリーズしたフレームの継続的 な数値 ▣
できること □ この数値を追うことで、リリース毎にレンダリングパフォーマンス を意識することができる
NAVITIMEアプリ
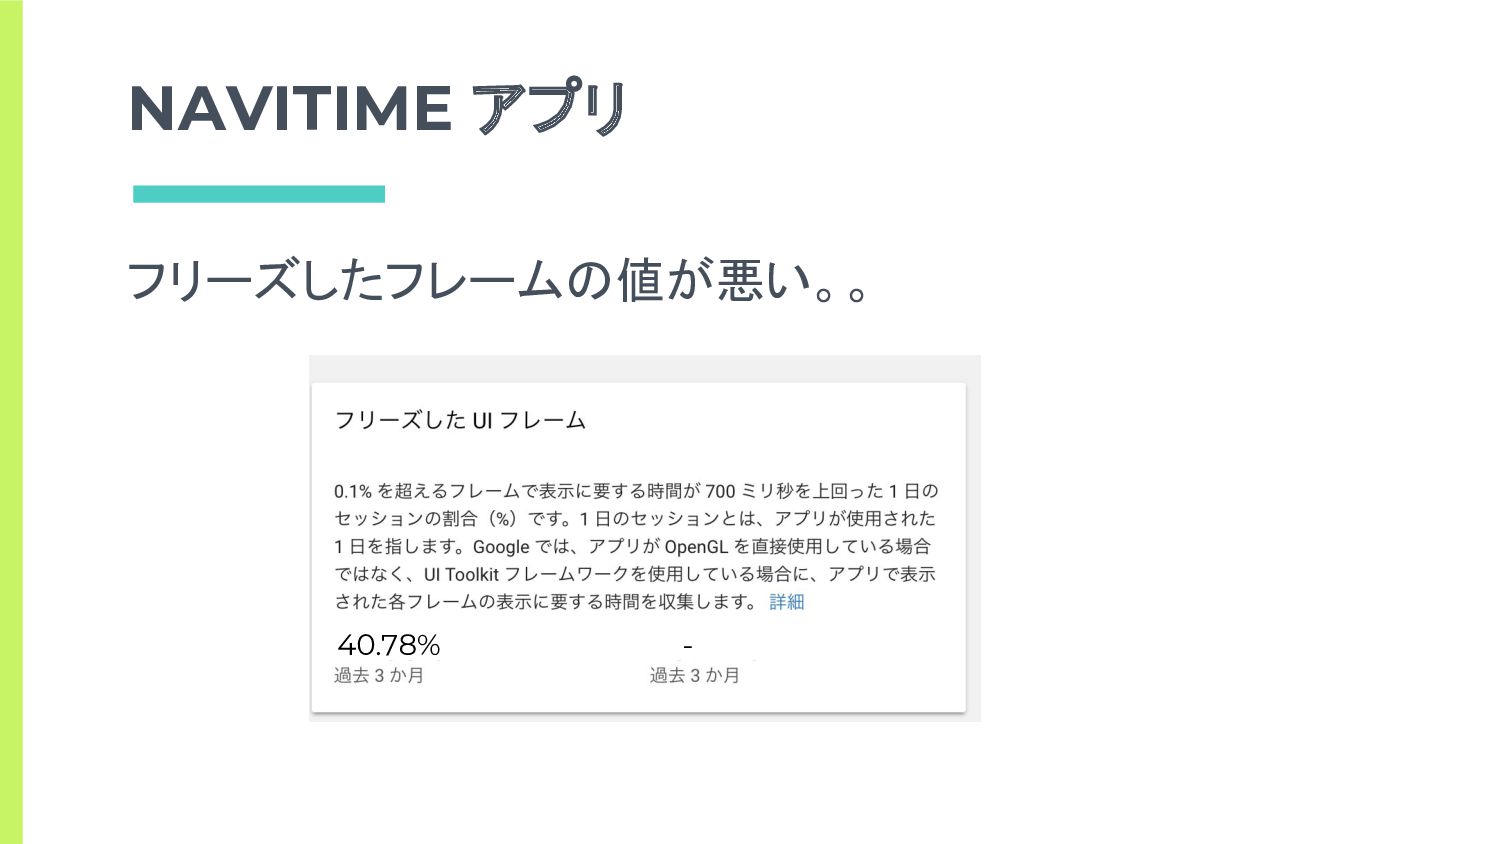
NAVITIME アプリ フリーズしたフレームの値が悪い。。 40.78% -
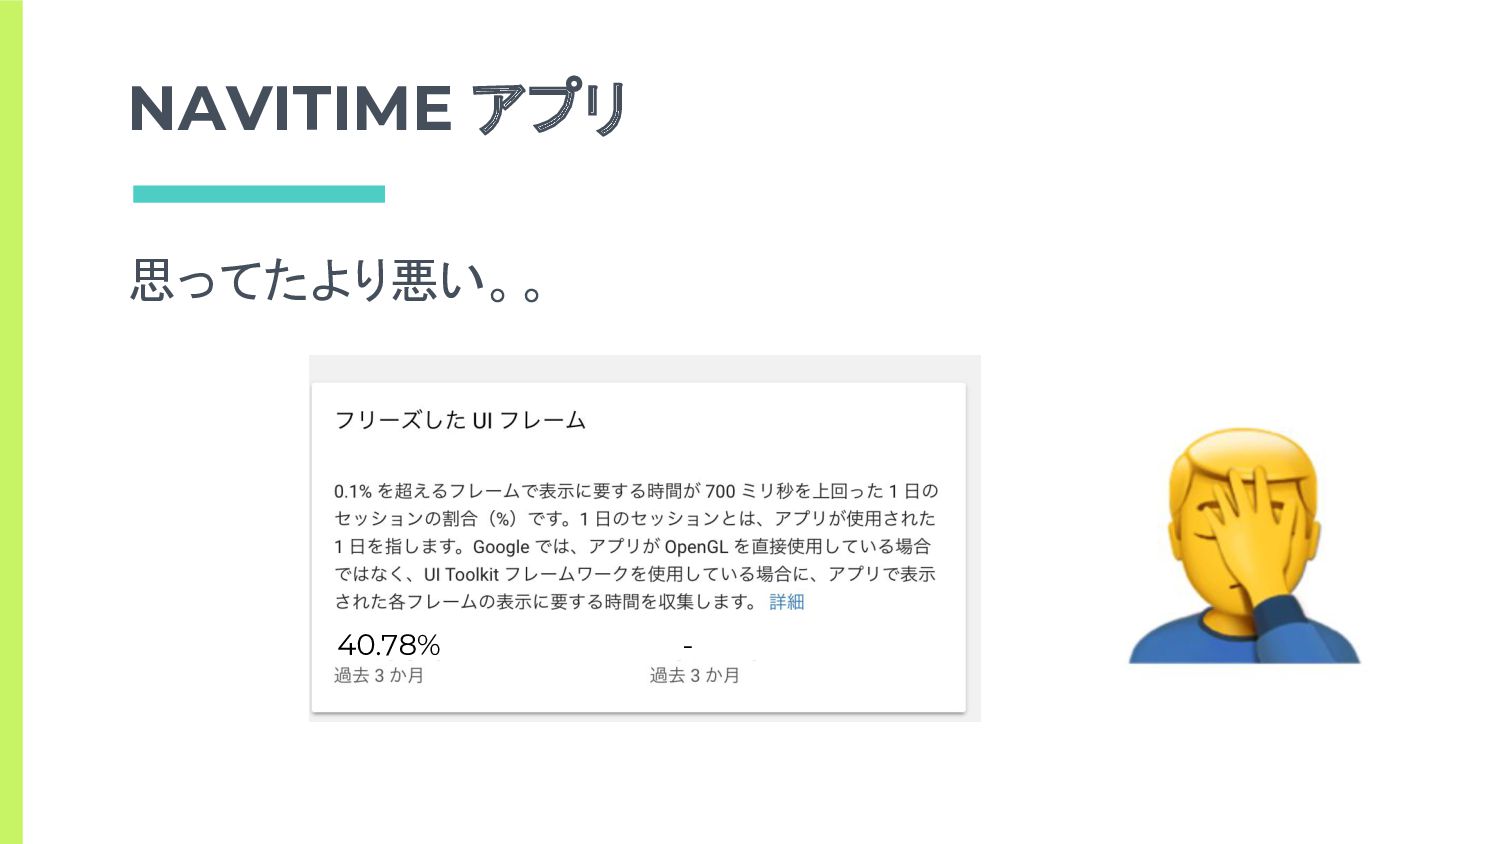
NAVITIME アプリ 思ってたより悪い。。 40.78% -
NAVITIME アプリ フリーズしたフレームの値を改善するための調査の話に続 きます。
どこの画面が遅いのかを知る
どこの画面が遅いのか Firebase Performance Monitoring
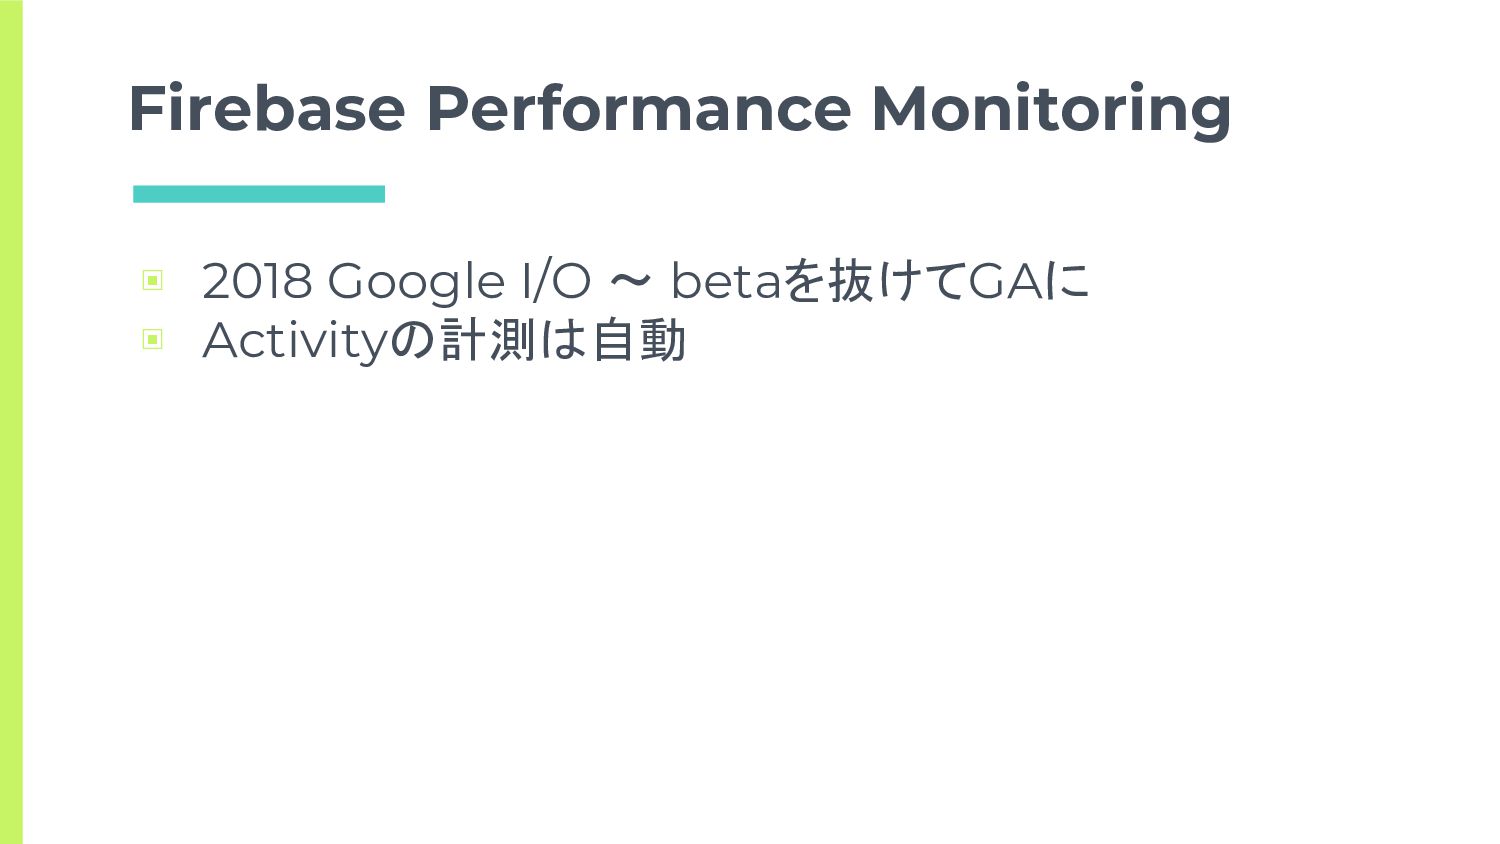
Firebase Performance Monitoring ▣ 2018 Google I/O 〜 betaを抜けてGAに ▣
Activityの計測は自動
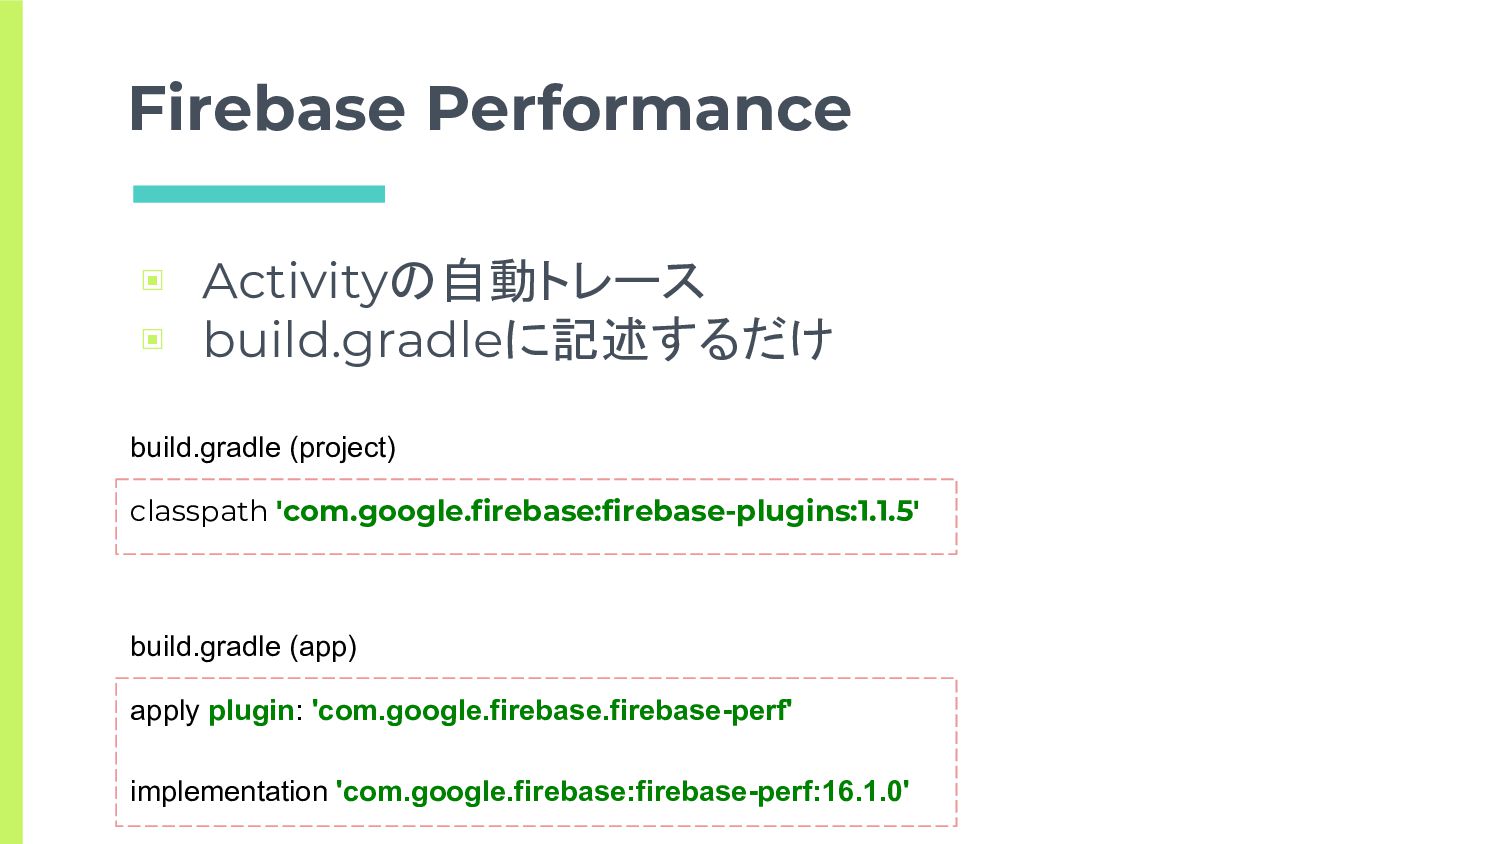
Firebase Performance ▣ Activityの自動トレース ▣ build.gradleに記述するだけ classpath 'com.google.firebase:firebase-plugins:1.1.5' build.gradle (project)
apply plugin: 'com.google.firebase.firebase-perf' implementation 'com.google.firebase:firebase-perf:16.1.0' build.gradle (app)
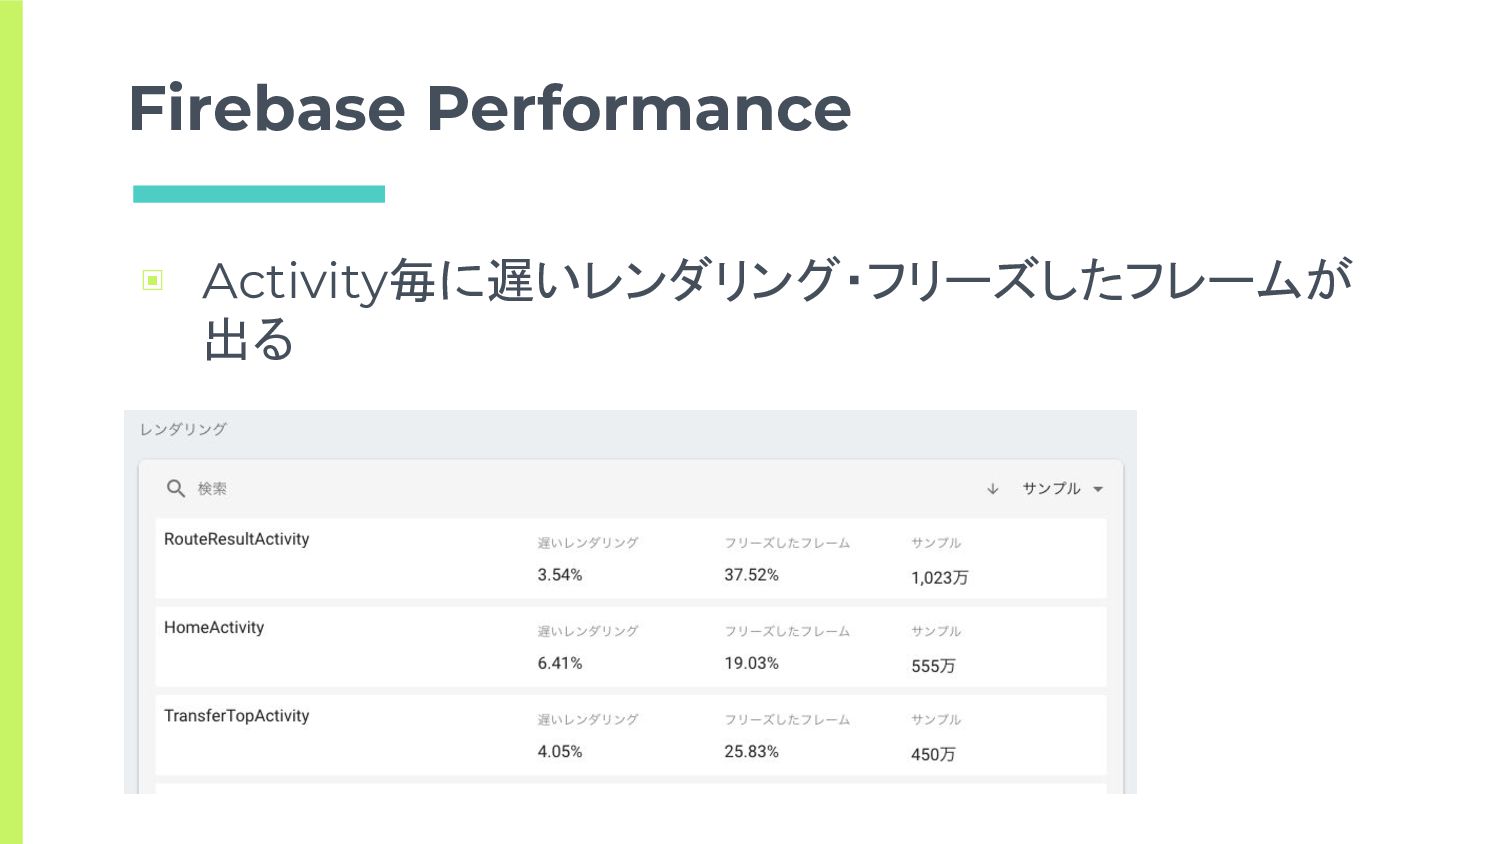
Firebase Performance ▣ Activity毎に遅いレンダリング・フリーズしたフレームが 出る
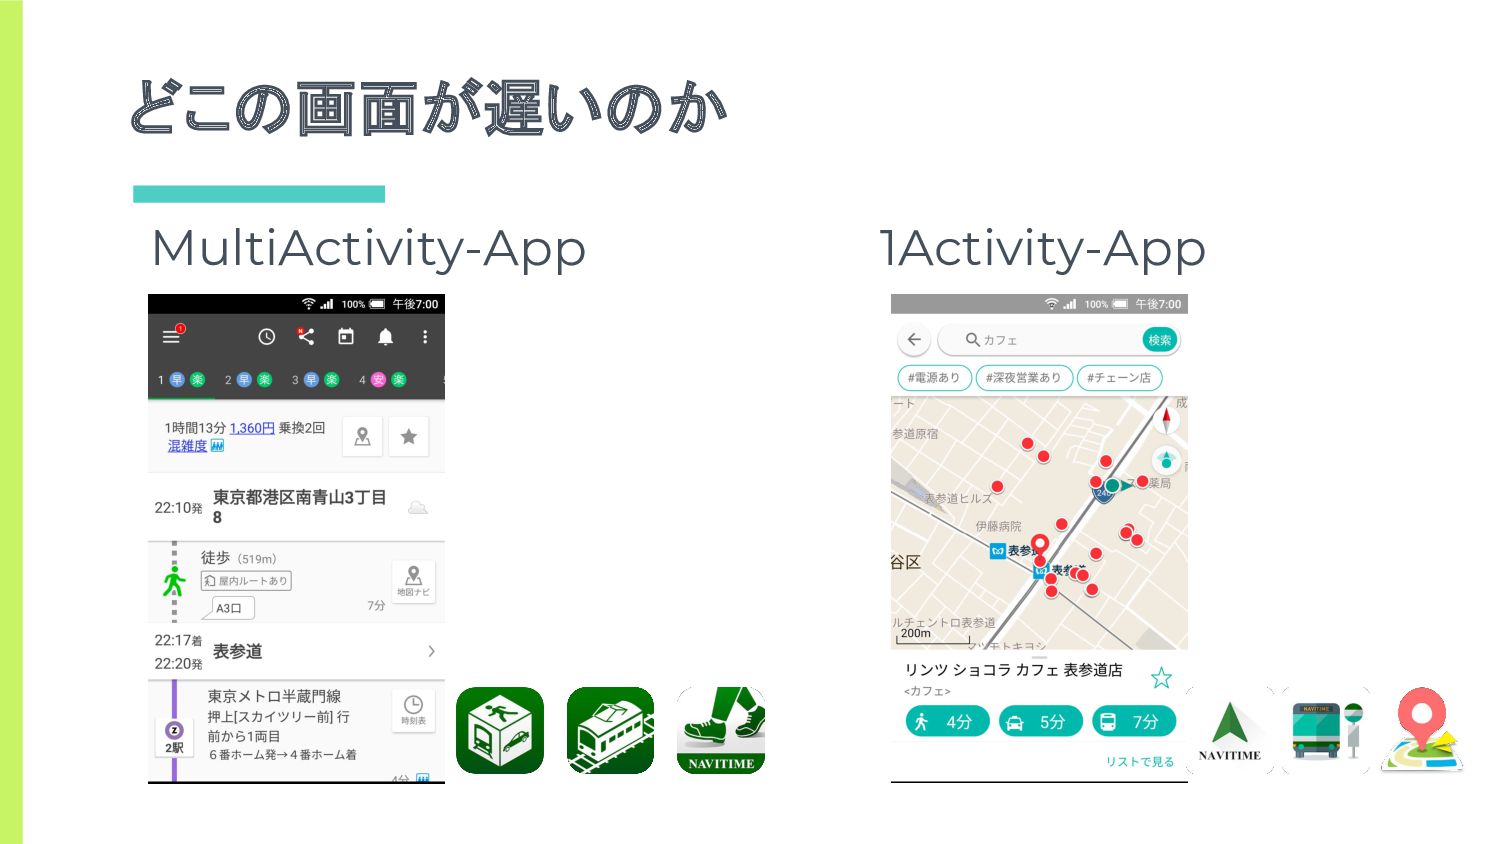
どこの画面が遅いのか MultiActivity-App 1Activity-App
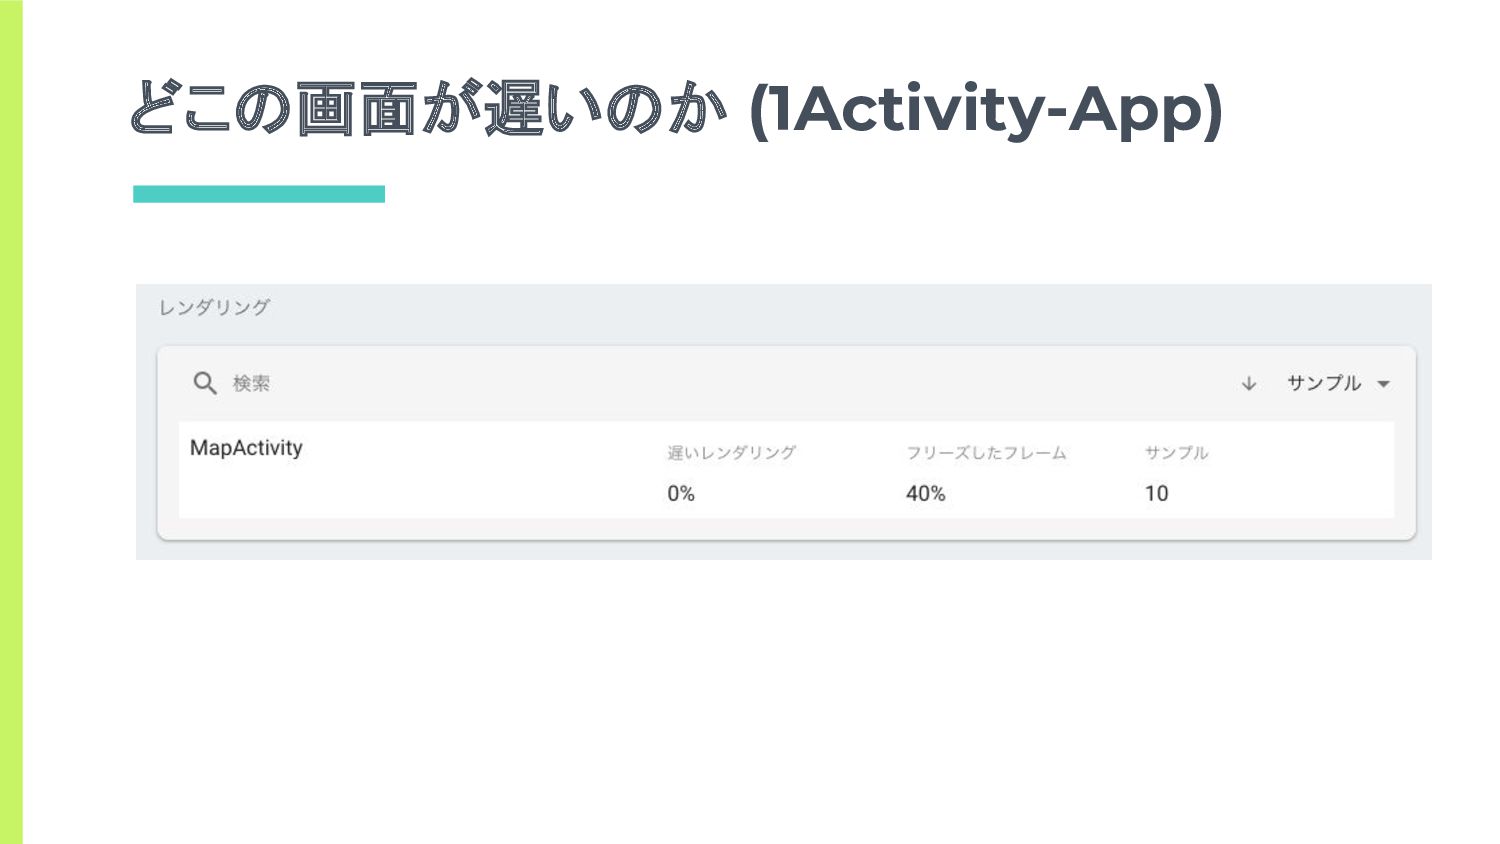
どこの画面が遅いのか (1Activity-App)
どこの画面が遅いのか (1Activity-App) ▣ Firebase Performanceのカスタムトレースを使う
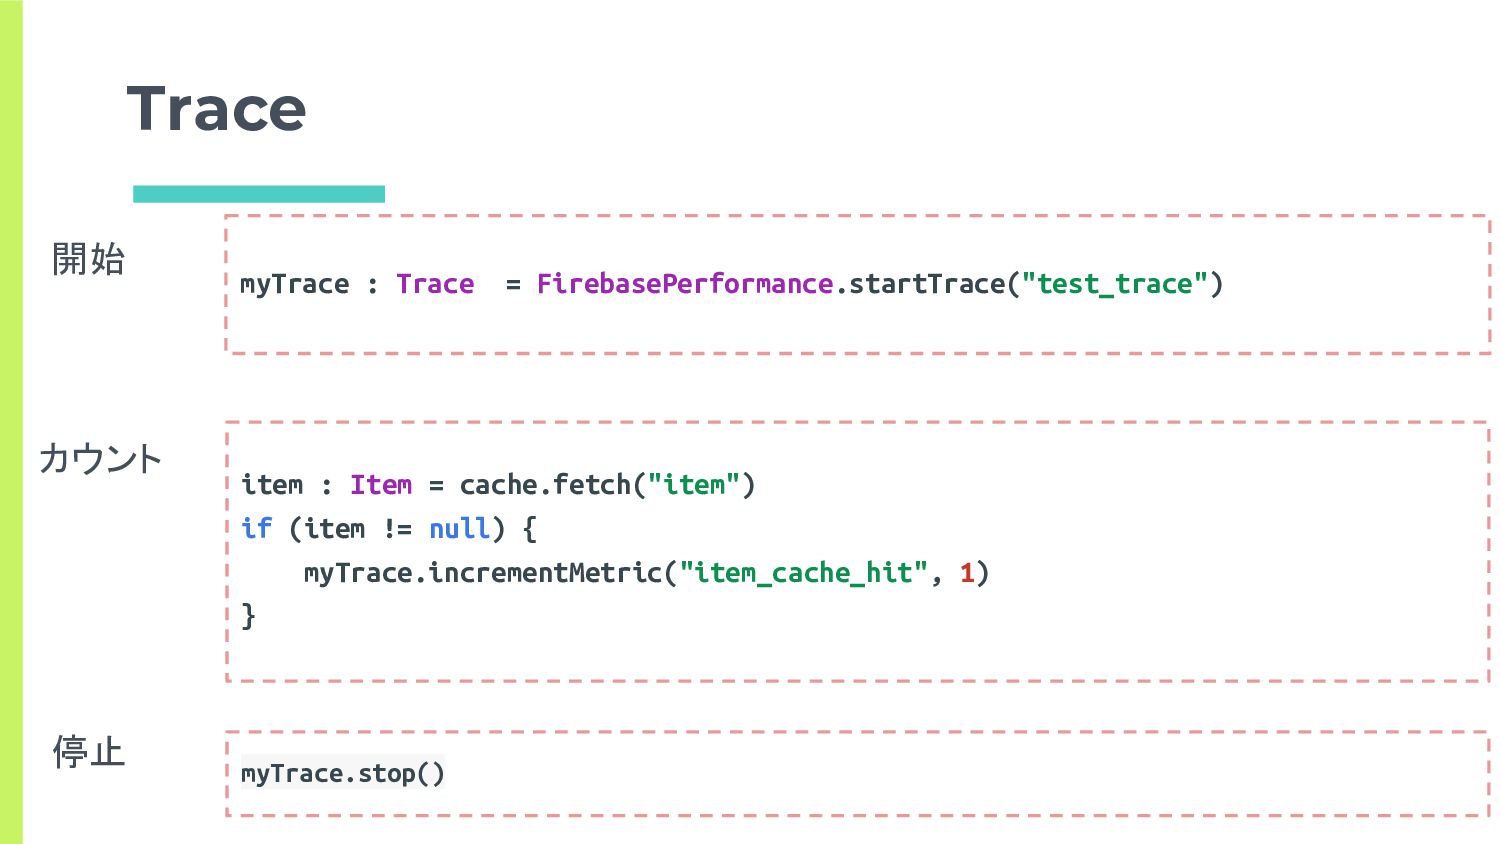
Trace myTrace : Trace = FirebasePerformance.startTrace("test_trace") item : Item =
cache.fetch("item") if (item != null) { myTrace.incrementMetric("item_cache_hit", 1) } myTrace.stop() 開始 カウント 停止
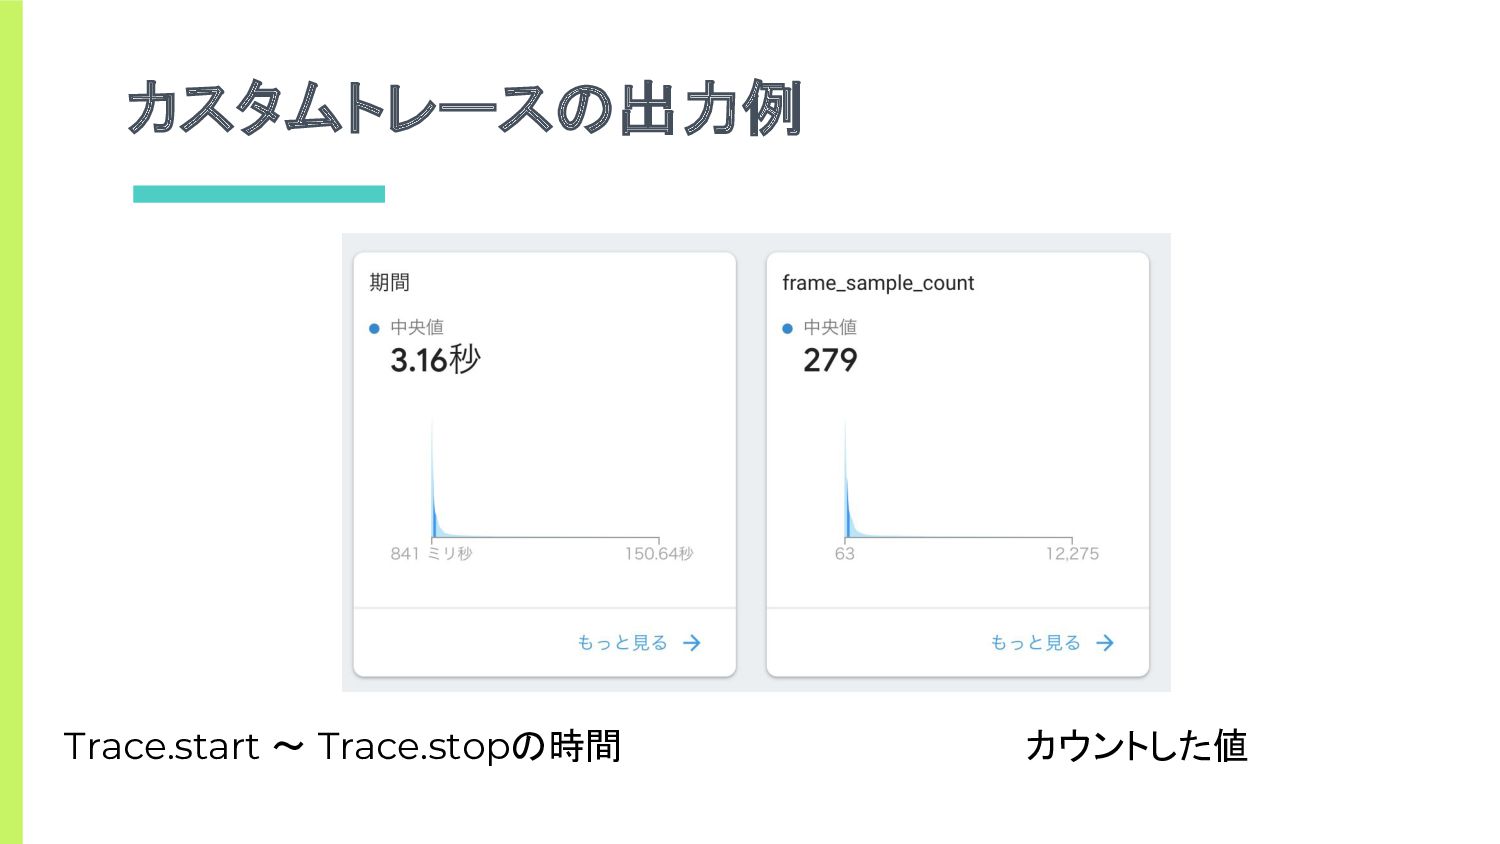
カスタムトレースの出力例 Trace.start 〜 Trace.stopの時間 カウントした値
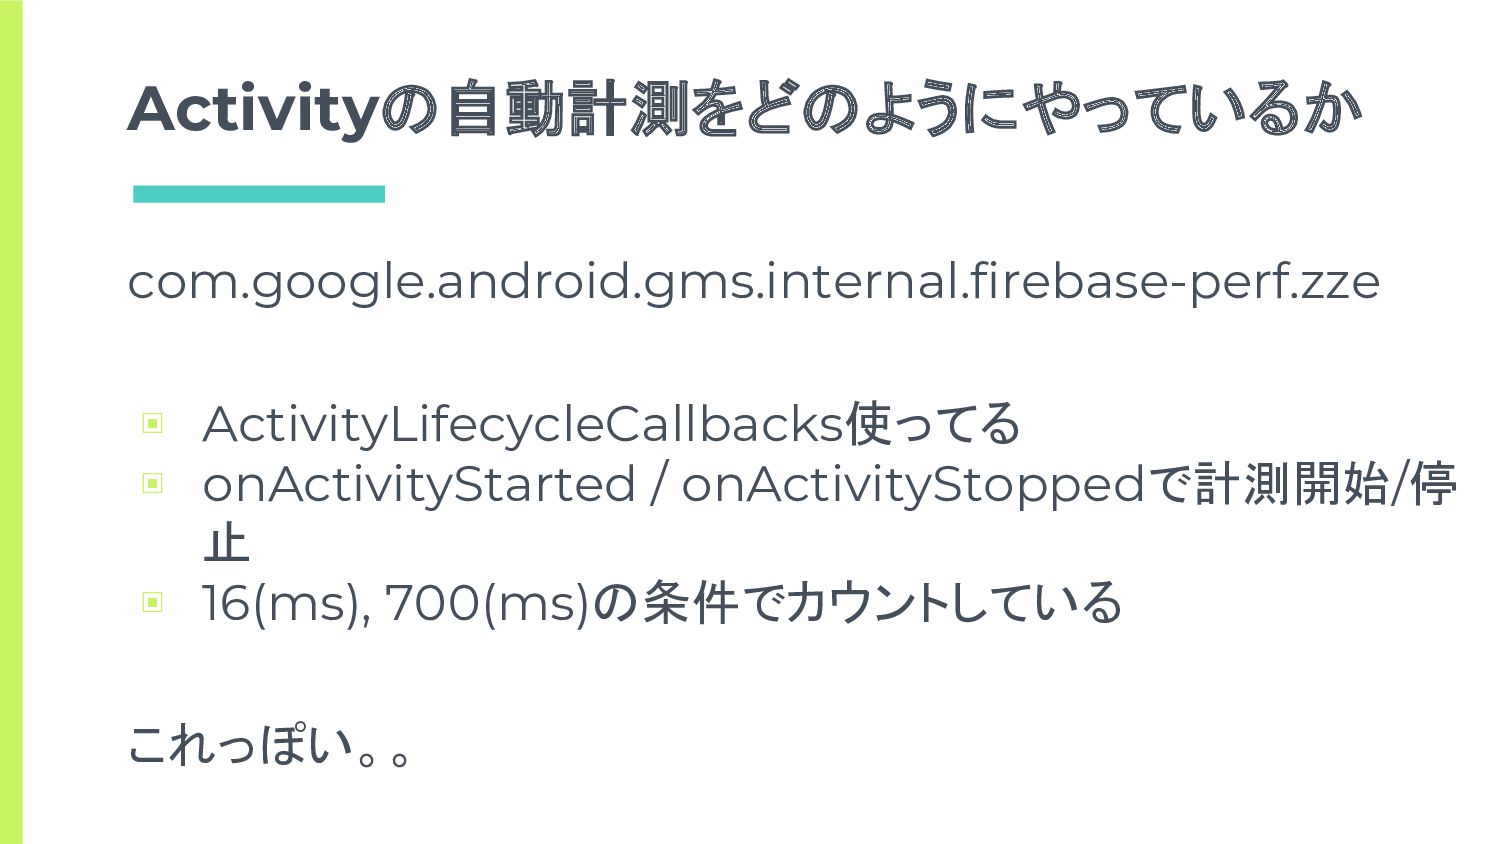
Activityの自動計測をどのようにやっているか com.google.android.gms.internal.firebase-perf.zze ▣ ActivityLifecycleCallbacks使ってる ▣ onActivityStarted / onActivityStoppedで計測開始/停 止 ▣
16(ms), 700(ms)の条件でカウントしている これっぽい。。
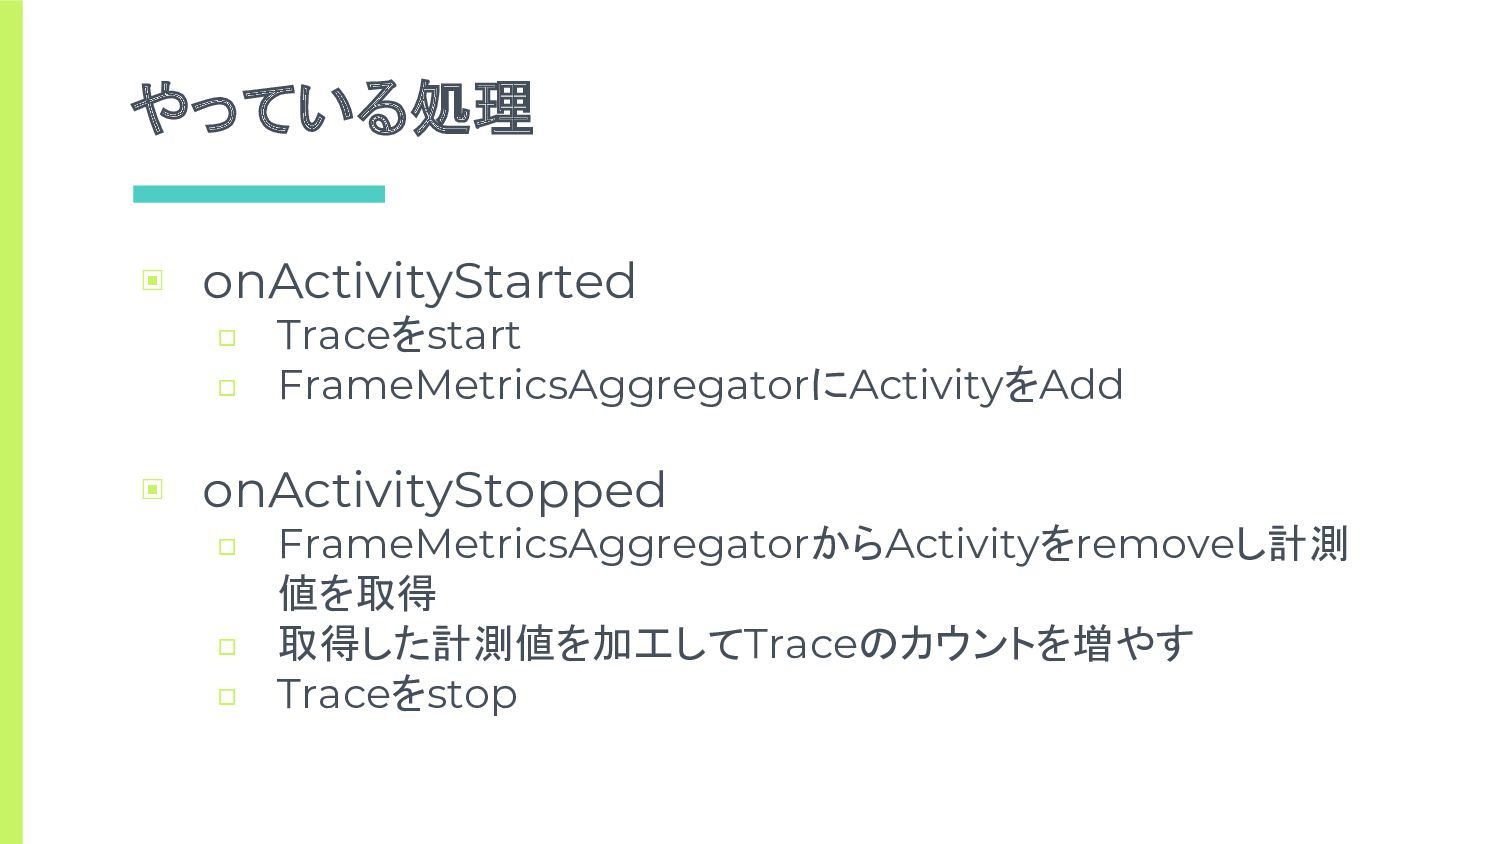
やっている処理 ▣ onActivityStarted □ Traceをstart □ FrameMetricsAggregatorにActivityをAdd ▣ onActivityStopped □
FrameMetricsAggregatorからActivityをremoveし計測 値を取得 □ 取得した計測値を加工してTraceのカウントを増やす □ Traceをstop
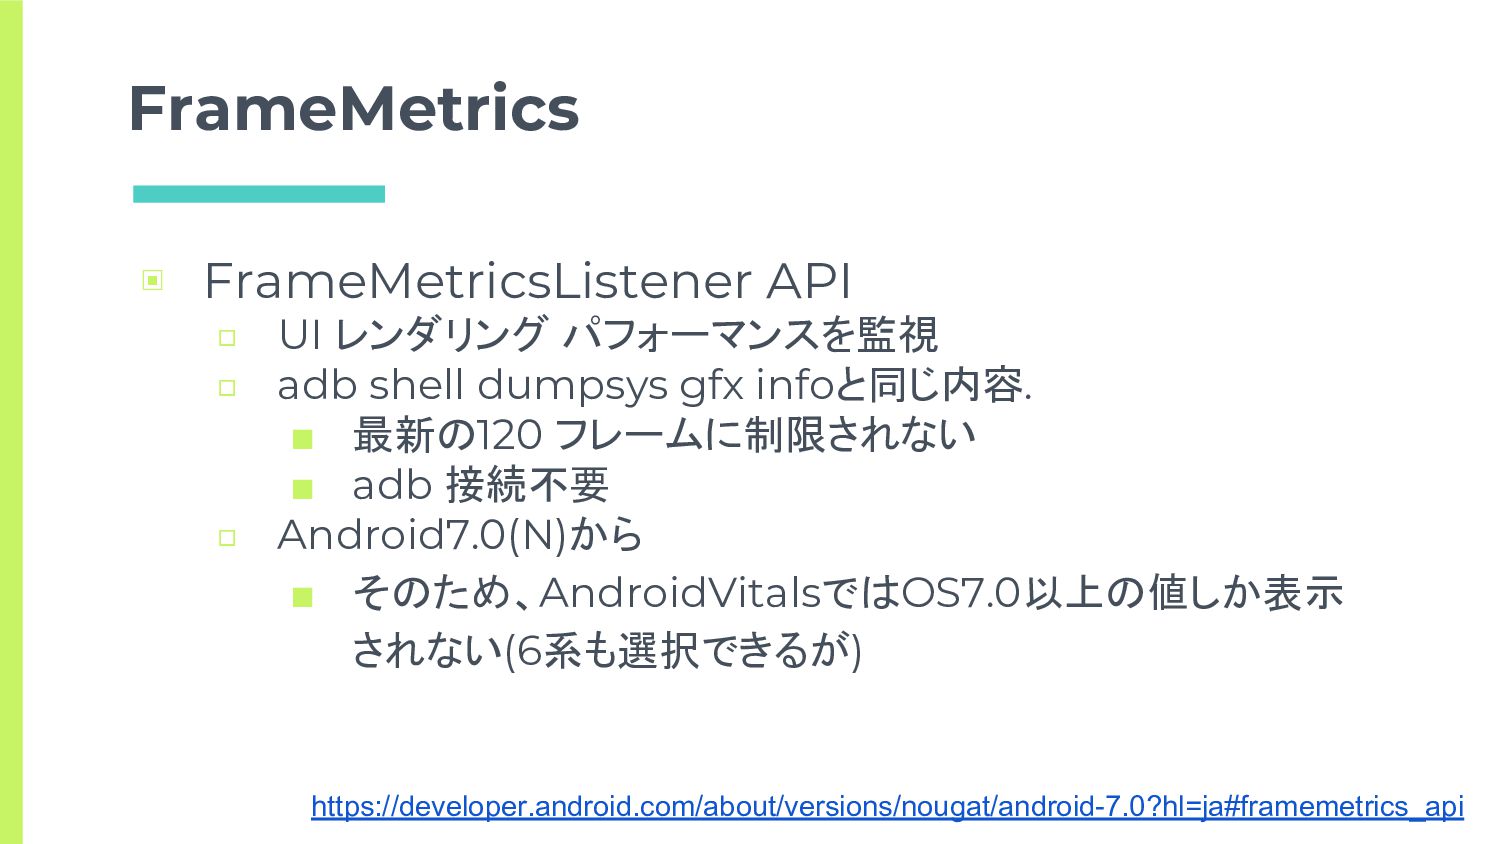
FrameMetrics ▣ FrameMetricsListener API □ UI レンダリング パフォーマンスを監視 □ adb
shell dumpsys gfx infoと同じ内容. ▪ 最新の120 フレームに制限されない ▪ adb 接続不要 □ Android7.0(N)から ▪ そのため、AndroidVitalsではOS7.0以上の値しか表示 されない(6系も選択できるが) https://developer.android.com/about/versions/nougat/android-7.0?hl=ja#framemetrics_api
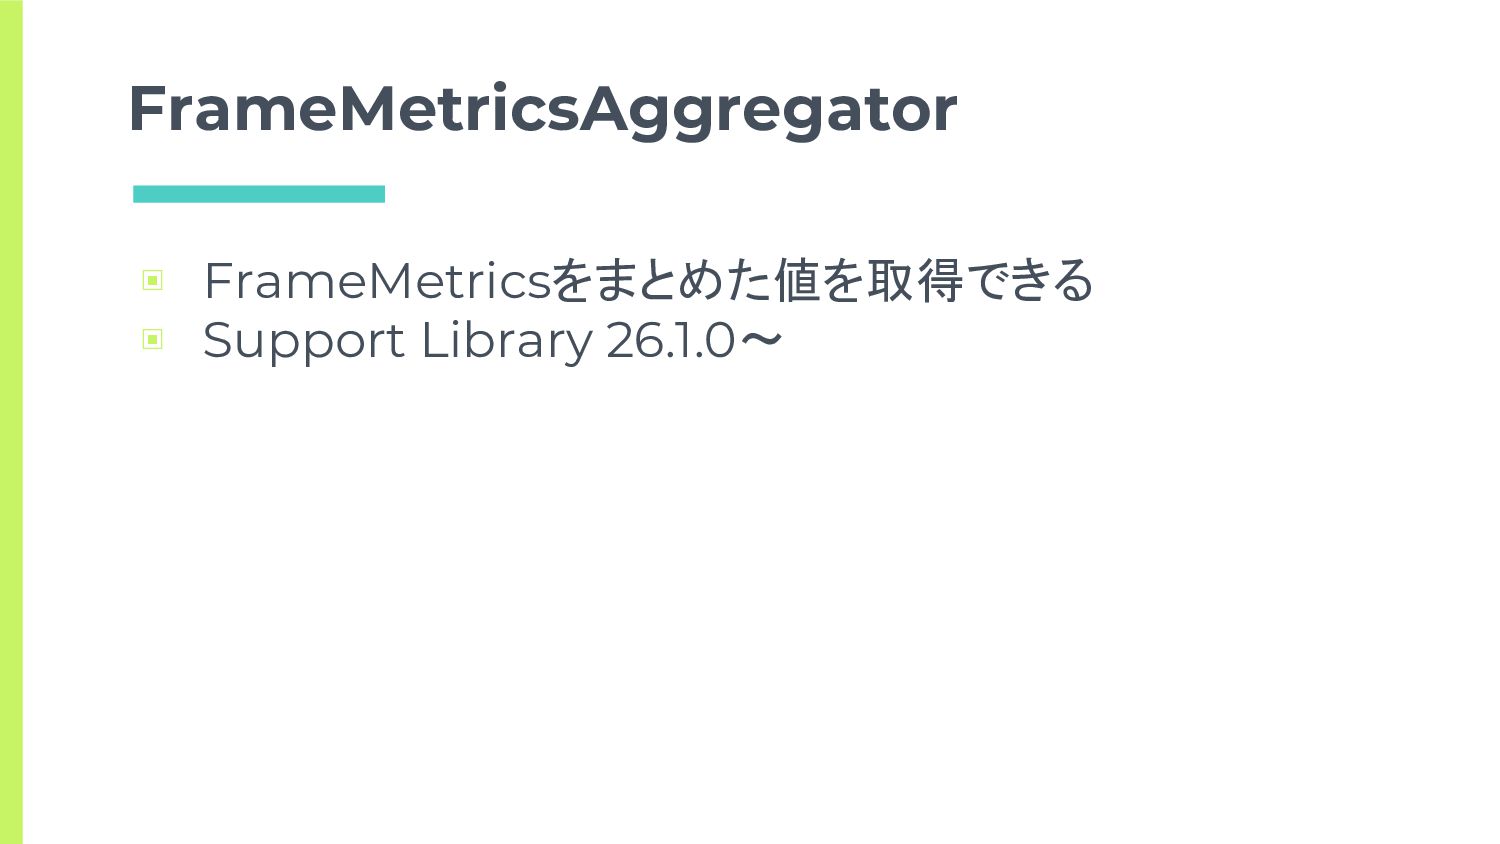
FrameMetricsAggregator ▣ FrameMetricsをまとめた値を取得できる ▣ Support Library 26.1.0〜
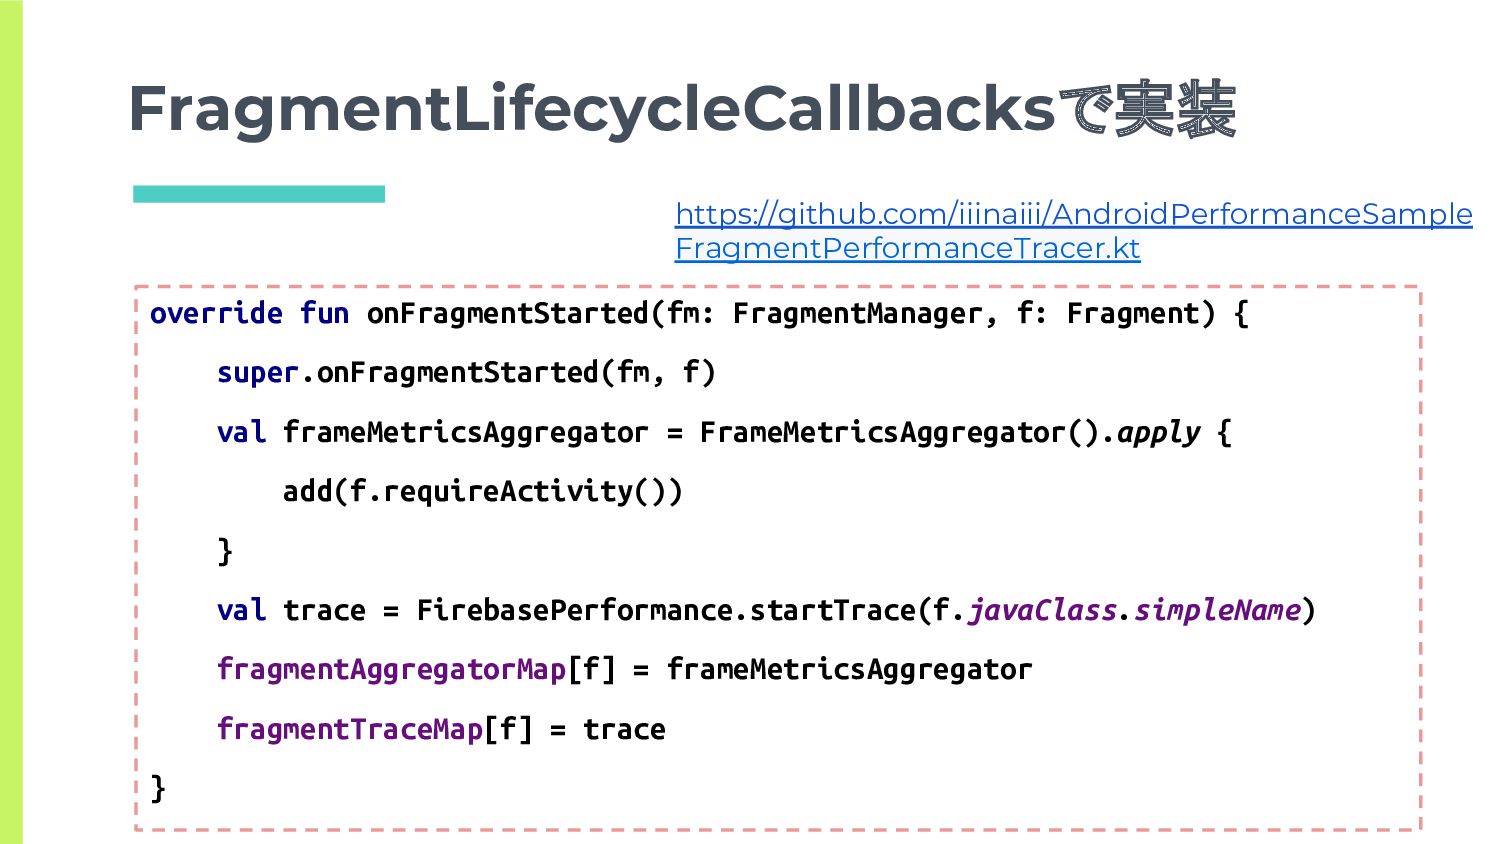
FragmentLifecycleCallbacksで実装 override fun onFragmentStarted(fm: FragmentManager, f: Fragment) { super.onFragmentStarted(fm, f)
val frameMetricsAggregator = FrameMetricsAggregator().apply { add(f.requireActivity()) } val trace = FirebasePerformance.startTrace(f.javaClass.simpleName) fragmentAggregatorMap[f] = frameMetricsAggregator fragmentTraceMap[f] = trace } https://github.com/iiinaiii/AndroidPerformanceSample FragmentPerformanceTracer.kt
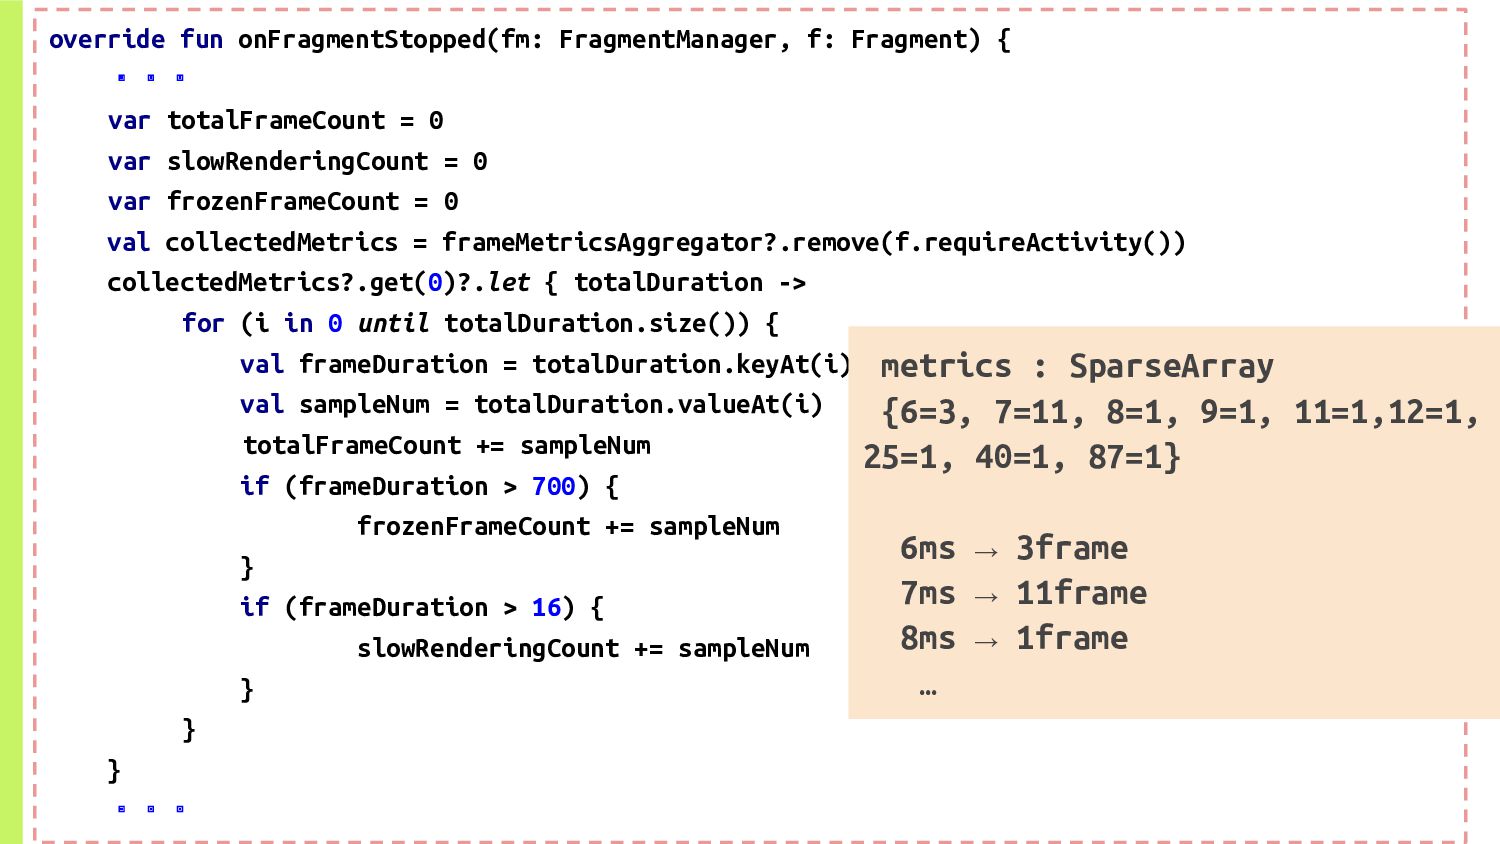
override fun onFragmentStopped(fm: FragmentManager, f: Fragment) { ・・・ var totalFrameCount
= 0 var slowRenderingCount = 0 var frozenFrameCount = 0 val collectedMetrics = frameMetricsAggregator?.remove(f.requireActivity()) collectedMetrics?.get(0)?.let { totalDuration -> for (i in 0 until totalDuration.size()) { val frameDuration = totalDuration.keyAt(i) val sampleNum = totalDuration.valueAt(i) totalFrameCount += sampleNum if (frameDuration > 700) { frozenFrameCount += sampleNum } if (frameDuration > 16) { slowRenderingCount += sampleNum } } } ・・・ metrics : SparseArray {6=3, 7=11, 8=1, 9=1, 11=1,12=1, 25=1, 40=1, 87=1} 6ms → 3frame 7ms → 11frame 8ms → 1frame …
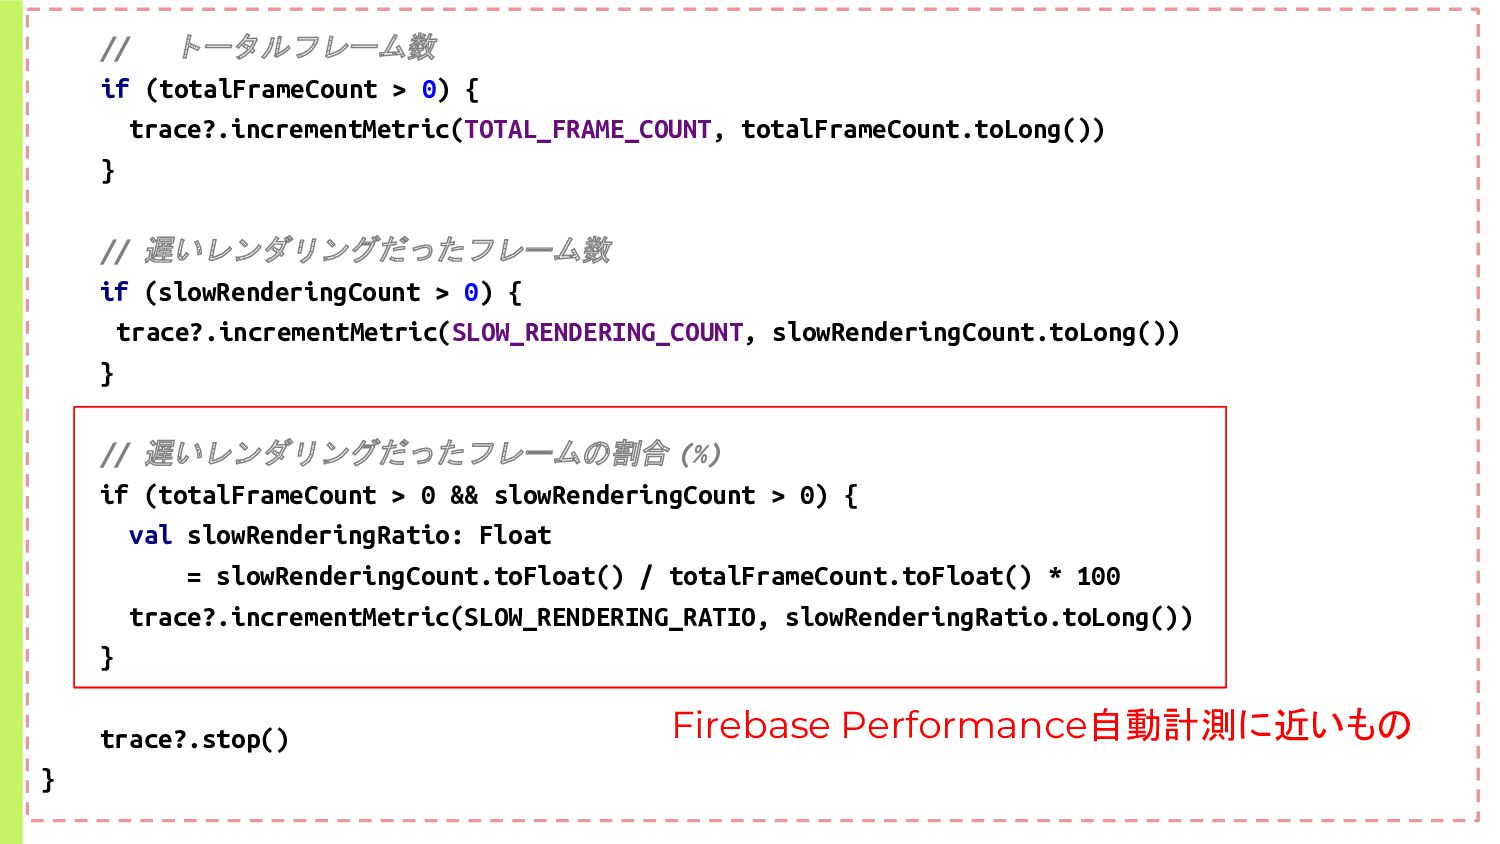
// トータルフレーム数 if (totalFrameCount > 0) { trace?.incrementMetric(TOTAL_FRAME_COUNT, totalFrameCount.toLong()) }
// 遅いレンダリングだったフレーム数 if (slowRenderingCount > 0) { trace?.incrementMetric(SLOW_RENDERING_COUNT, slowRenderingCount.toLong()) } // 遅いレンダリングだったフレームの割合 (%) if (totalFrameCount > 0 && slowRenderingCount > 0) { val slowRenderingRatio: Float = slowRenderingCount.toFloat() / totalFrameCount.toFloat() * 100 trace?.incrementMetric(SLOW_RENDERING_RATIO, slowRenderingRatio.toLong()) } trace?.stop() } Firebase Performance自動計測に近いもの
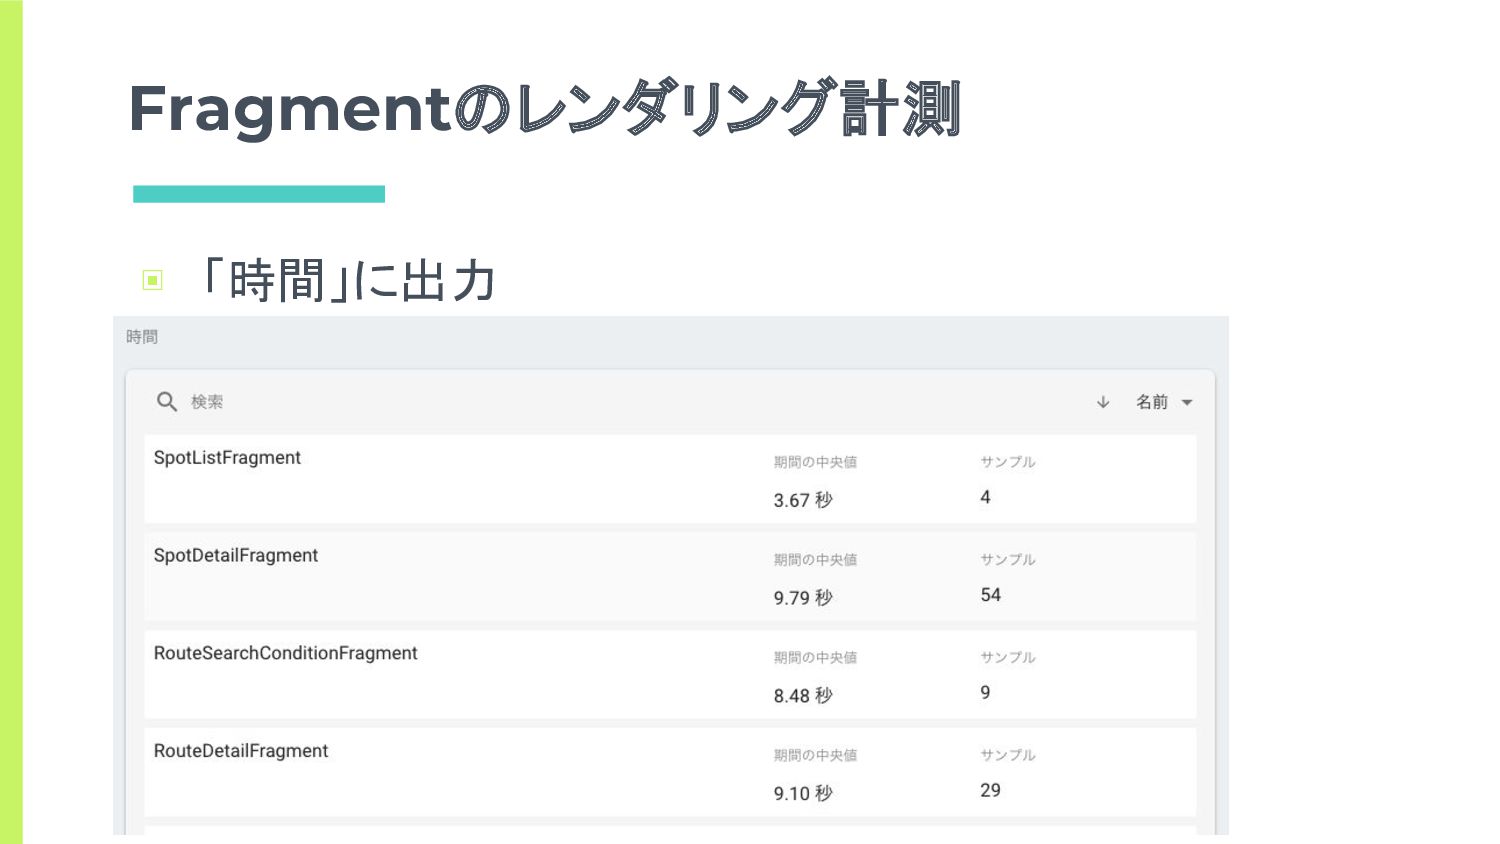
Fragmentのレンダリング計測 ▣ 「時間」に出力
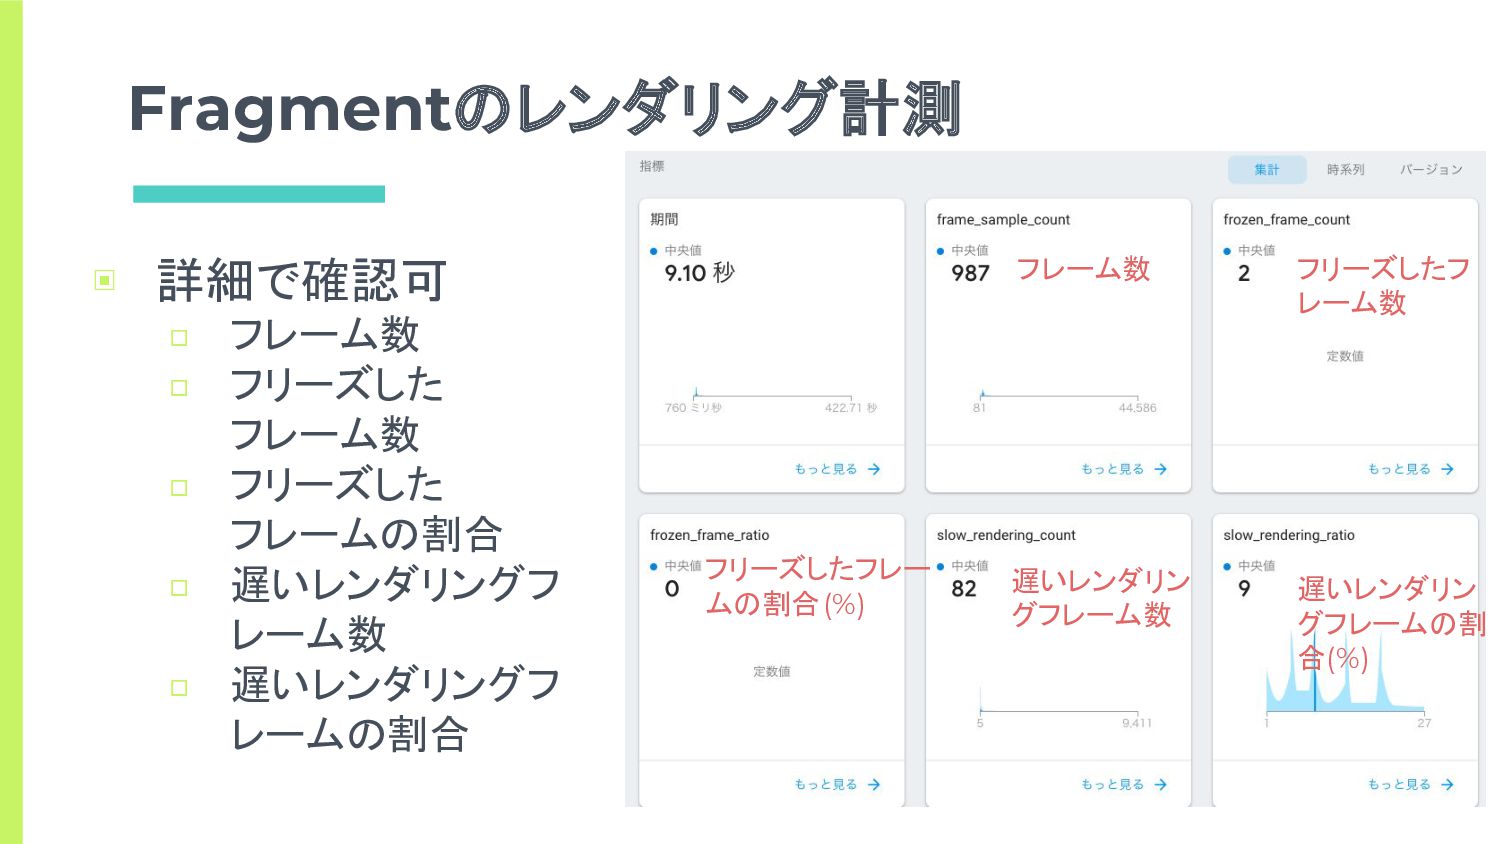
▣ 詳細で確認可 □ フレーム数 □ フリーズした フレーム数 □ フリーズした フレームの割合
□ 遅いレンダリングフ レーム数 □ 遅いレンダリングフ レームの割合 フレーム数 フリーズしたフ レーム数 フリーズしたフレー ムの割合(%) 遅いレンダリン グフレーム数 遅いレンダリン グフレームの割 合(%) Fragmentのレンダリング計測
▣ 一覧に遅いレンダリング・フリーズしたフレームが出ないので 画面間の比較がしづらい ▣ 詳細に行けば見れるので、画面毎の数値が見れるのは良さそ う ▣ Activity.getWindowに対してのFrameMetricsなので、 Fragment単体でのレンダリング数値でないことに注意 ▣
どの画面(Fragment)が出ているときに数値が悪いかはわか る Fragmentのレンダリング計測
どの画面が遅いのかを知る - まとめ ▣ わかる数値 □ 画面単位で遅い箇所 ▣ できること □
サンプル数と、遅いレンダリング or フリーズしたフレームの値か ら、改修優先度を決めることができる
画面内のどこが遅いのかを知る
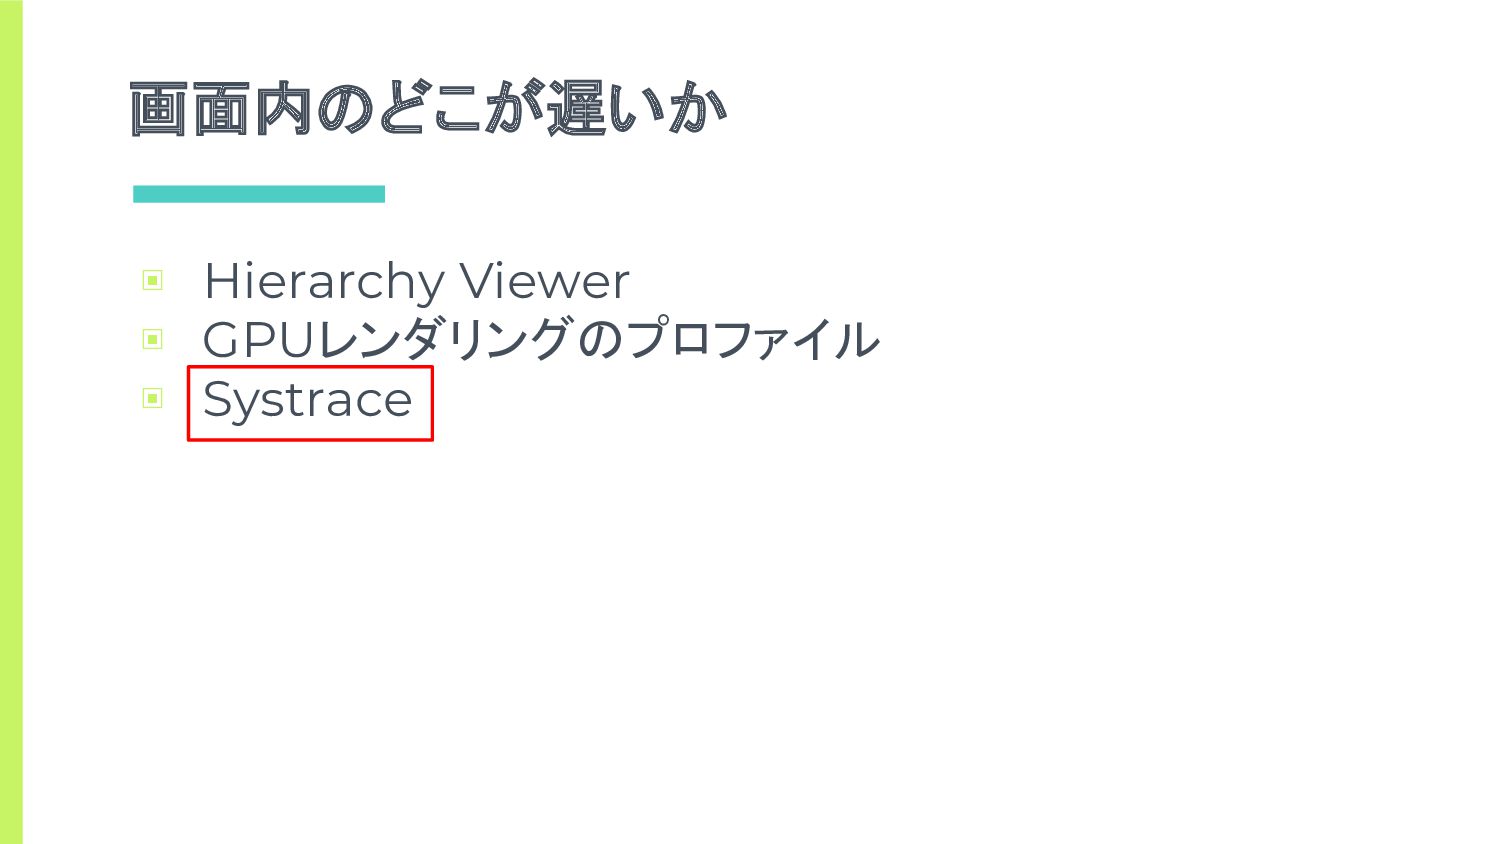
画面内のどこが遅いか ▣ Hierarchy Viewer ▣ GPUレンダリングのプロファイル ▣ Systrace
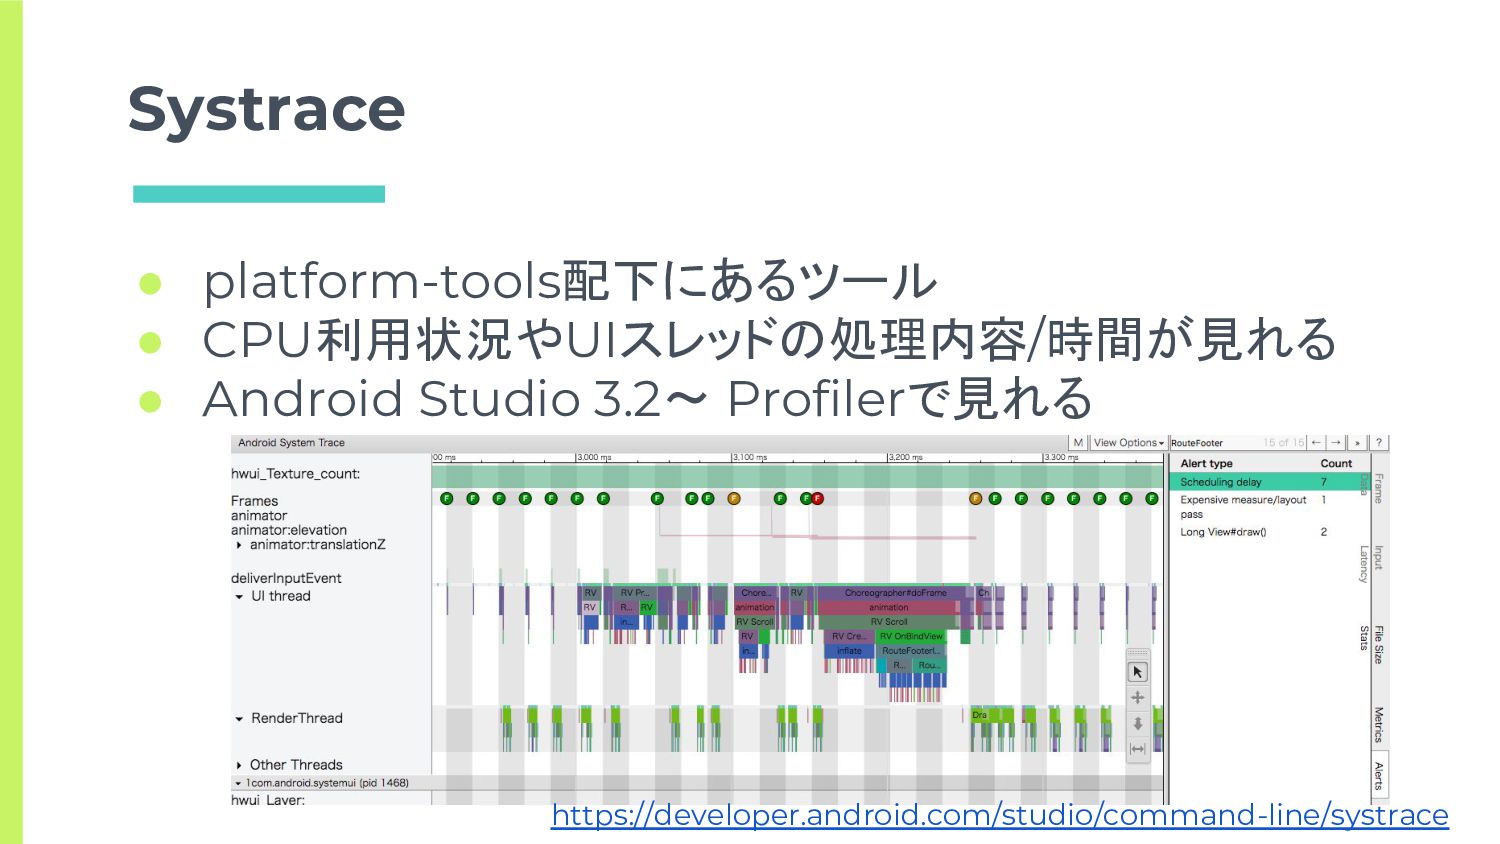
Systrace https://developer.android.com/studio/command-line/systrace • platform-tools配下にあるツール • CPU利用状況やUIスレッドの処理内容/時間が見れる • Android Studio 3.2〜
Profilerで見れる
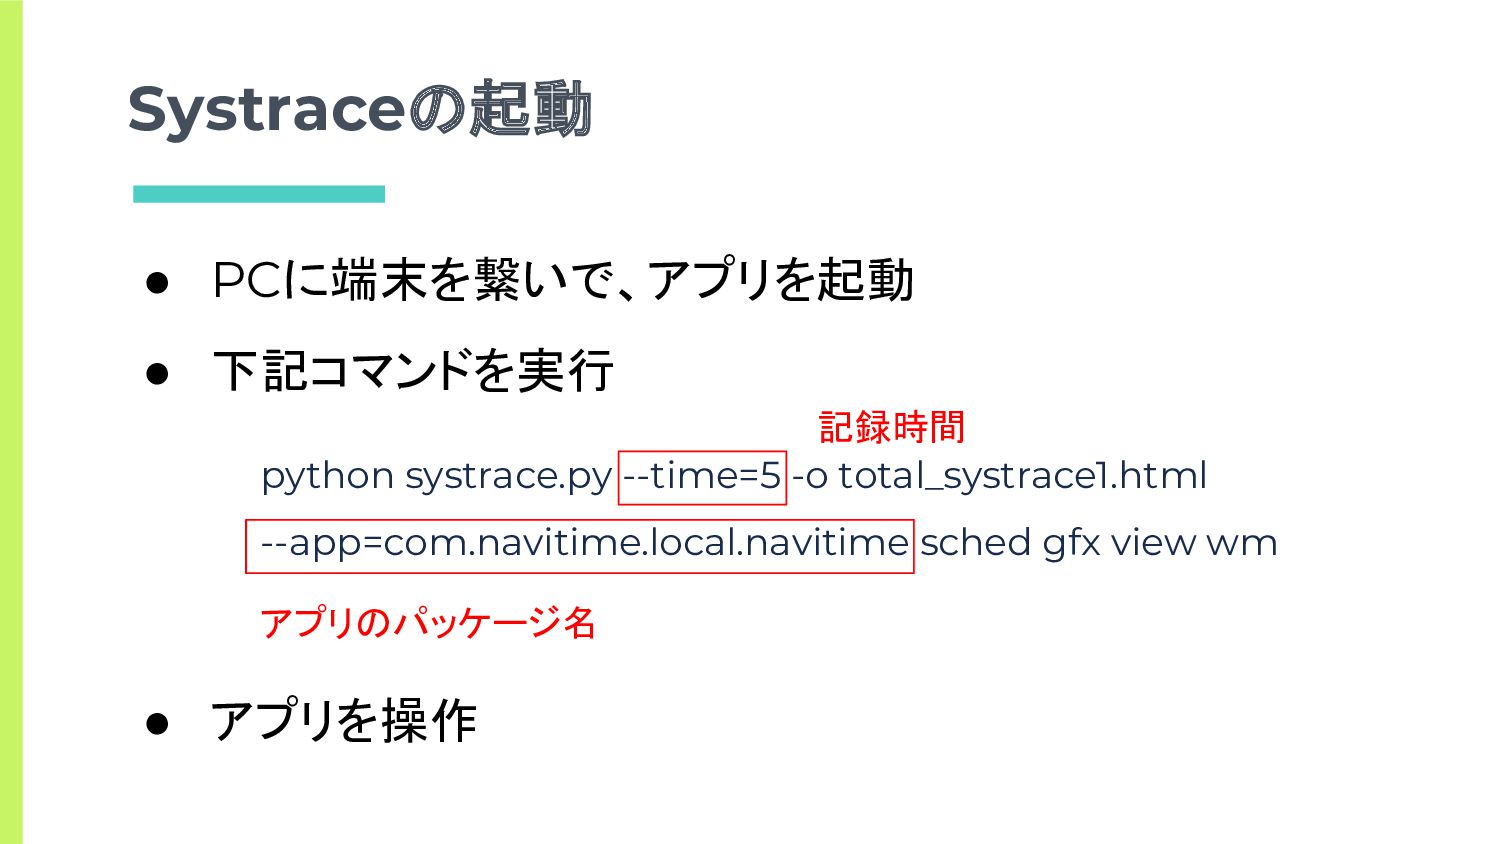
Systraceの起動 python systrace.py --time=5 -o total_systrace1.html --app=com.navitime.local.navitime sched gfx view
wm • PCに端末を繋いで、アプリを起動 • 下記コマンドを実行 記録時間 アプリのパッケージ名 • アプリを操作
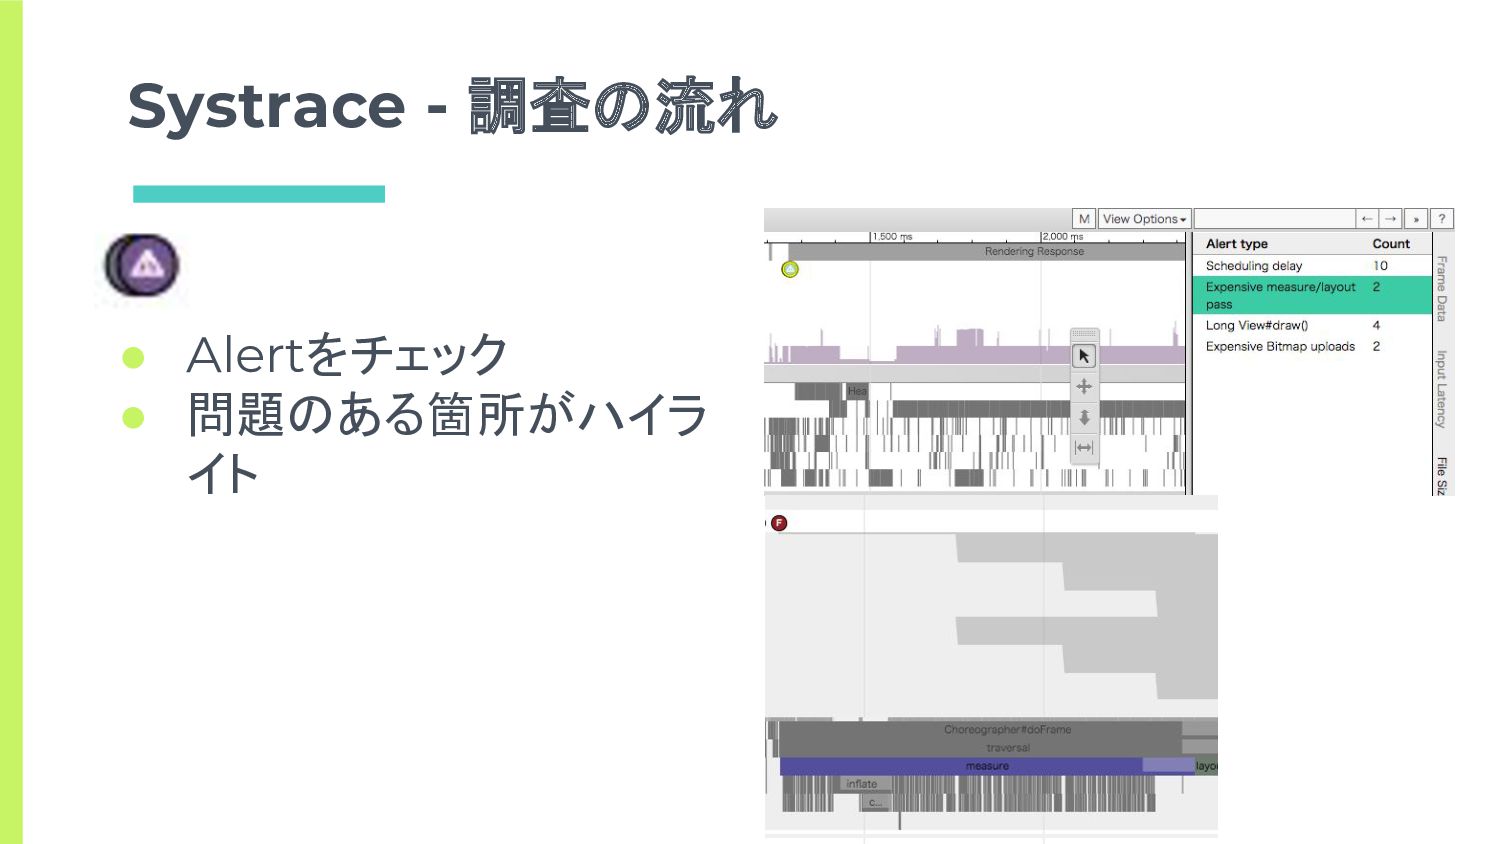
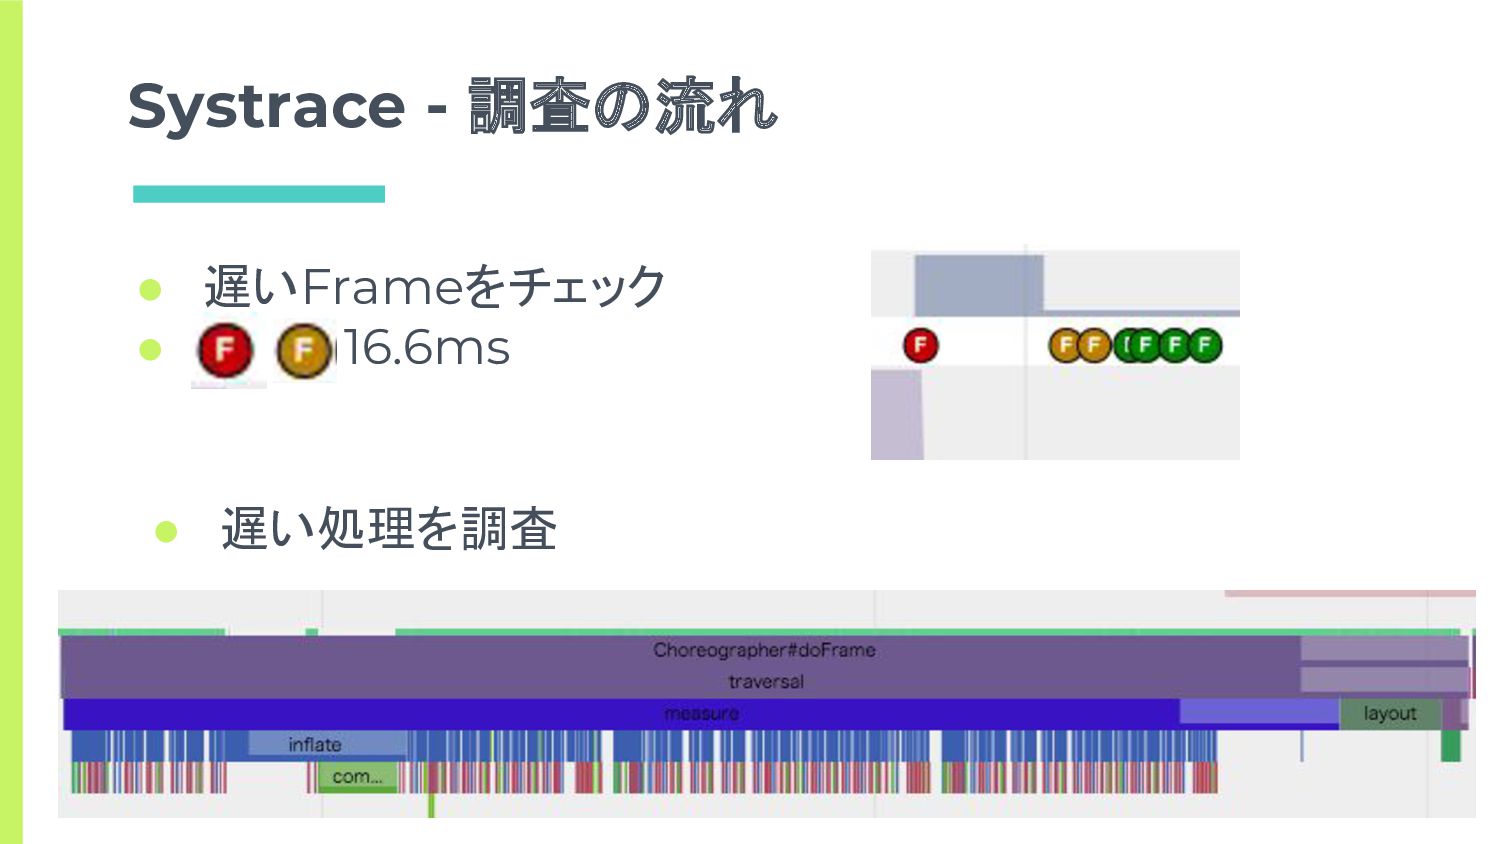
Systrace - 調査の流れ • Alertをチェック • 問題のある箇所がハイラ イト
• 遅いFrameをチェック • > 16.6ms Systrace - 調査の流れ • 遅い処理を調査
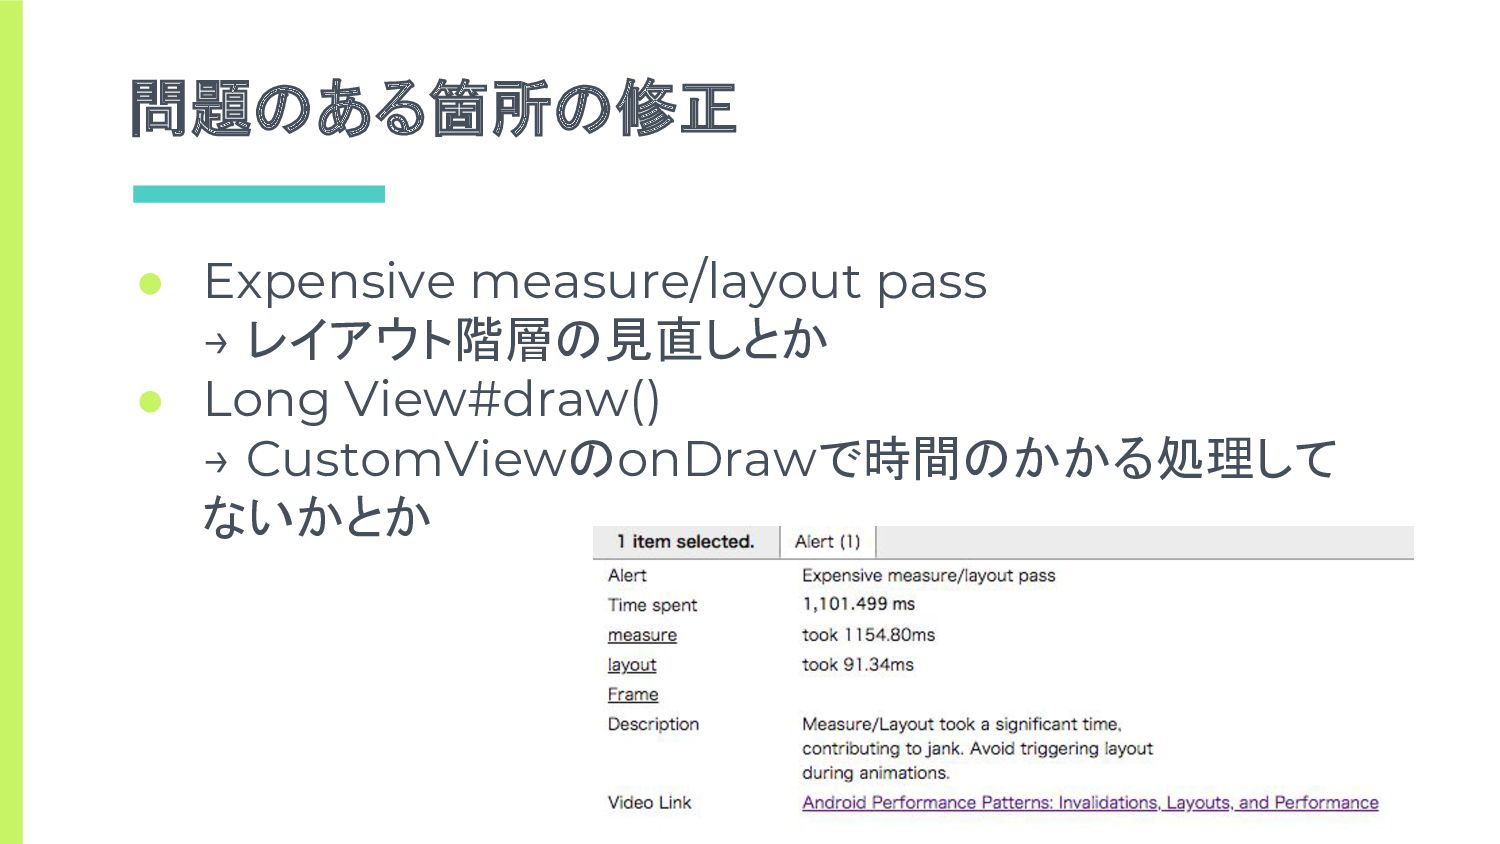
問題のある箇所の修正 • Expensive measure/layout pass → レイアウト階層の見直しとか • Long View#draw()
→ CustomViewのonDrawで時間のかかる処理して ないかとか
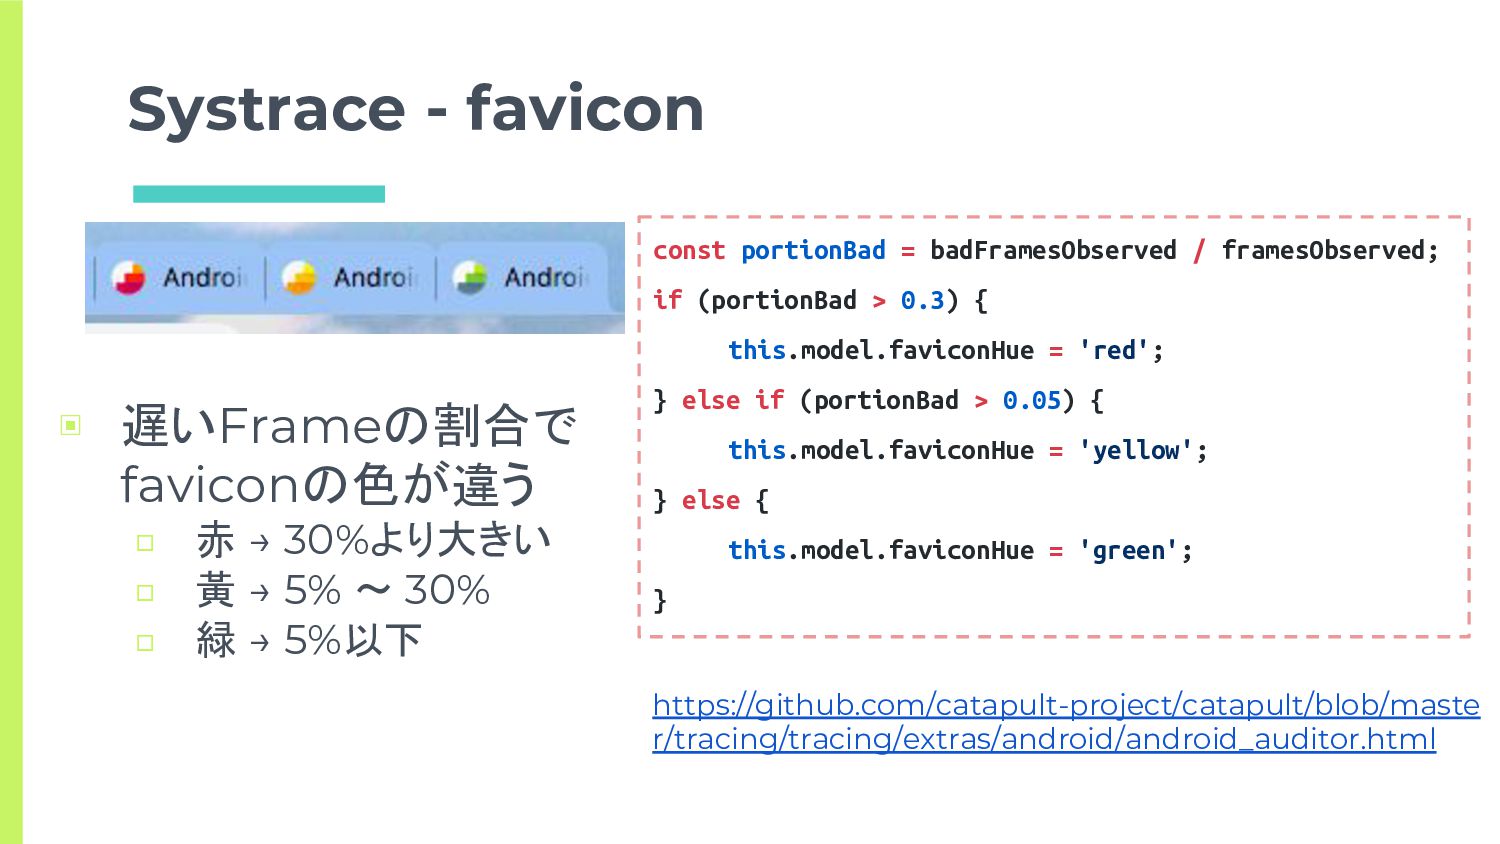
Systrace - favicon ▣ 遅いFrameの割合で faviconの色が違う □ 赤 → 30%より大きい
□ 黃 → 5% 〜 30% □ 緑 → 5%以下 const portionBad = badFramesObserved / framesObserved; if (portionBad > 0.3) { this.model.faviconHue = 'red'; } else if (portionBad > 0.05) { this.model.faviconHue = 'yellow'; } else { this.model.faviconHue = 'green'; } https://github.com/catapult-project/catapult/blob/maste r/tracing/tracing/extras/android/android_auditor.html
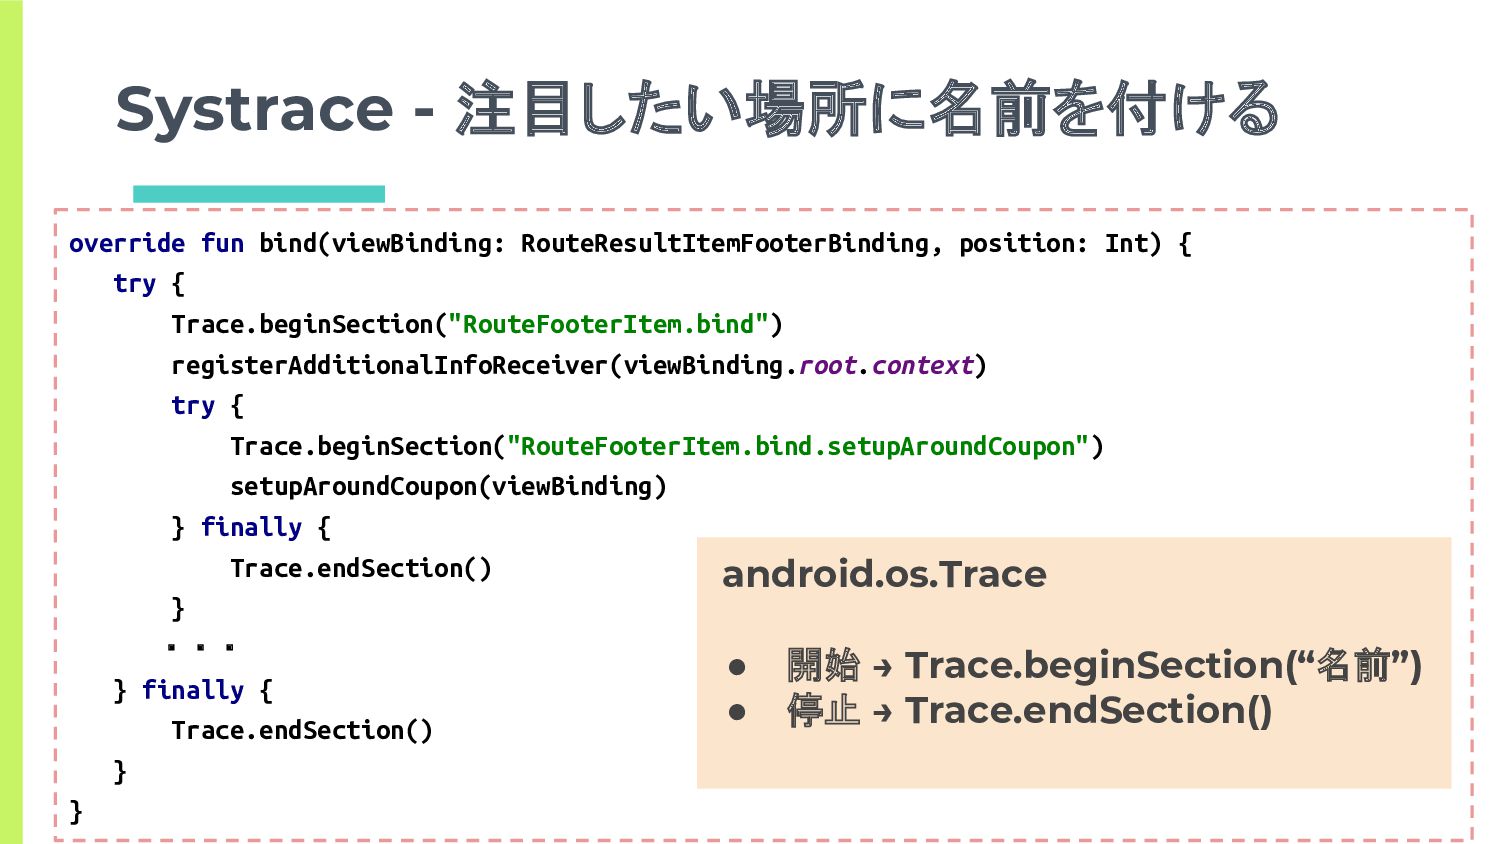
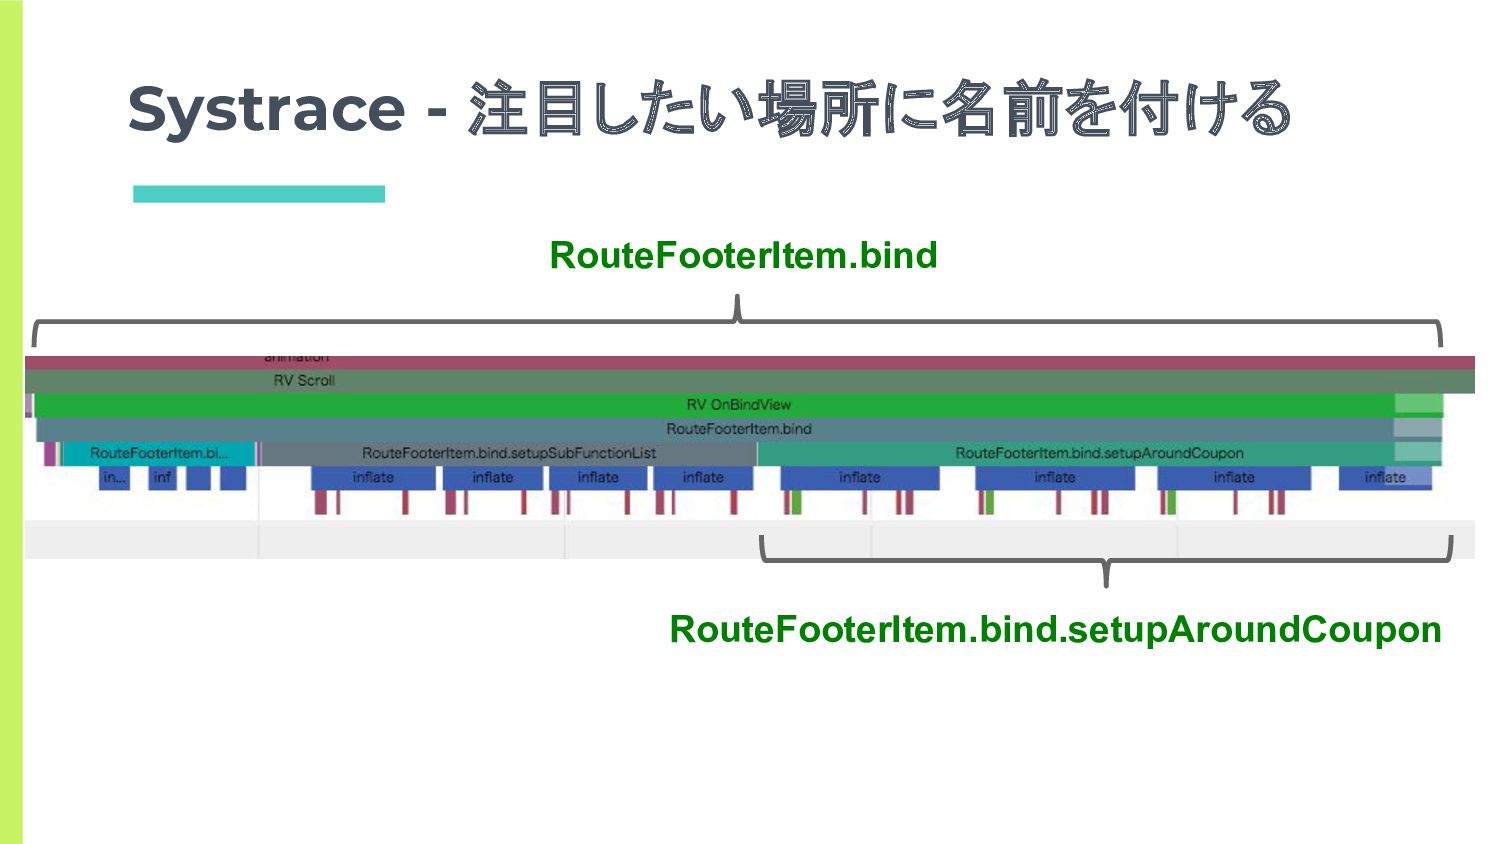
override fun bind(viewBinding: RouteResultItemFooterBinding, position: Int) { try { Trace.beginSection("RouteFooterItem.bind")
registerAdditionalInfoReceiver(viewBinding.root.context) try { Trace.beginSection("RouteFooterItem.bind.setupAroundCoupon") setupAroundCoupon(viewBinding) } finally { Trace.endSection() } ・・・ } finally { Trace.endSection() } } android.os.Trace • 開始 → Trace.beginSection(“名前”) • 停止 → Trace.endSection() Systrace - 注目したい場所に名前を付ける
Systrace - 注目したい場所に名前を付ける RouteFooterItem.bind RouteFooterItem.bind.setupAroundCoupon
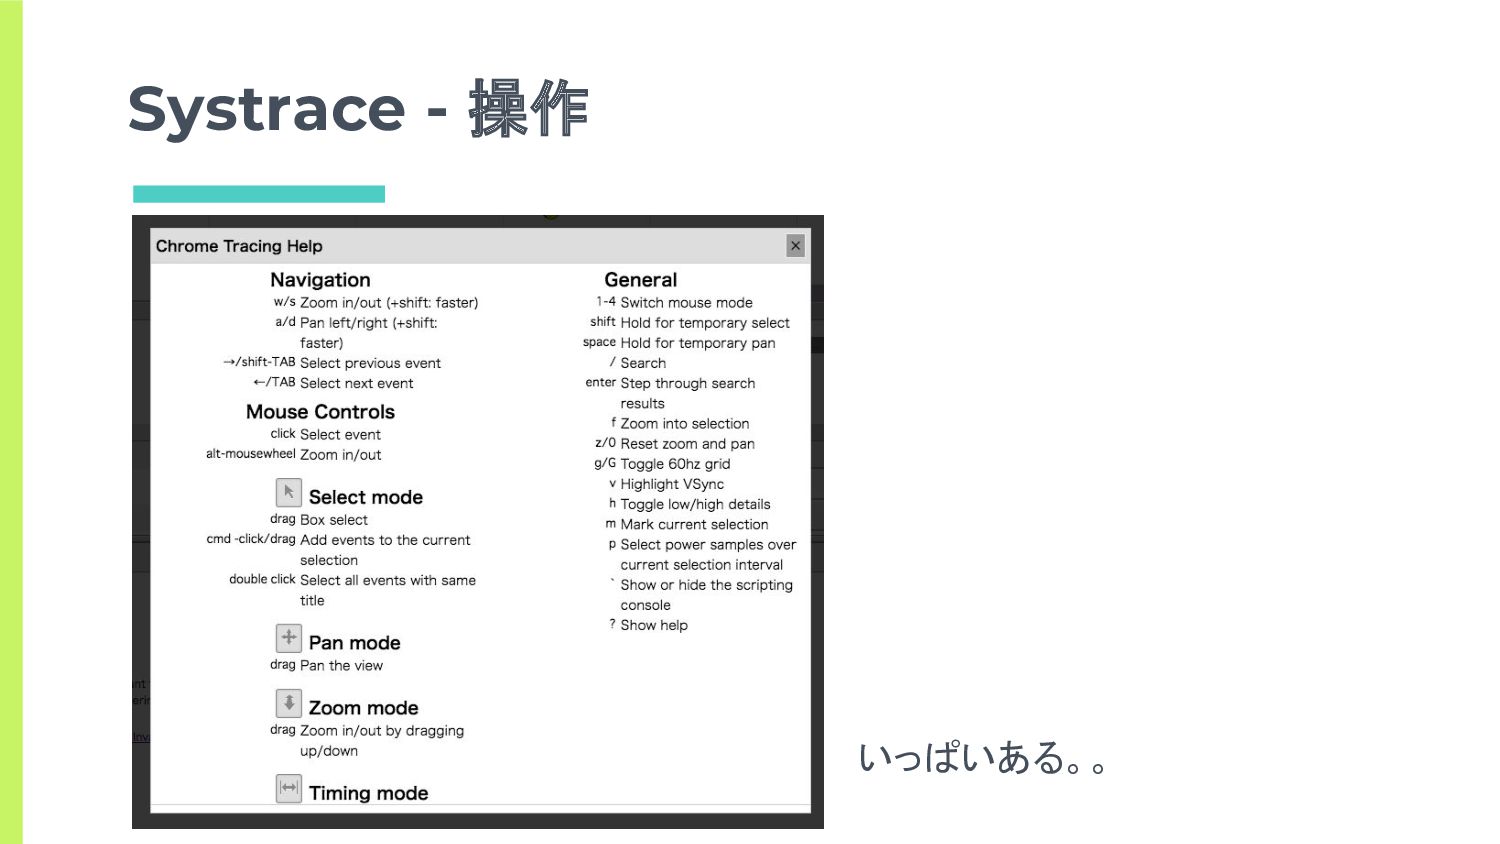
Systrace - 操作 いっぱいある。。
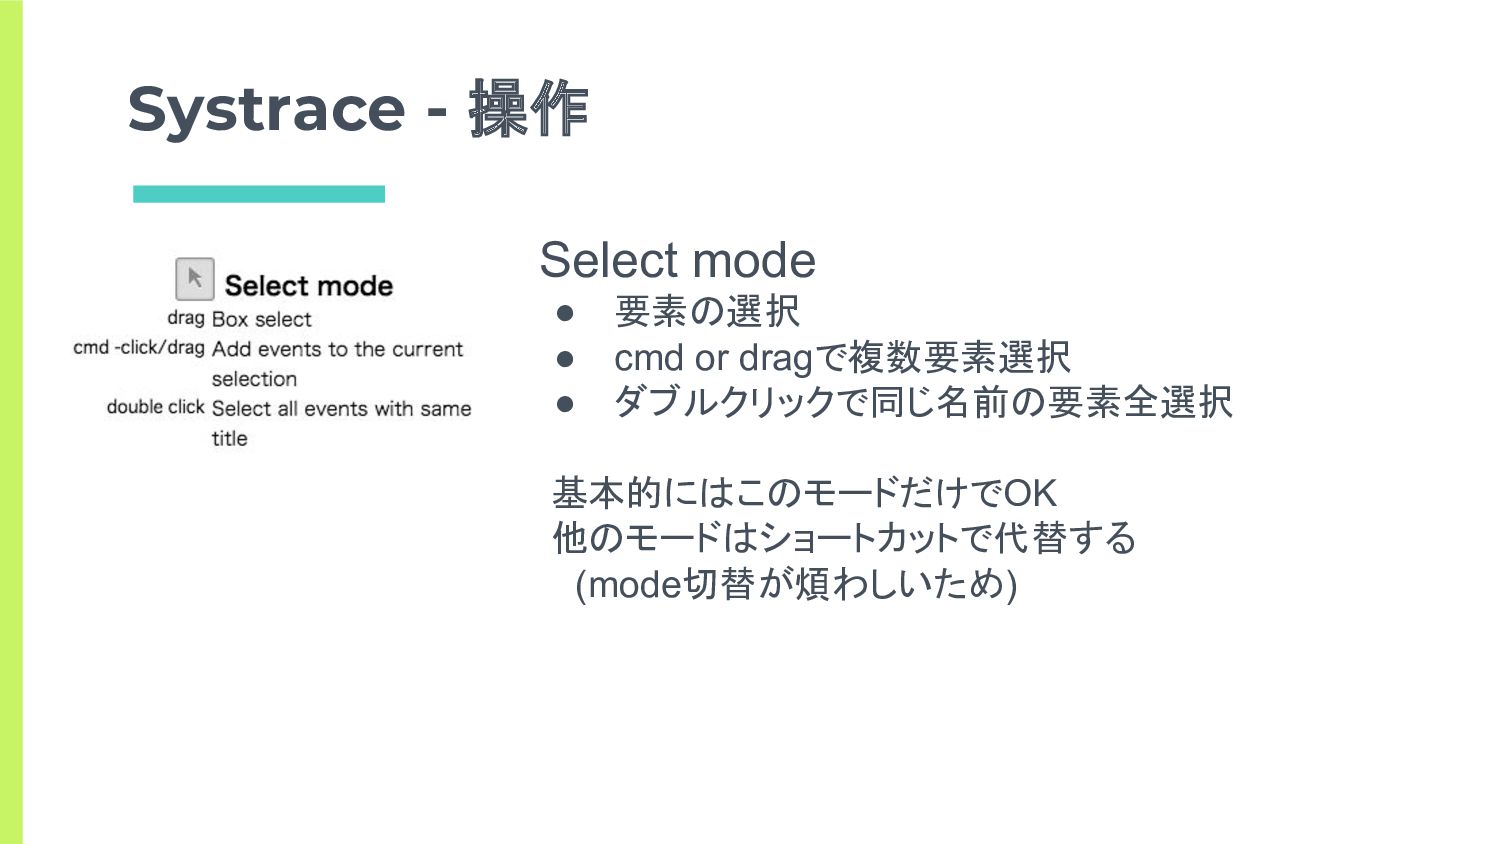
Systrace - 操作 Select mode • 要素の選択 • cmd or
dragで複数要素選択 • ダブルクリックで同じ名前の要素全選択 基本的にはこのモードだけでOK 他のモードはショートカットで代替する (mode切替が煩わしいため)
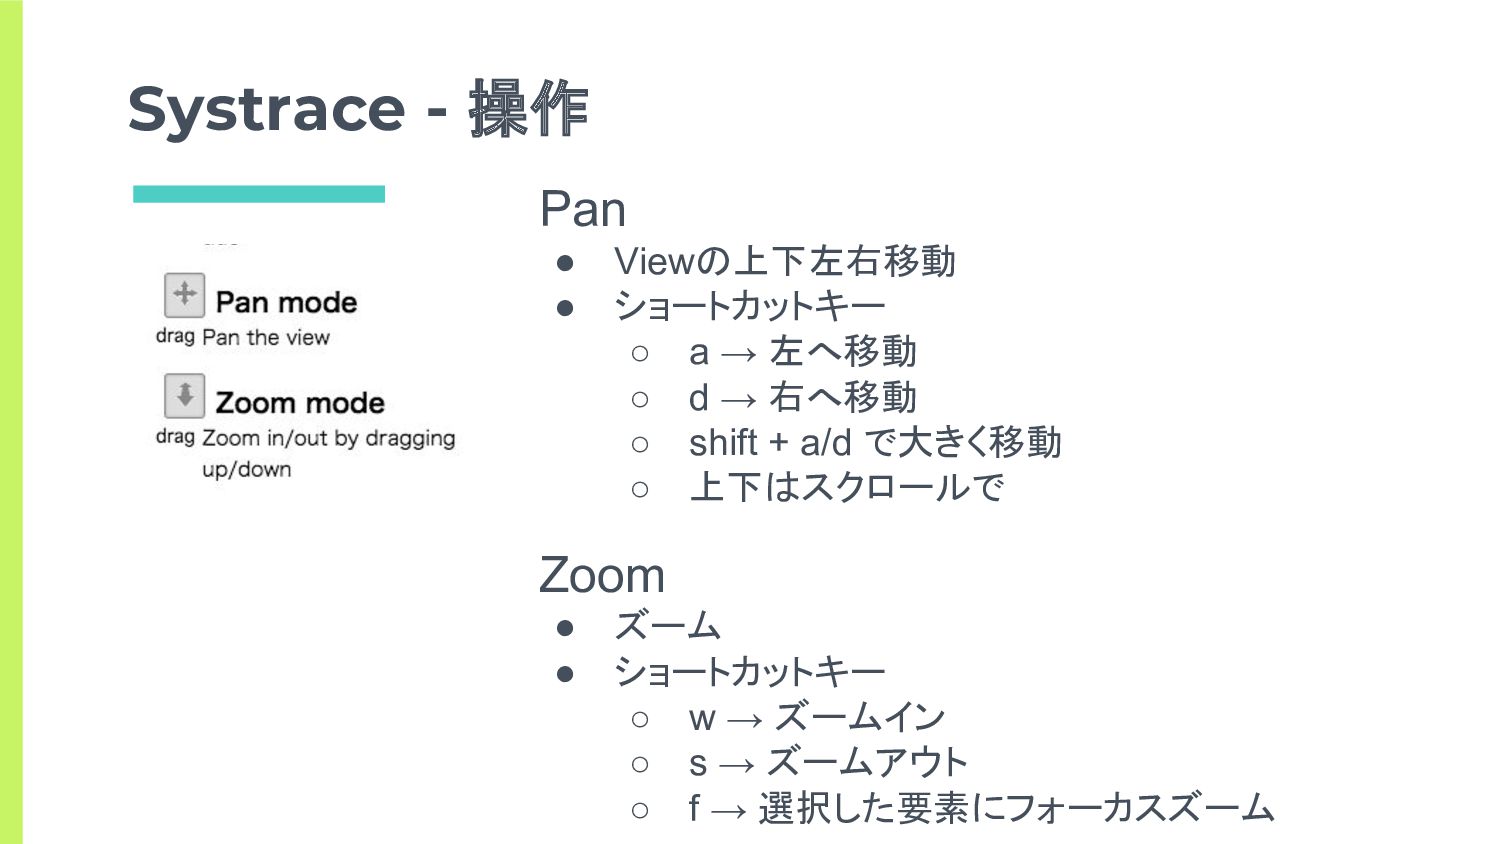
Systrace - 操作 Pan • Viewの上下左右移動 • ショートカットキー ◦ a
→ 左へ移動 ◦ d → 右へ移動 ◦ shift + a/d で大きく移動 ◦ 上下はスクロールで Zoom • ズーム • ショートカットキー ◦ w → ズームイン ◦ s → ズームアウト ◦ f → 選択した要素にフォーカスズーム
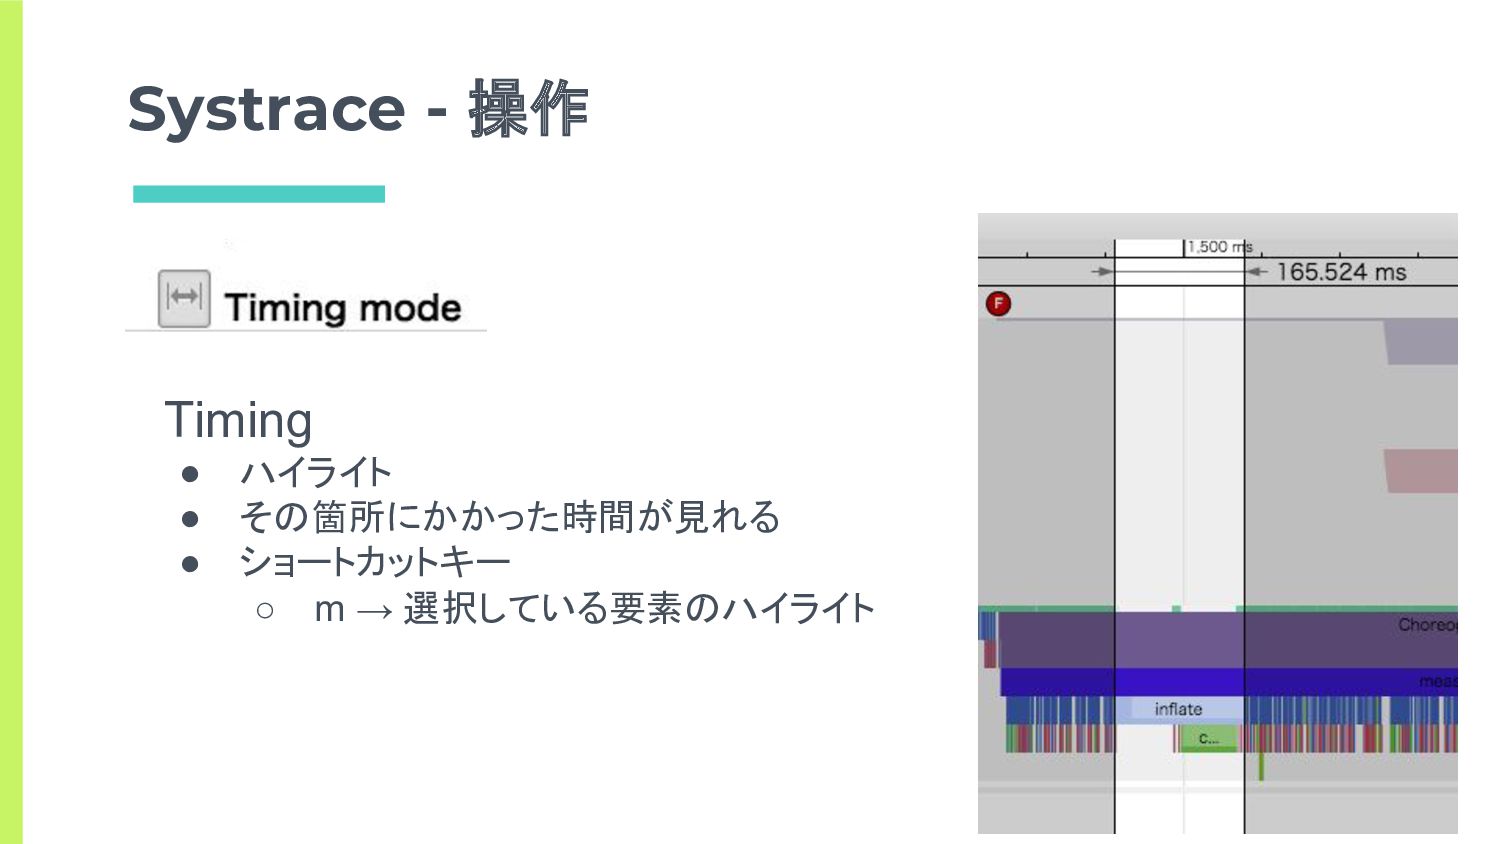
Systrace - 操作 Timing • ハイライト • その箇所にかかった時間が見れる • ショートカットキー
◦ m → 選択している要素のハイライト
画面内のどこが遅いのかを知る - まとめ ▣ わかる数値 □ どの処理が遅いか ▣ できること □
具体的なコードの改修ができる
パフォーマンス数値改善の 流れができた
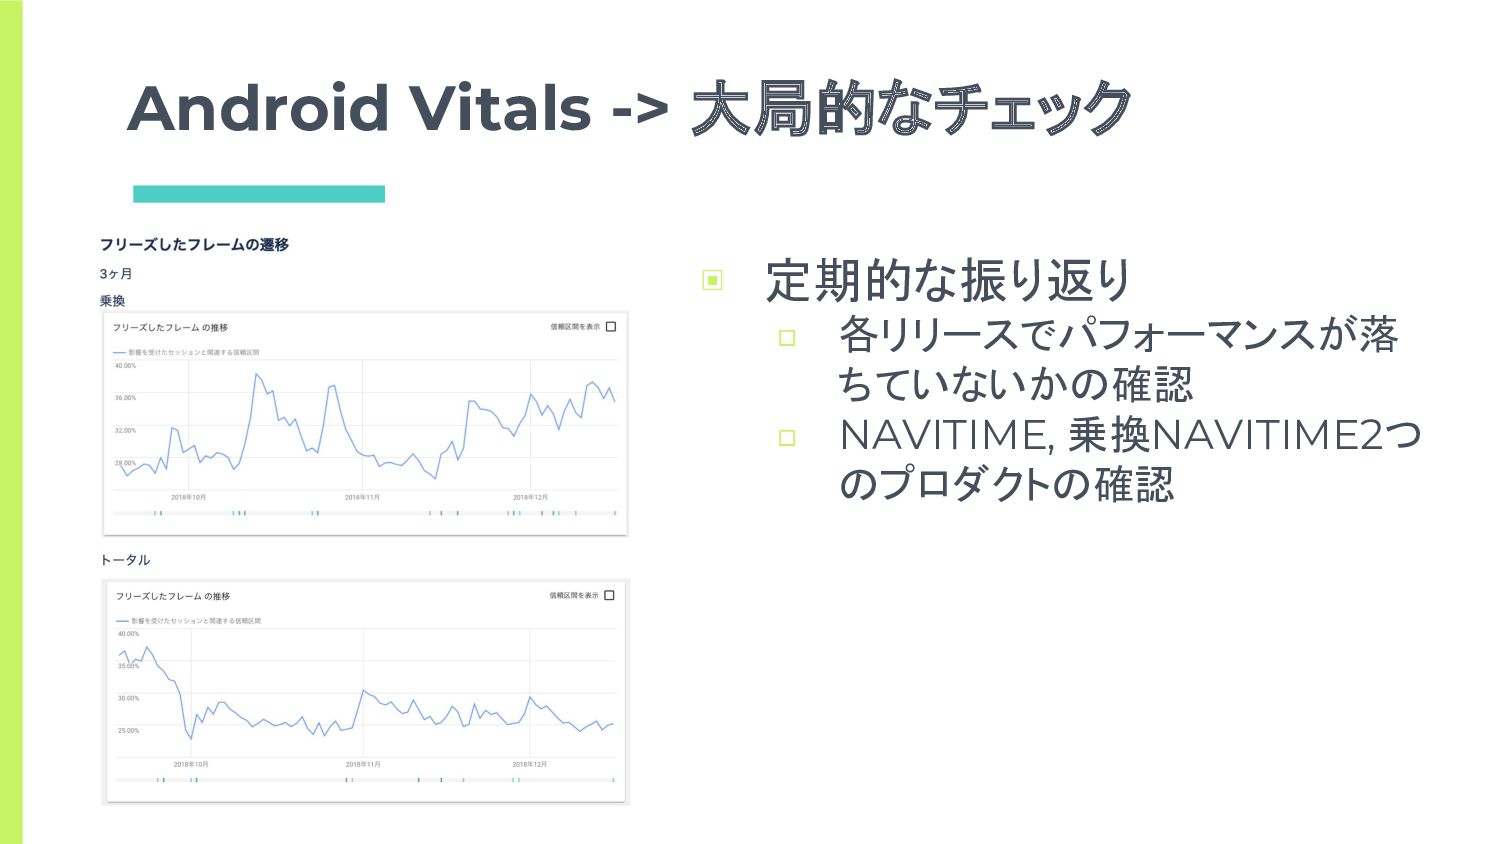
Android Vitals -> 大局的なチェック ▣ 定期的な振り返り □ 各リリースでパフォーマンスが落 ちていないかの確認 □
NAVITIME, 乗換NAVITIME2つ のプロダクトの確認
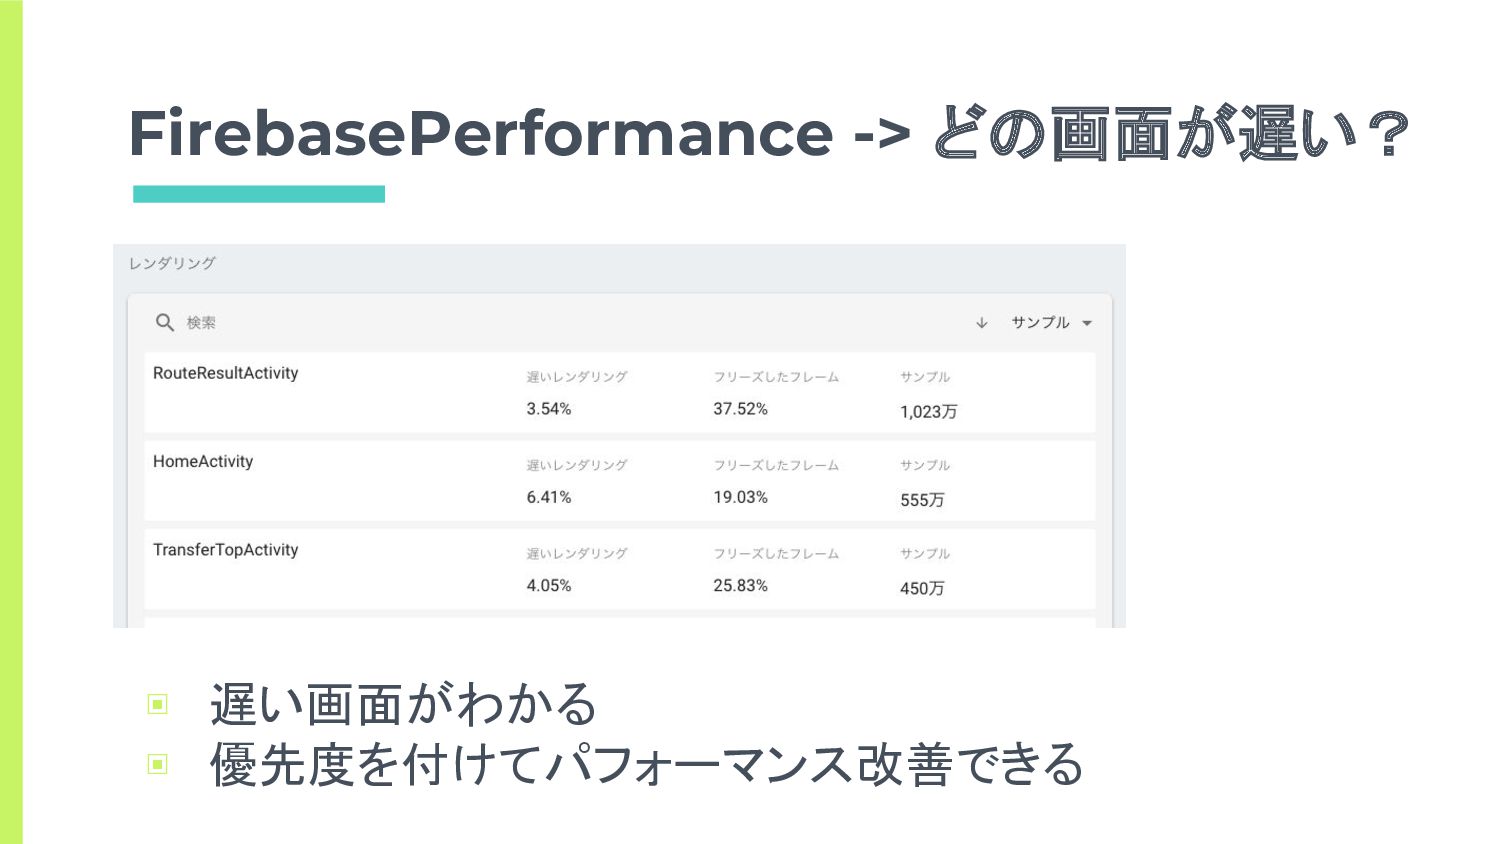
FirebasePerformance -> どの画面が遅い? ▣ 遅い画面がわかる ▣ 優先度を付けてパフォーマンス改善できる
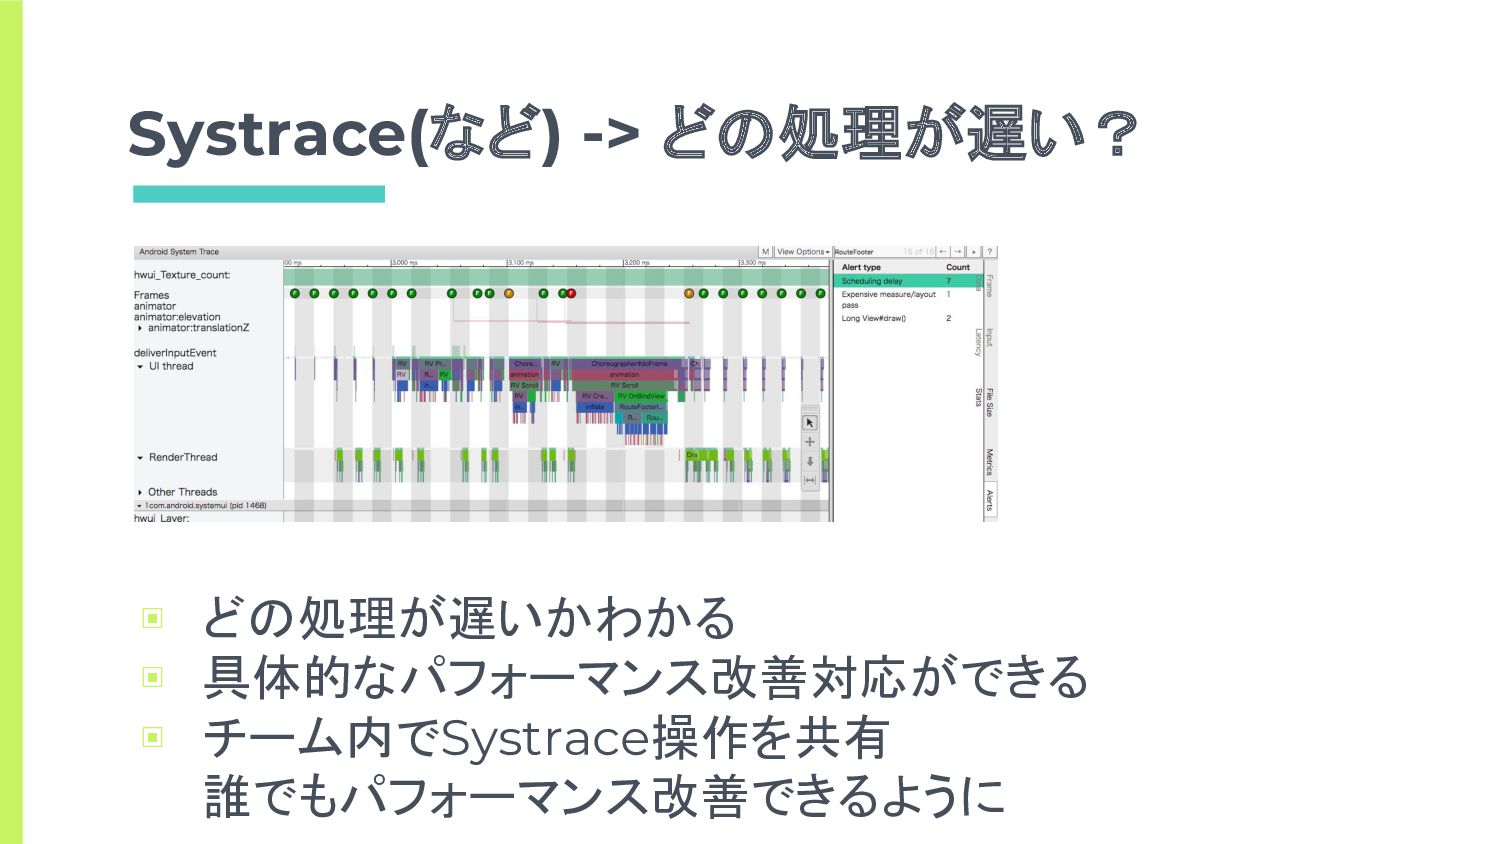
Systrace(など) -> どの処理が遅い? ▣ どの処理が遅いかわかる ▣ 具体的なパフォーマンス改善対応ができる ▣ チーム内でSystrace操作を共有 誰でもパフォーマンス改善できるように
改善例
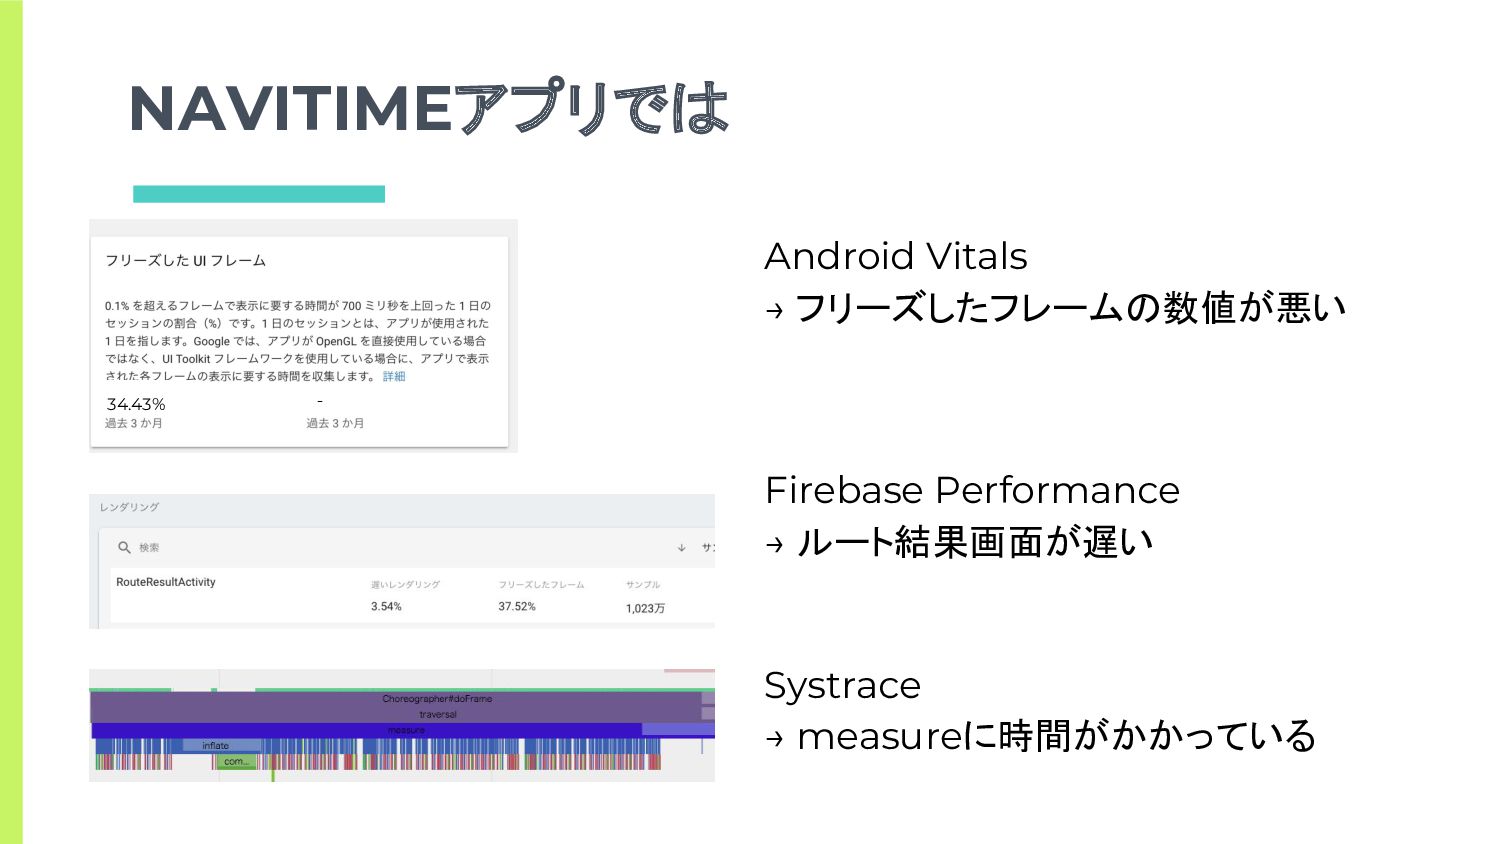
NAVITIMEアプリでは 34.43% - Android Vitals → フリーズしたフレームの数値が悪い Firebase Performance →
ルート結果画面が遅い Systrace → measureに時間がかかっている
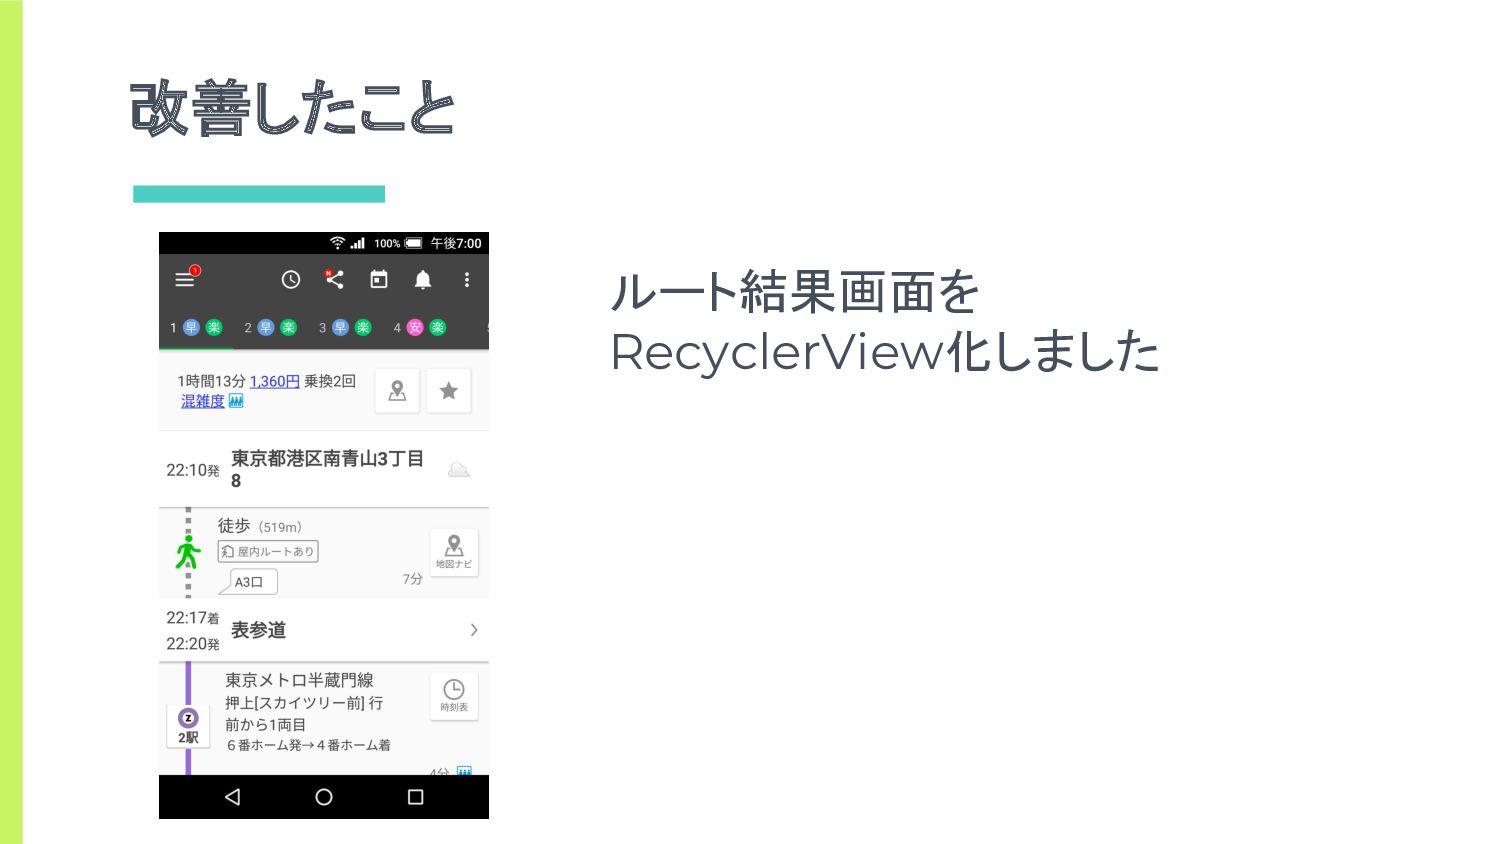
改善したこと ルート結果画面を RecyclerView化しました
× 3
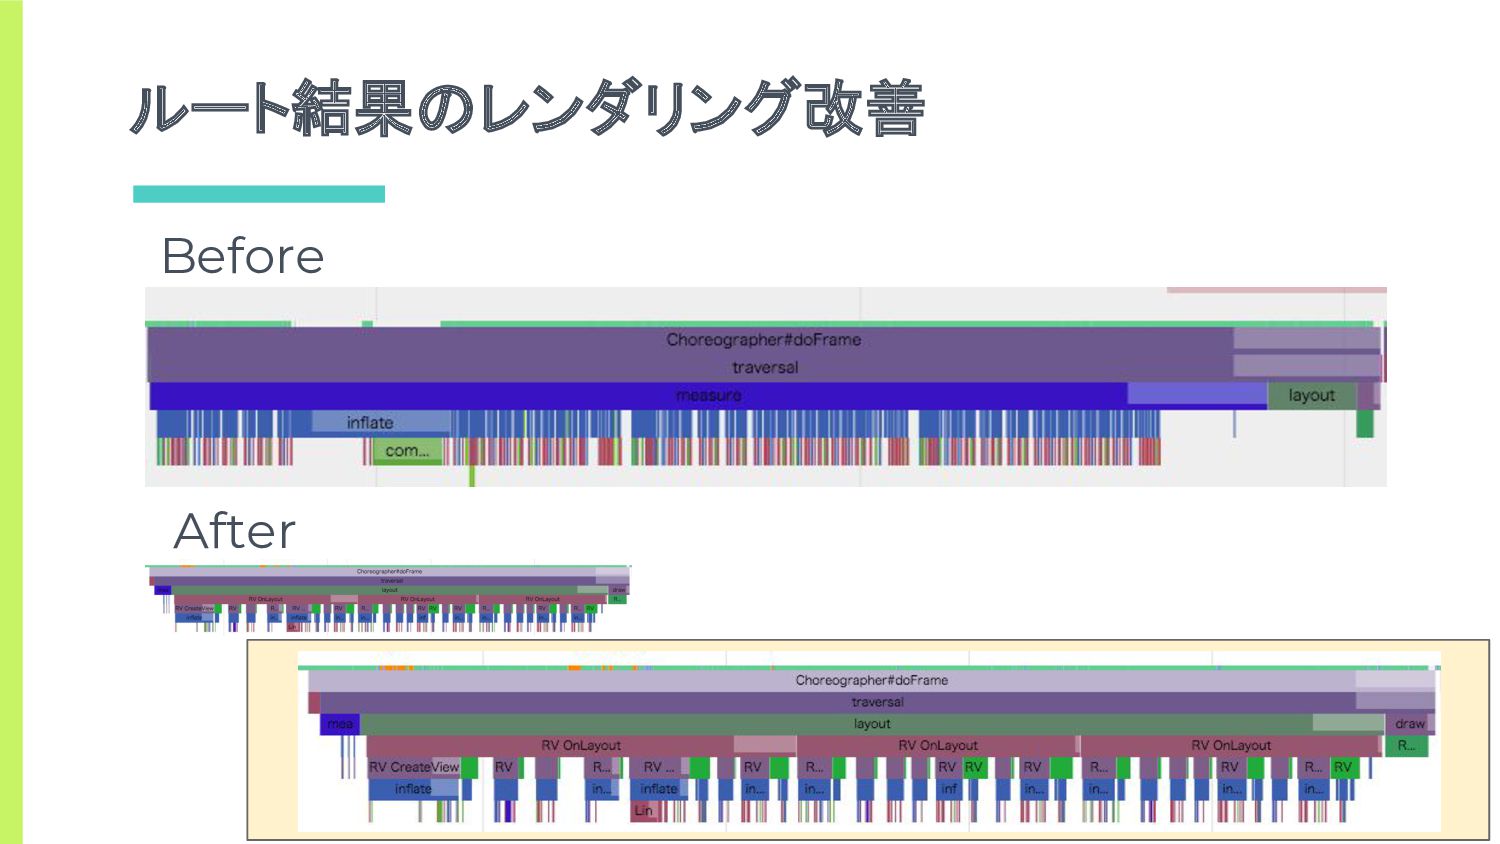
ルート結果のレンダリング改善 Before After
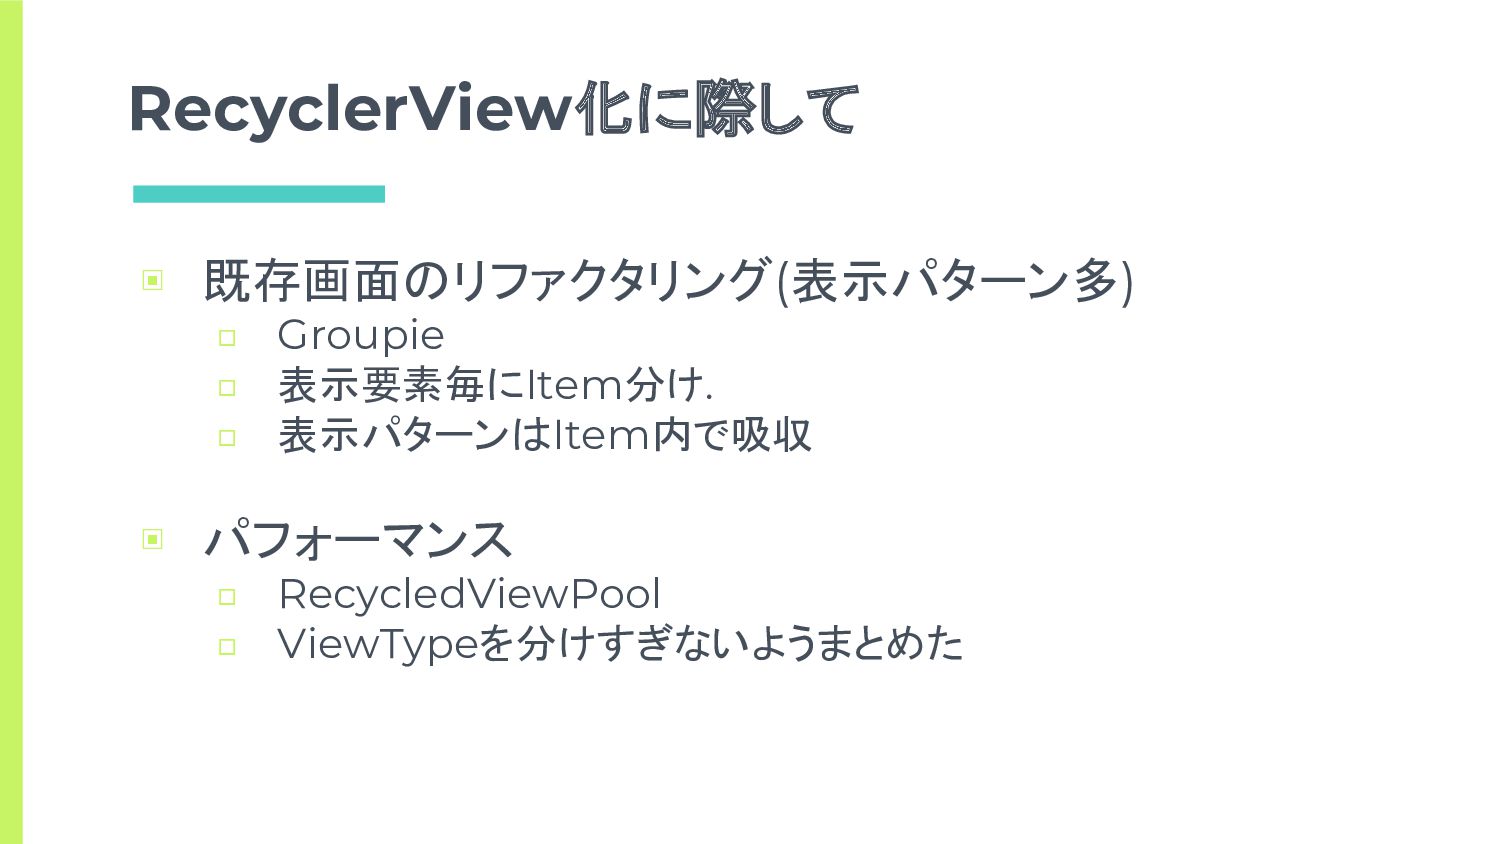
RecyclerView化に際して ▣ 既存画面のリファクタリング(表示パターン多) □ Groupie □ 表示要素毎にItem分け. □ 表示パターンはItem内で吸収 ▣
パフォーマンス □ RecycledViewPool □ ViewTypeを分けすぎないようまとめた
改善結果
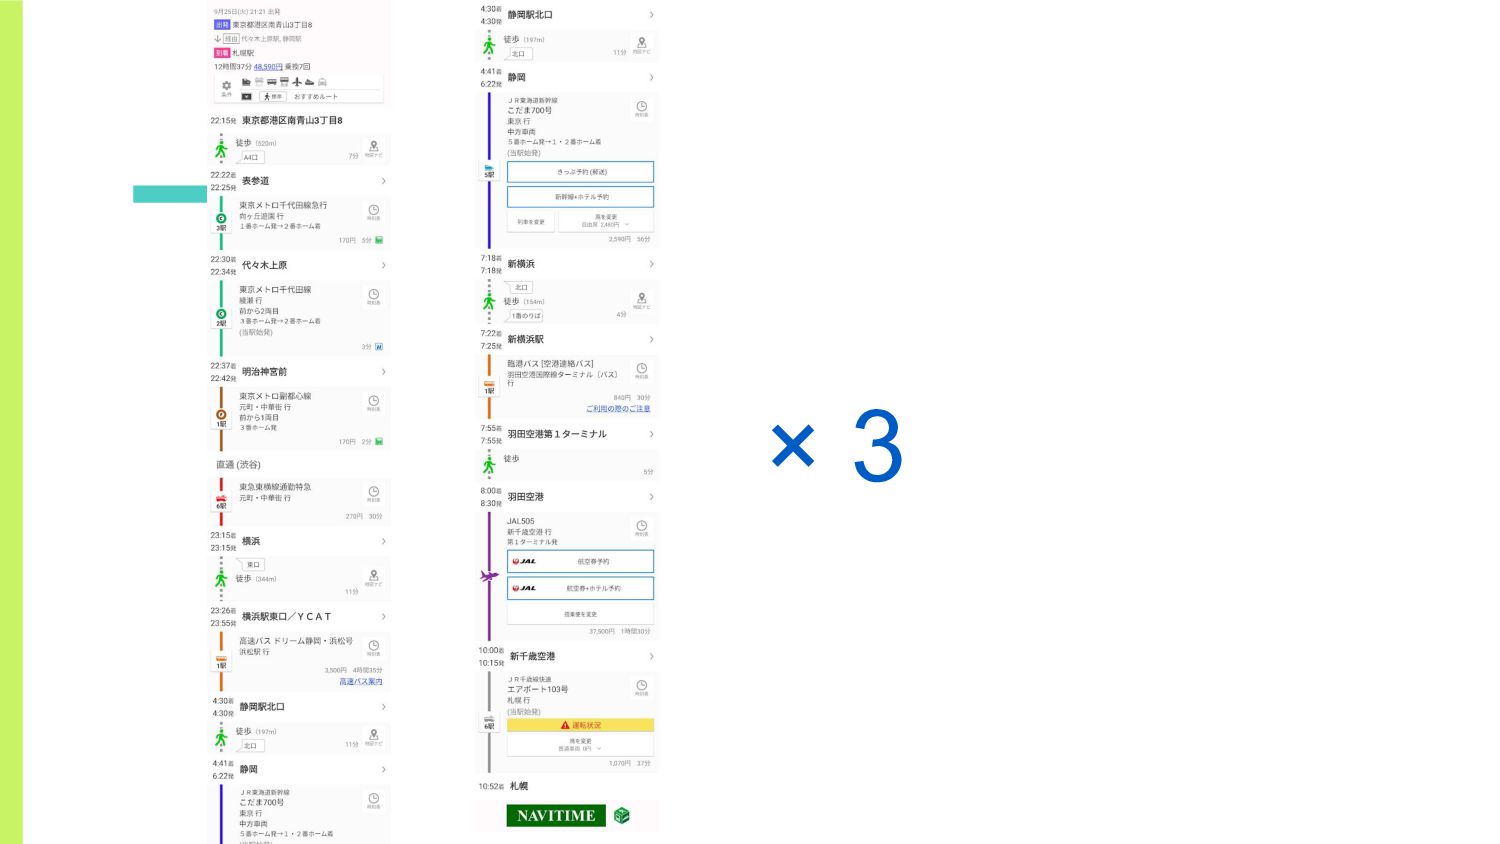
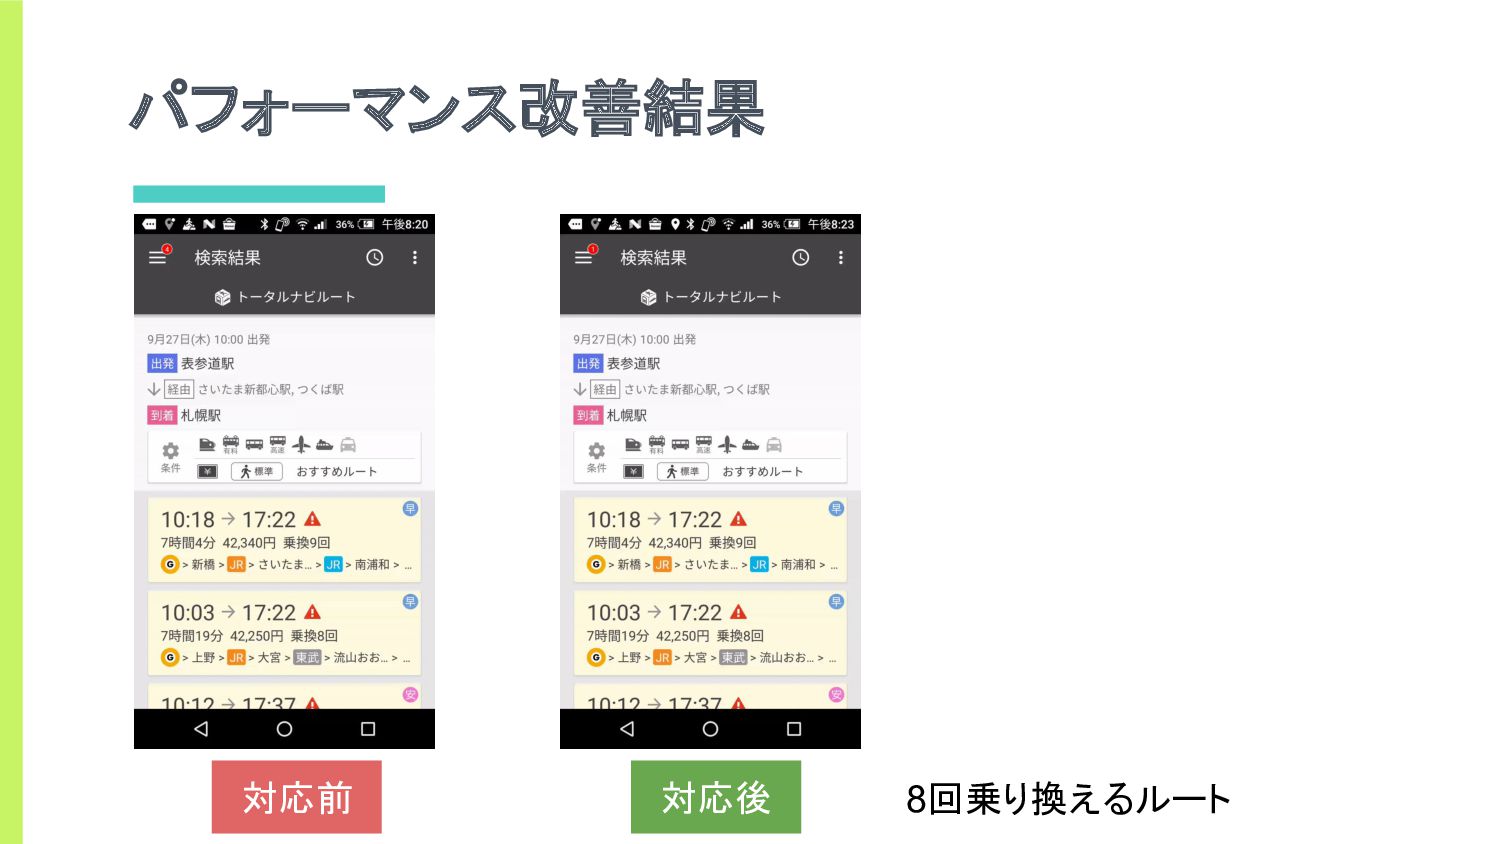
パフォーマンス改善結果 対応前 対応後 8回乗り換えるルート
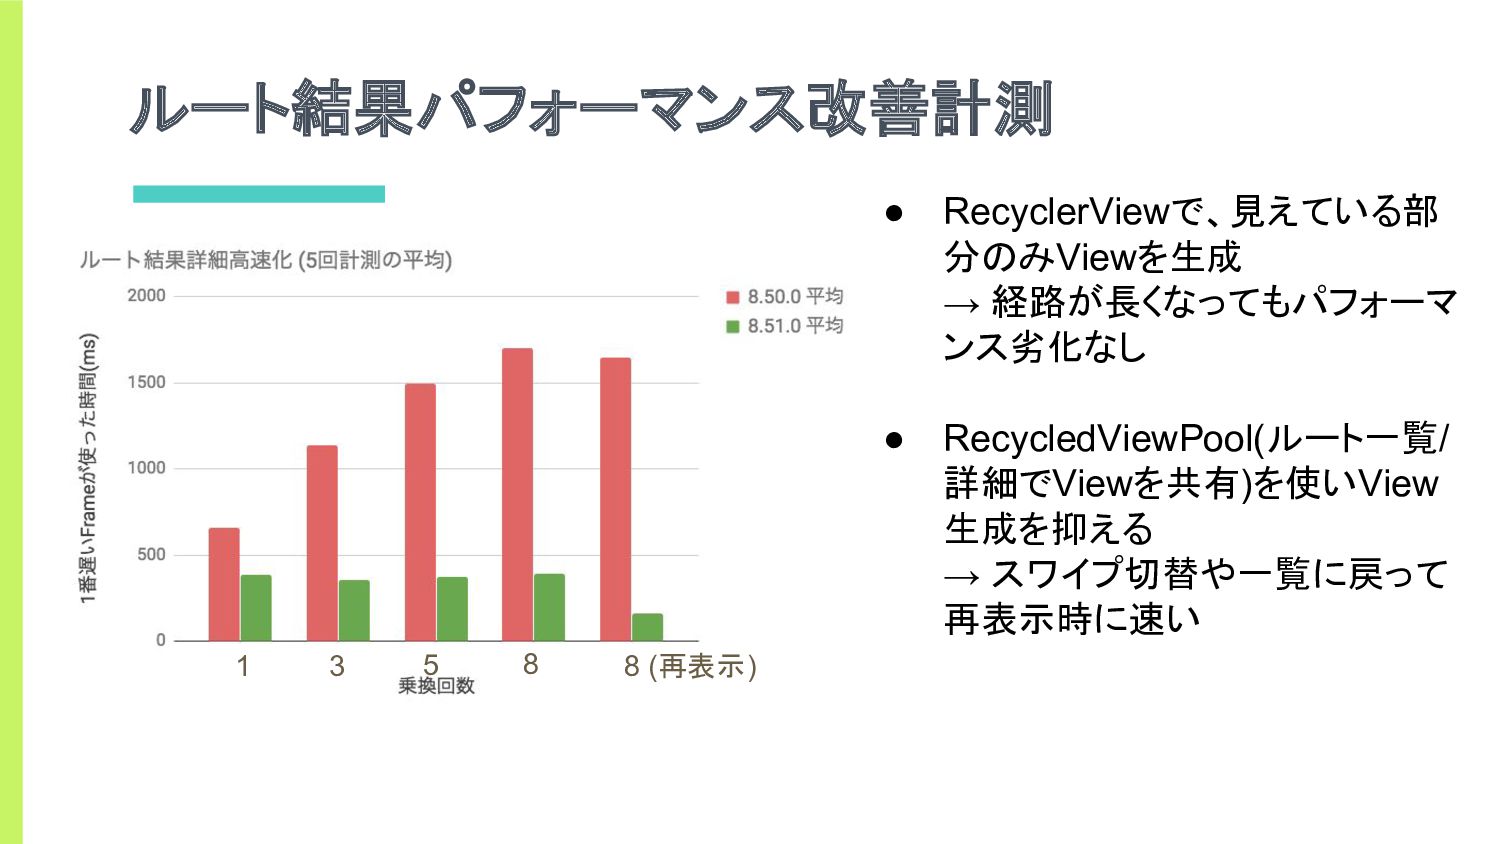
ルート結果パフォーマンス改善計測 1 3 5 8 8 (再表示) • RecyclerViewで、見えている部 分のみViewを生成
→ 経路が長くなってもパフォーマ ンス劣化なし • RecycledViewPool(ルート一覧/ 詳細でViewを共有)を使いView 生成を抑える → スワイプ切替や一覧に戻って 再表示時に速い
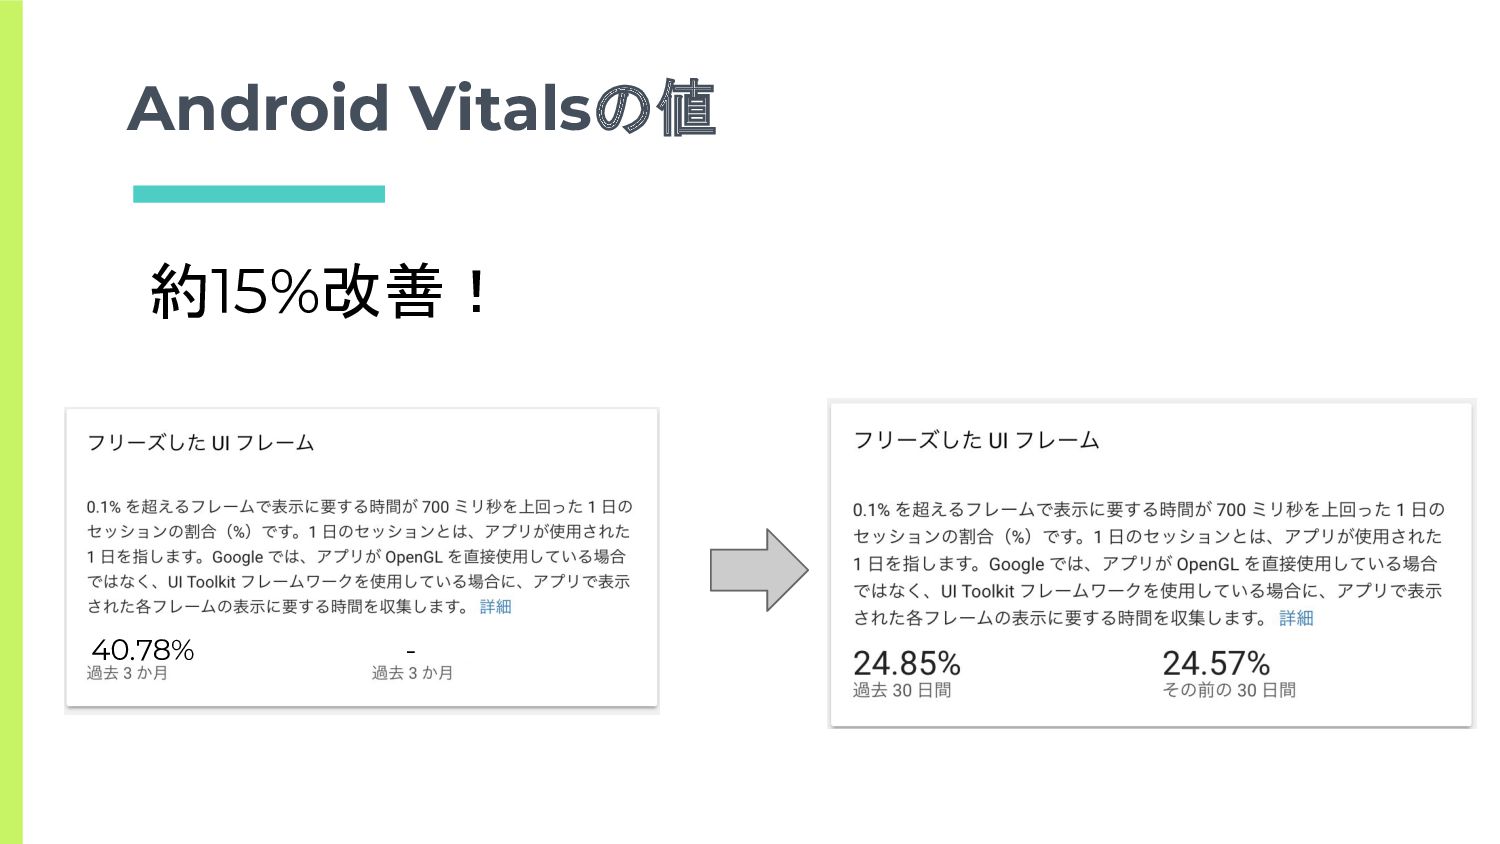
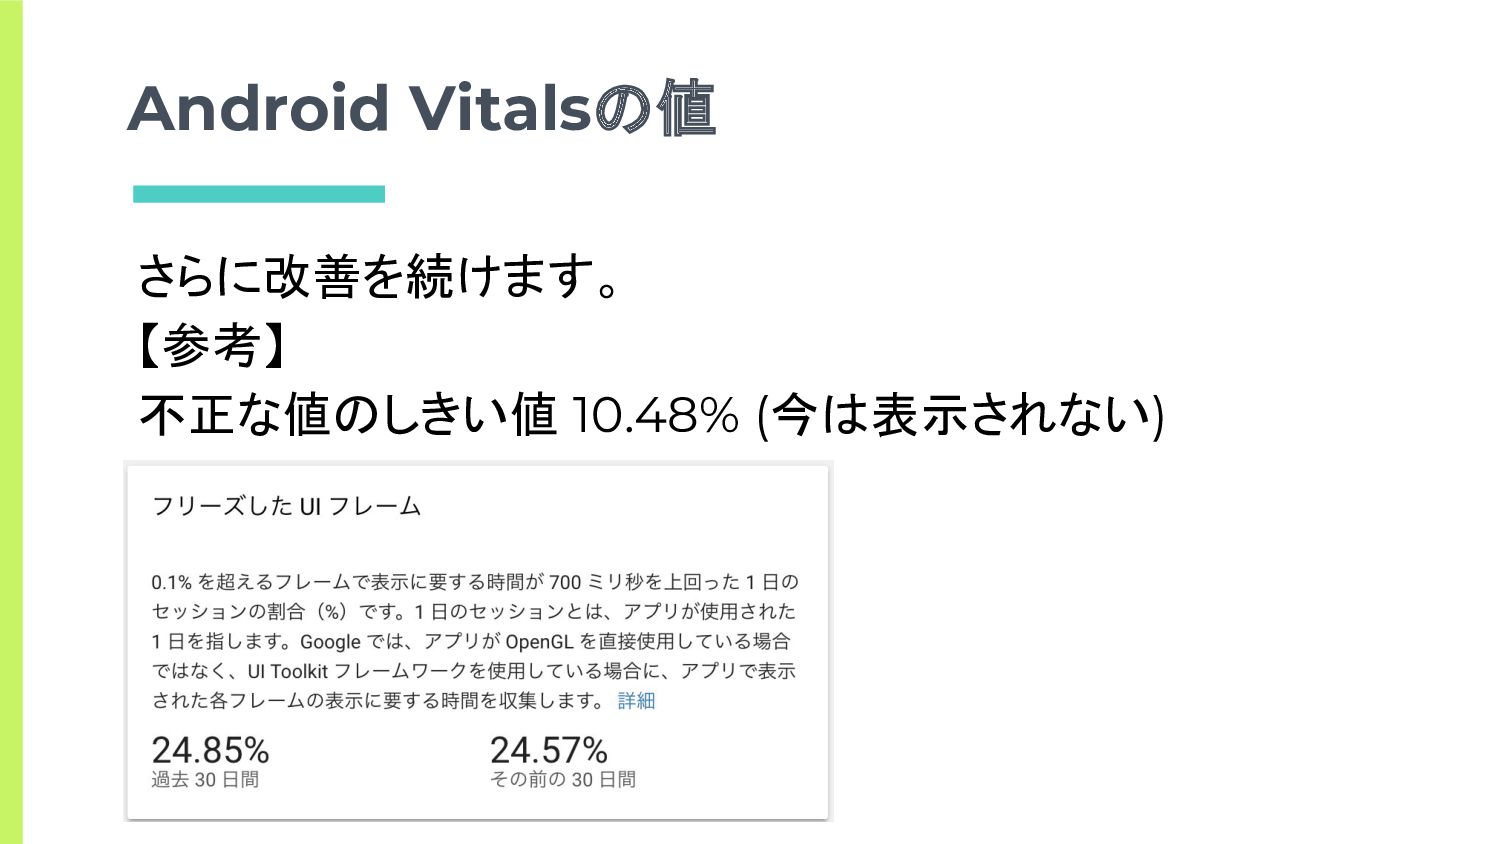
Android Vitalsの値 40.78% - 約15%改善!
Android Vitalsの値 さらに改善を続けます。 【参考】 不正な値のしきい値 10.48% (今は表示されない)
まとめ
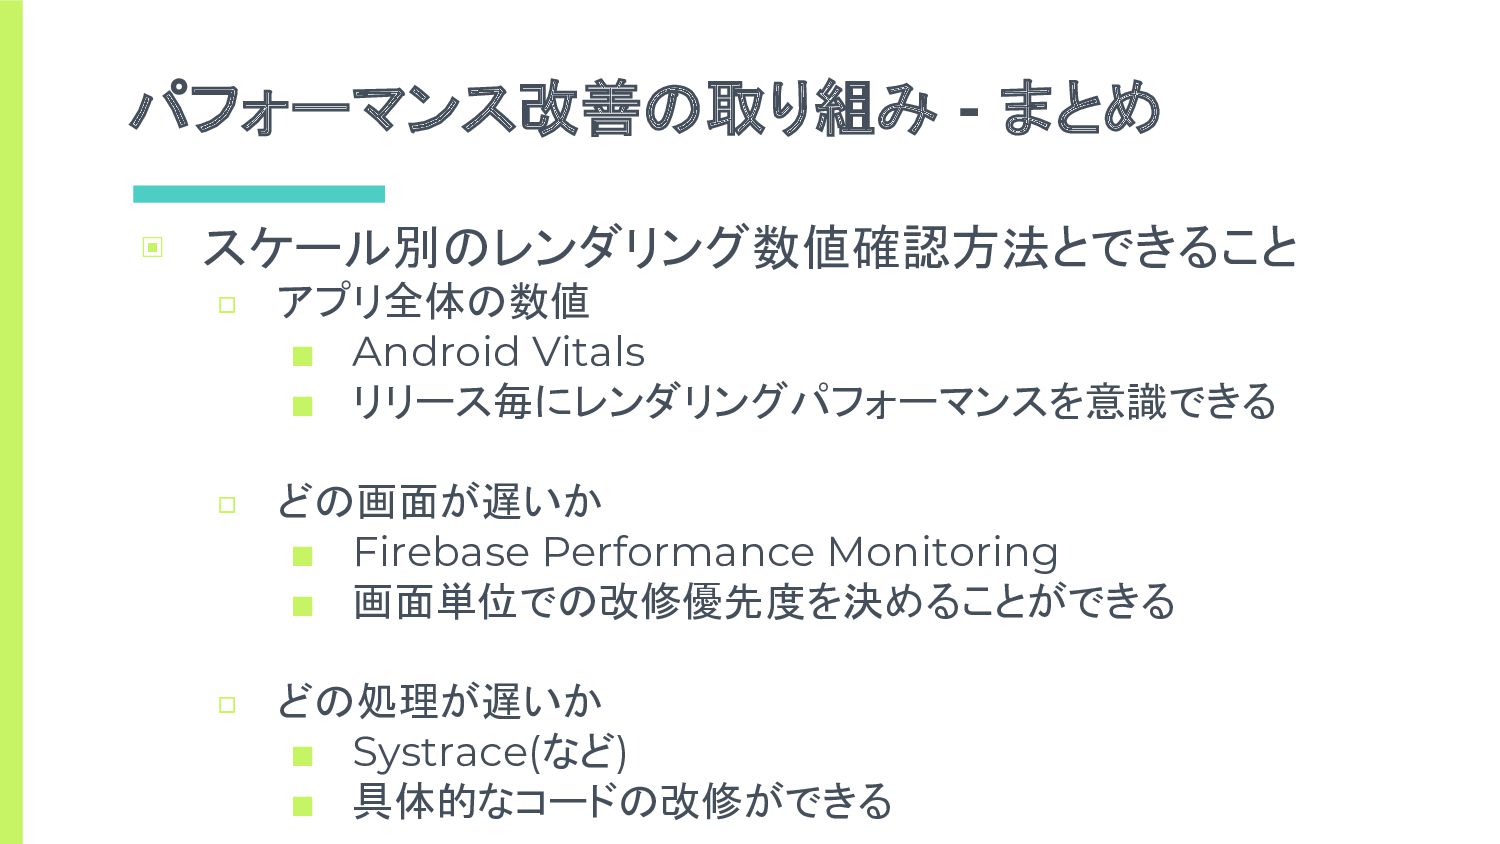
パフォーマンス改善の取り組み - まとめ ▣ スケール別のレンダリング数値確認方法とできること □ アプリ全体の数値 ▪ Android Vitals
▪ リリース毎にレンダリングパフォーマンスを意識できる □ どの画面が遅いか ▪ Firebase Performance Monitoring ▪ 画面単位での改修優先度を決めることができる □ どの処理が遅いか ▪ Systrace(など) ▪ 具体的なコードの改修ができる
パフォーマンス改善の取り組み - まとめ ▣ 改善例 □ ルート結果の例
終