to determine which blockchain/protocol to build on • Users: to find out which network is the most vibrant • VCs: to calibrate attention & help founders avoid protocol risk • Asset managers: to build baskets/weighted financial products Why bother?
chain • Blockchains are inherently hard to read • Practitioner – academic gap Why is it hard? "When a measure becomes a target, it ceases to be a good measure.” – Charles Goodhart
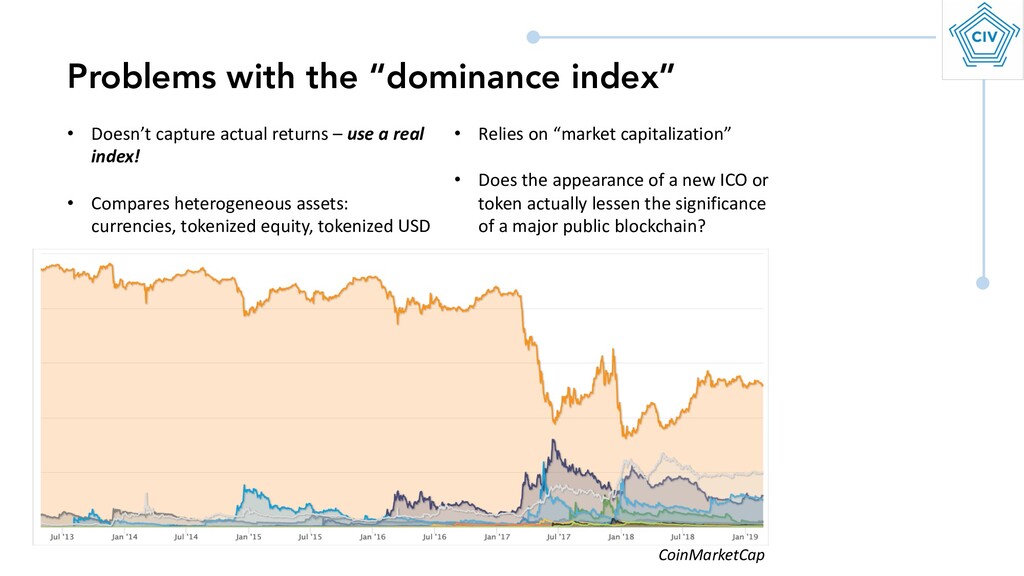
– use a real index! • Compares heterogeneous assets: currencies, tokenized equity, tokenized USD • Relies on “market capitalization” • Does the appearance of a new ICO or token actually lessen the significance of a major public blockchain? CoinMarketCap
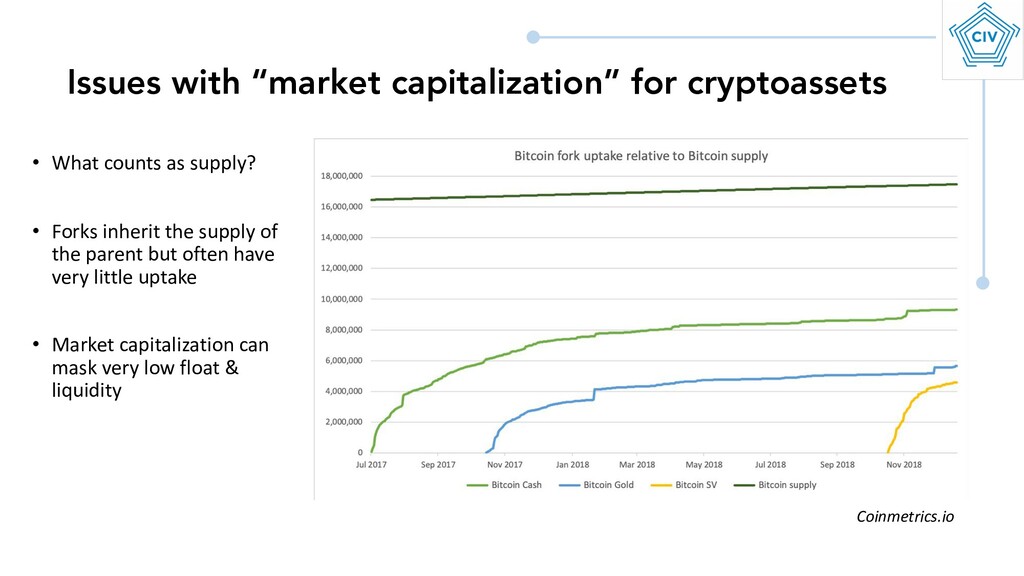
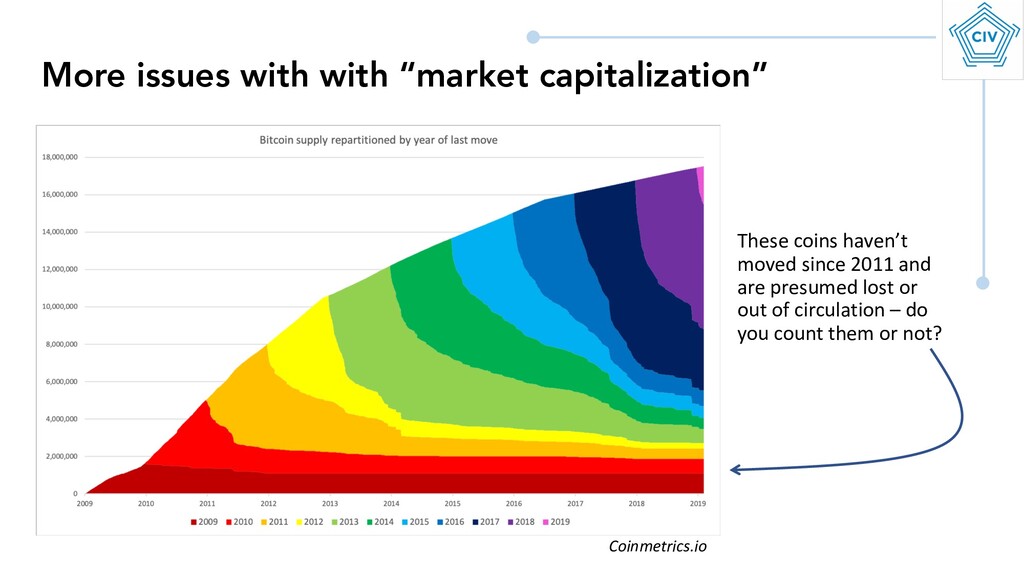
supply? • Forks inherit the supply of the parent but often have very little uptake • Market capitalization can mask very low float & liquidity Coinmetrics.io
147 m 142 b 100 b 22.5 m Asset 2050 expected supply n/a 72 m 100 b 100 b n/a Units at inception Defined at inception Being formalized Ad hoc Formalized 2017 Defined at inception Supply schedule 17.5 m 104 m 19.1 b 41 b 16.7 m Circ. supply 21 m Uncapped Uncapped 100 b Uncapped Ultimate supply Litecoin 83.9 m n/a Defined at inception 60 m 84 m No standard supply models means that consistent comparisons are nigh impossible
Coinmetrics.io • EOS and Tron dominate – but at the cost of centralized validation • 0-fee chains are trivial to game and create illusory economic activity • Not an ideal comparative measure
Tron • Measures the usage of the blockchain for final settlement • Transaction value is harder & costlier to fake • Adjustments are made to account for non-economic activity Coinmetrics.io
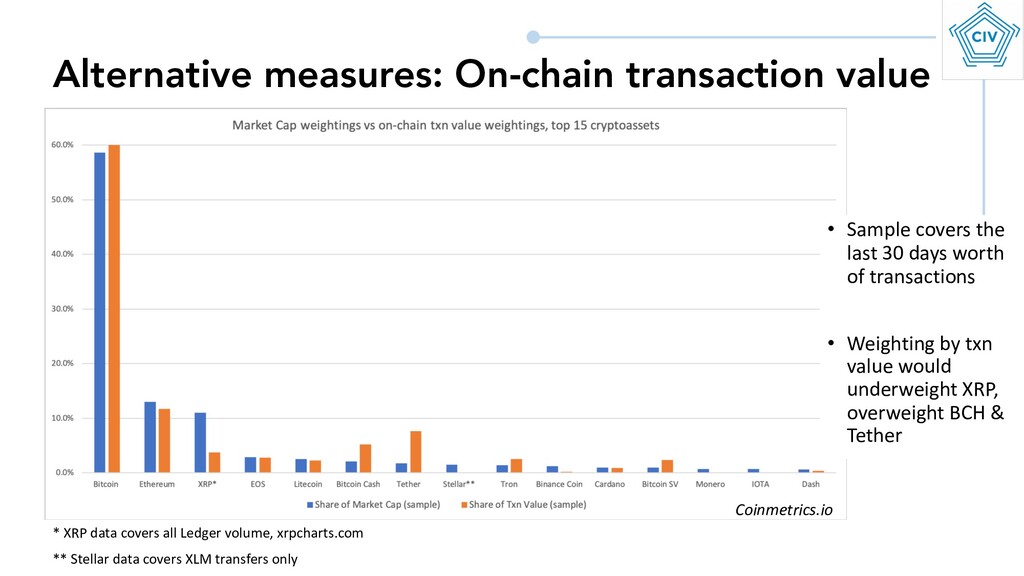
30 days worth of transactions • Weighting by txn value would underweight XRP, overweight BCH & Tether ** Stellar data covers XLM transfers only * XRP data covers all Ledger volume, xrpcharts.com Coinmetrics.io
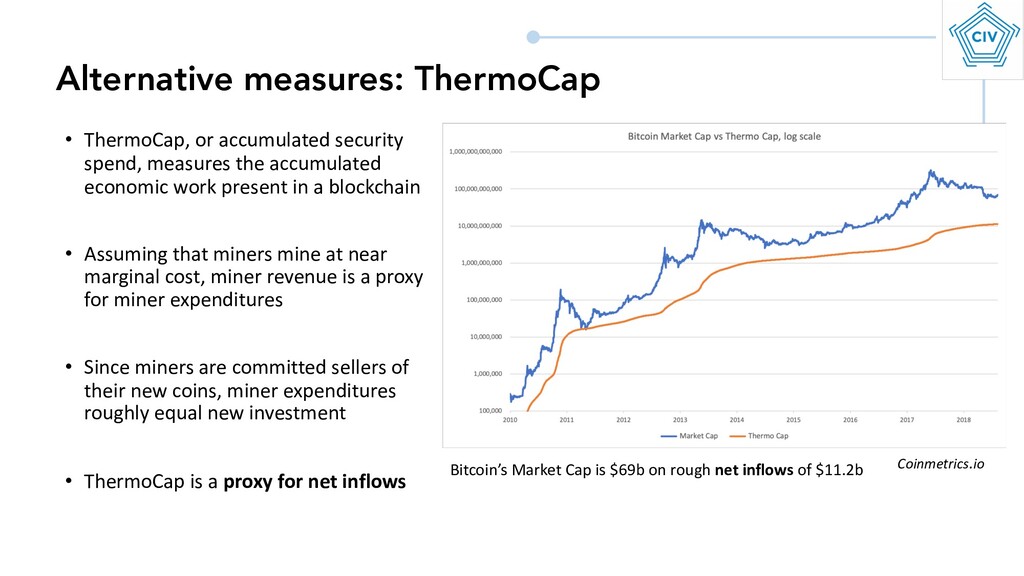
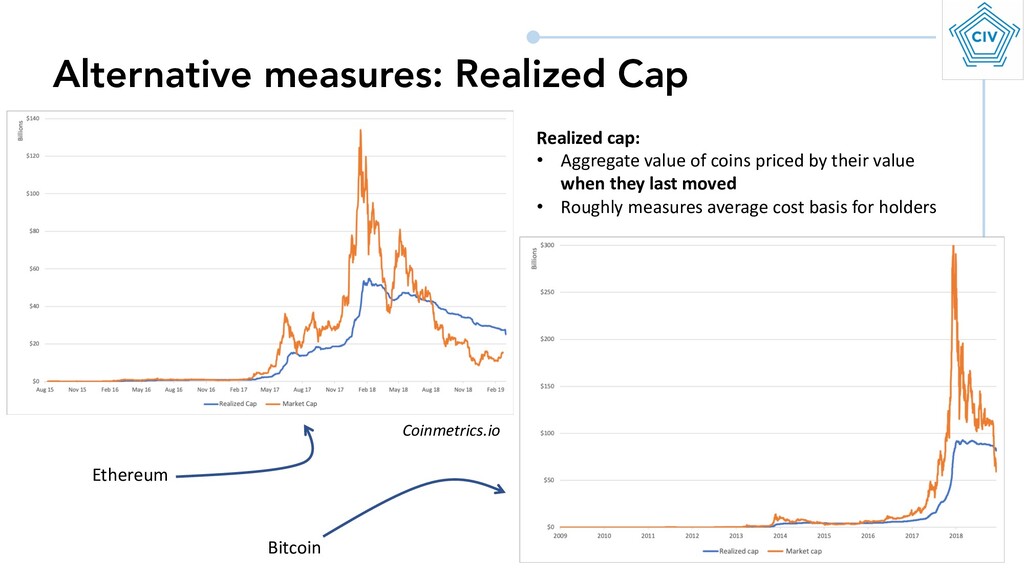
the accumulated economic work present in a blockchain • Assuming that miners mine at near marginal cost, miner revenue is a proxy for miner expenditures • Since miners are committed sellers of their new coins, miner expenditures roughly equal new investment • ThermoCap is a proxy for net inflows Coinmetrics.io Bitcoin’s Market Cap is $69b on rough net inflows of $11.2b
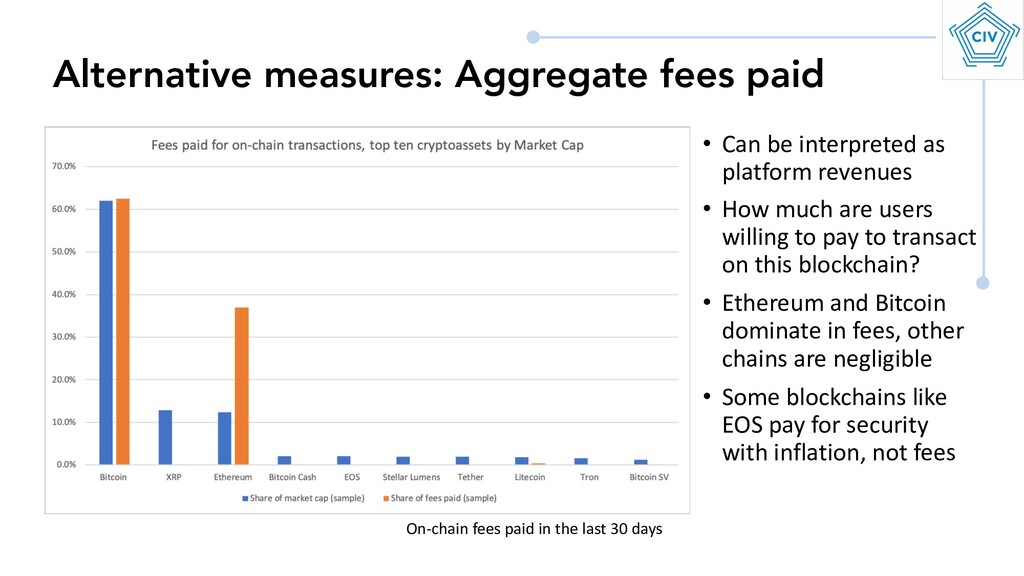
are users willing to pay to transact on this blockchain? • Ethereum and Bitcoin dominate in fees, other chains are negligible • Some blockchains like EOS pay for security with inflation, not fees Alternative measures: Aggregate fees paid On-chain fees paid in the last 30 days
a pattern of evidence must be built • No single metric captures all relevant information • Blockchain analysis is adversarial • The moment you define a desirable metric, someone will try to spoof it • Endless game of cat and mouse • Take a holistic approach • Public blockchains are mini economies, treat them as such Takeaways