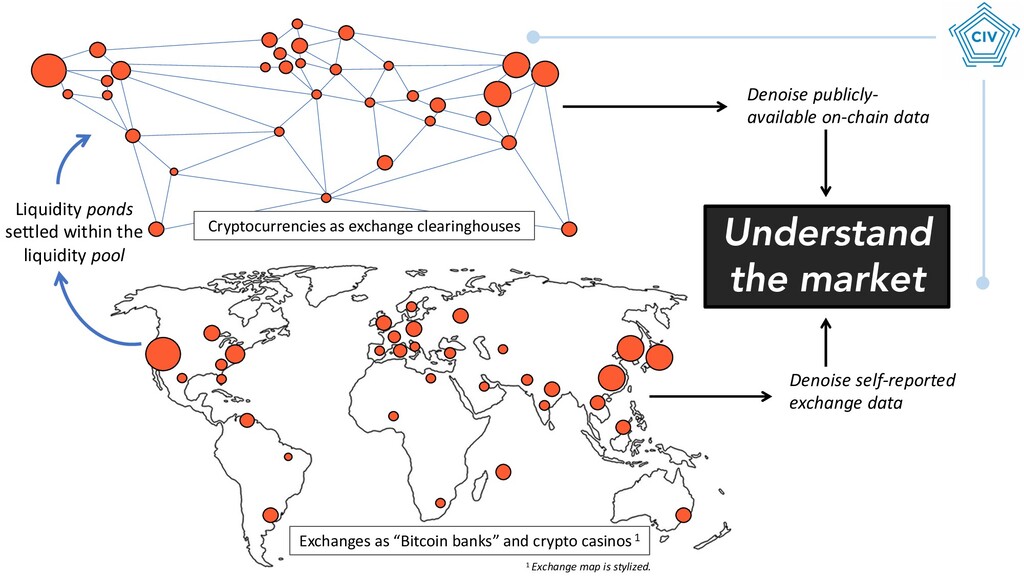
1 Exchange map is stylized. Cryptocurrencies as exchange clearinghouses Liquidity ponds settled within the liquidity pool Denoise publicly- available on-chain data Denoise self-reported exchange data
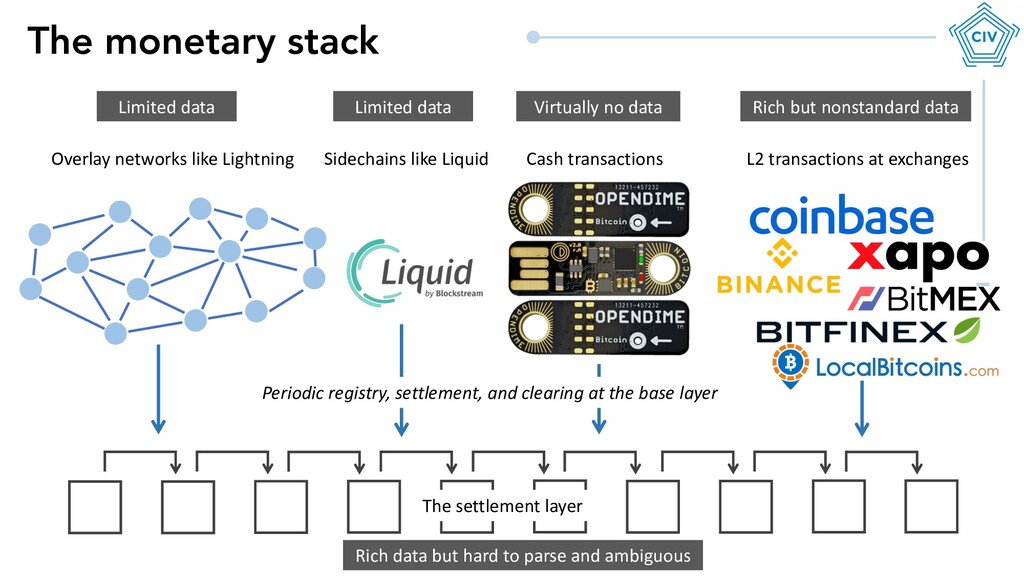
clearing at the base layer Overlay networks like Lightning Cash transactions L2 transactions at exchanges Sidechains like Liquid Limited data Limited data Virtually no data Rich but nonstandard data Rich data but hard to parse and ambiguous
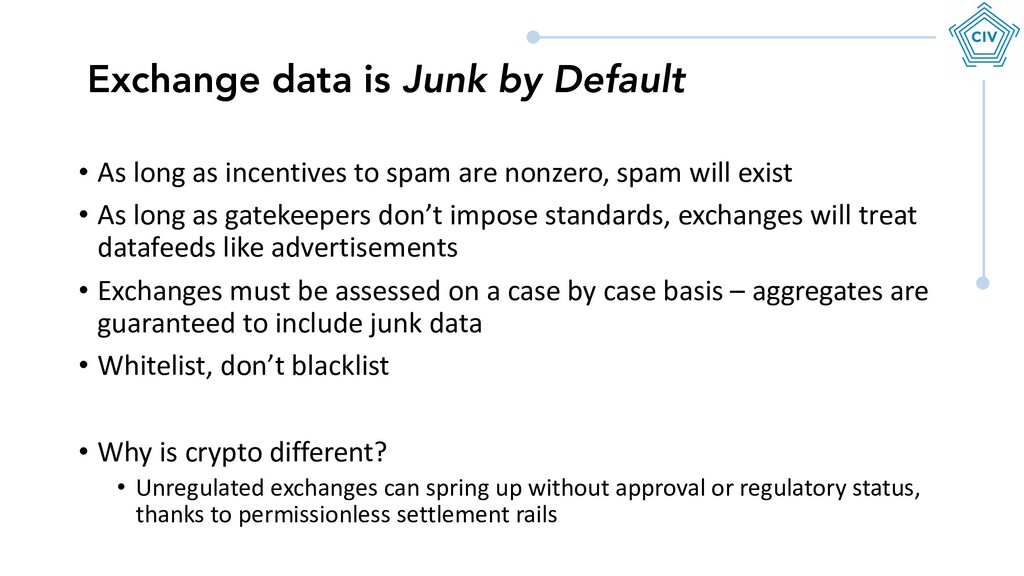
will exist • As long as gatekeepers don’t impose standards, exchanges will treat datafeeds like advertisements • Exchanges must be assessed on a case by case basis – aggregates are guaranteed to include junk data • Whitelist, don’t blacklist • Why is crypto different? • Unregulated exchanges can spring up without approval or regulatory status, thanks to permissionless settlement rails Exchange data is Junk by Default
• Determining relative vibrancy and uptake of cryptocurrencies • Ensuring that the chain has integrity and is secure • Keeping issuers honest • Auditing businesses that have on-chain components • Evaluating the impact of upgrades, hard forks, or marketing initiatives • In the future: granular financial reporting, continuous audits So how can you use on-chain data? If you’re not consulting the chain, you’re doing it wrong!
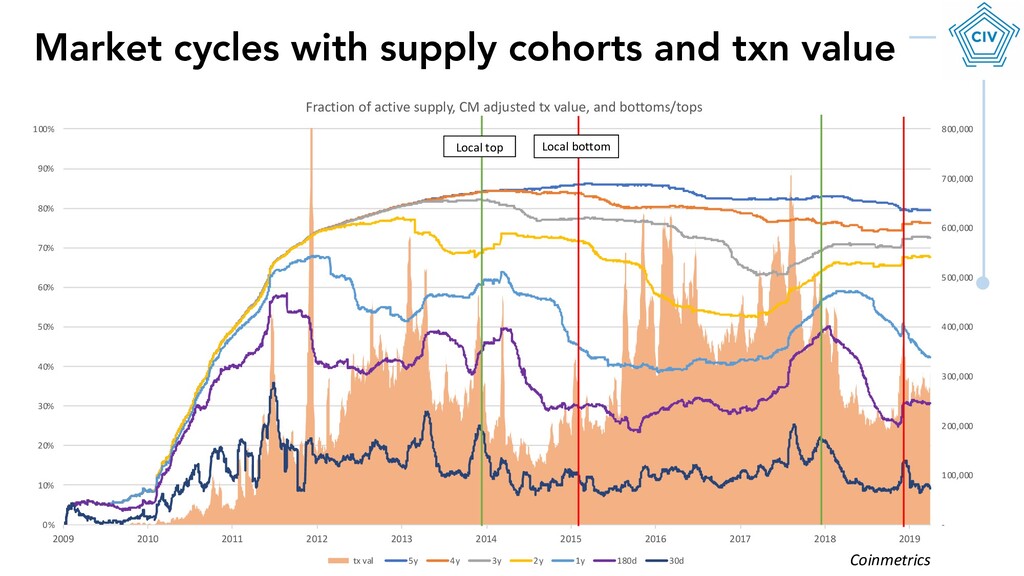
10% 20% 30% 40% 50% 60% 70% 80% 90% 100% 2009 2010 2011 2012 2013 2014 2015 2016 2017 2018 2019 Fraction of active supply, CM adjusted tx value, and bottoms/tops tx val 5y 4y 3y 2y 1y 180d 30d Local top Local bottom Market cycles with supply cohorts and txn value Coinmetrics
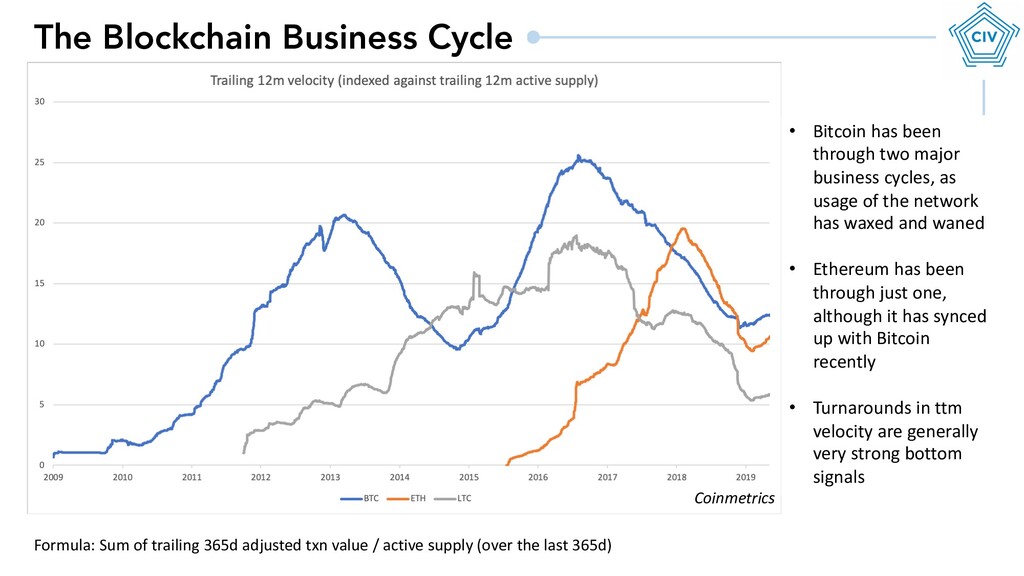
major business cycles, as usage of the network has waxed and waned • Ethereum has been through just one, although it has synced up with Bitcoin recently • Turnarounds in ttm velocity are generally very strong bottom signals Formula: Sum of trailing 365d adjusted txn value / active supply (over the last 365d) Coinmetrics
real velocity? Which measure of output? Which measure of supply? Bitcoin’s annual velocity is between 5 and 50, depending on how you count it I favor the most conservative: adjusted txn value and total supply Coinmetrics
Mini confirmed Z9 Mini ships Daily active addresses plummet after Equihash ASICs are introduced Addresses with a meaningful balance stop growing Early evidence that ASICs may reduce network vibrancy; first pointed out by Brian Venturo of Atlantic Crypto Coinmetrics
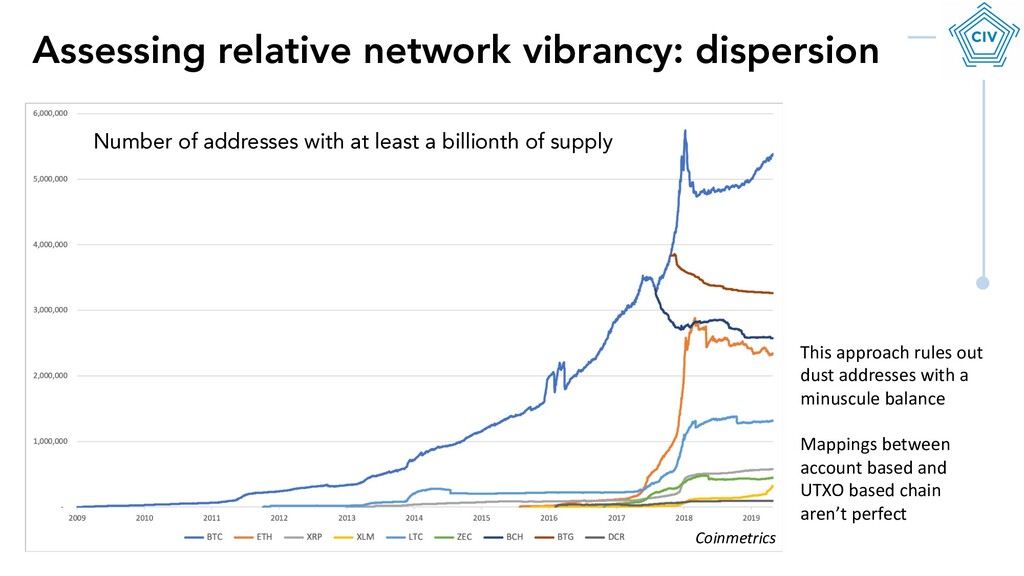
least a billionth of supply This approach rules out dust addresses with a minuscule balance Mappings between account based and UTXO based chain aren’t perfect Coinmetrics
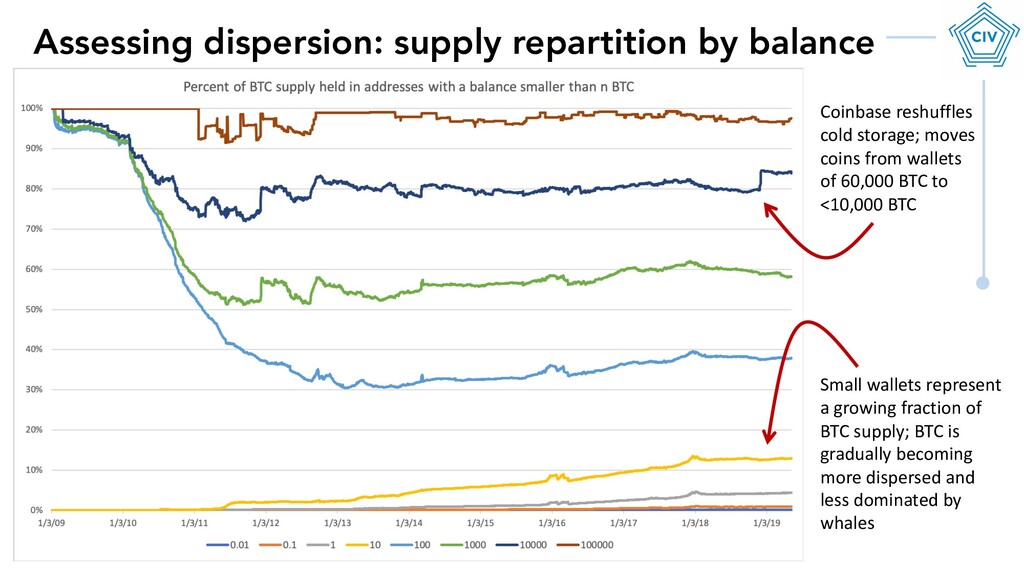
growing fraction of BTC supply; BTC is gradually becoming more dispersed and less dominated by whales Coinbase reshuffles cold storage; moves coins from wallets of 60,000 BTC to <10,000 BTC
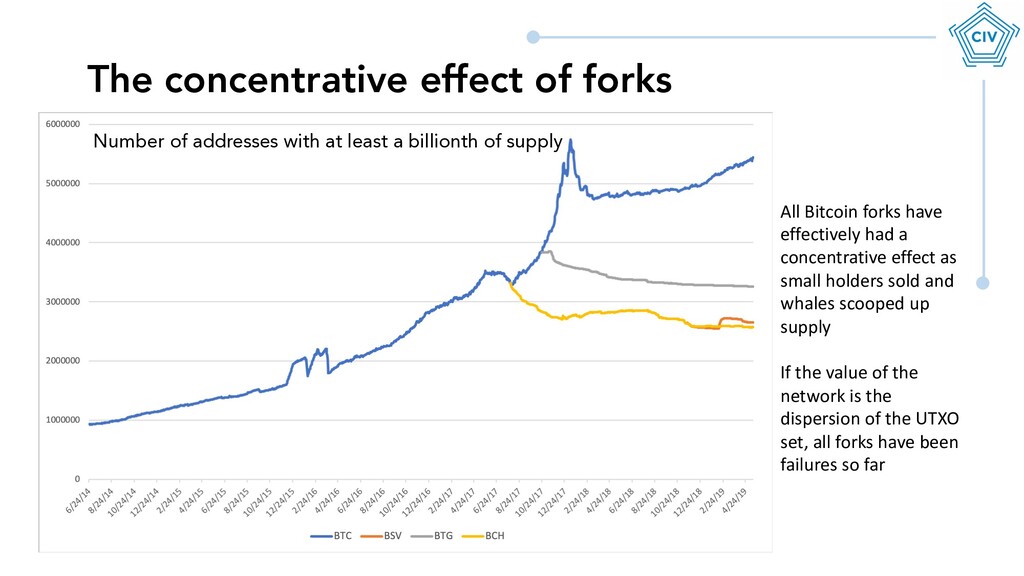
had a concentrative effect as small holders sold and whales scooped up supply If the value of the network is the dispersion of the UTXO set, all forks have been failures so far Number of addresses with at least a billionth of supply
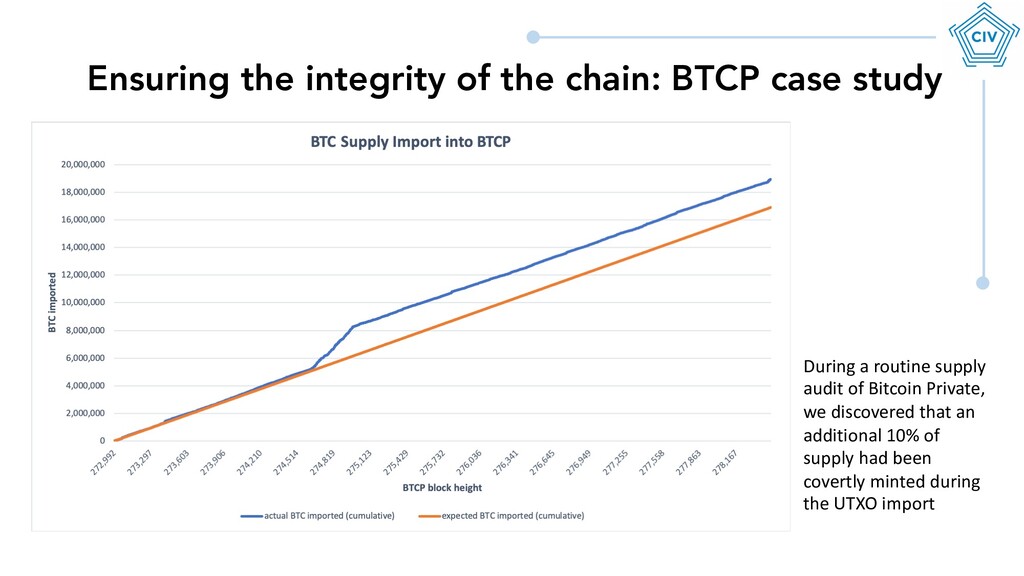
In vetting Ripple’s quarterly disclosures regarding their escrow releases, we found that they under-reported the XRP released from escrow by 200m XRP (~$76m at today’s prices) • This in effect constituted additional dilution not reported to investors and users
• Granular macroeconomic data: real-time GDP, inflation, interest rates, etc • Fully transparent financials for foundations, nonprofits, etc • On-chain cashflows for new forms of organizations will enable instant disclosure rather than quarterly reports – markets will be able to efficiently price in new information Future directions for on-chain data
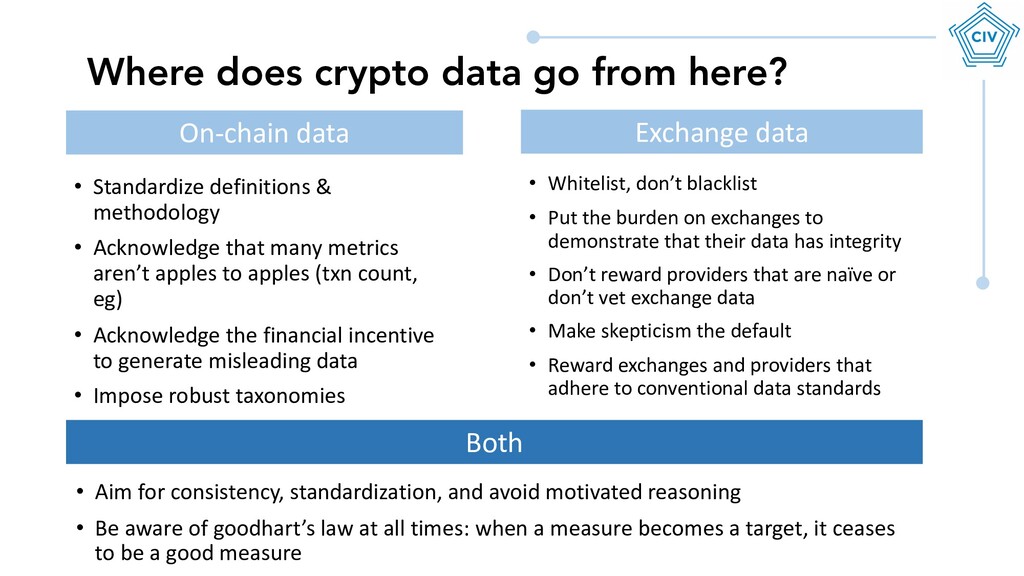
aren’t apples to apples (txn count, eg) • Acknowledge the financial incentive to generate misleading data • Impose robust taxonomies Where does crypto data go from here? On-chain data Exchange data • Whitelist, don’t blacklist • Put the burden on exchanges to demonstrate that their data has integrity • Don’t reward providers that are naïve or don’t vet exchange data • Make skepticism the default • Reward exchanges and providers that adhere to conventional data standards Both • Aim for consistency, standardization, and avoid motivated reasoning • Be aware of goodhart’s law at all times: when a measure becomes a target, it ceases to be a good measure