Upgrade to Pro — share decks privately, control downloads, hide ads and more …

Bitcoin as a Novel Economic Institution

Nic Carter
September 06, 2019

Bitcoin as a Novel Economic Institution

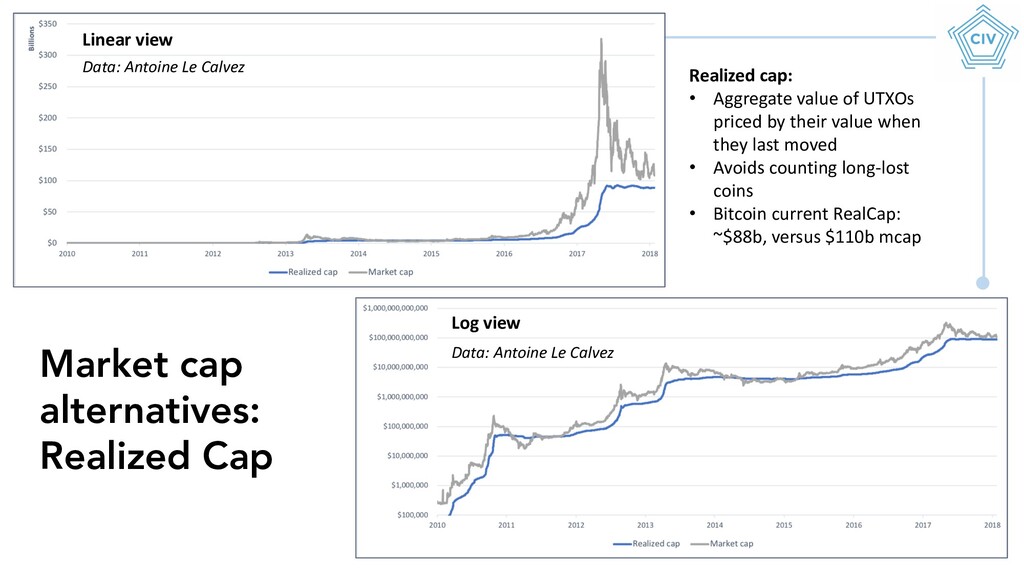
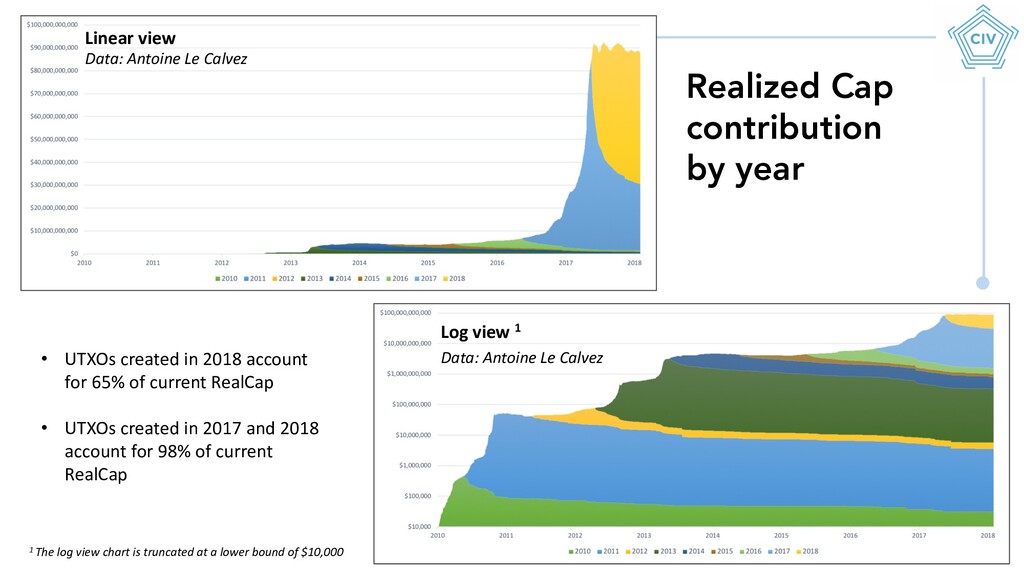
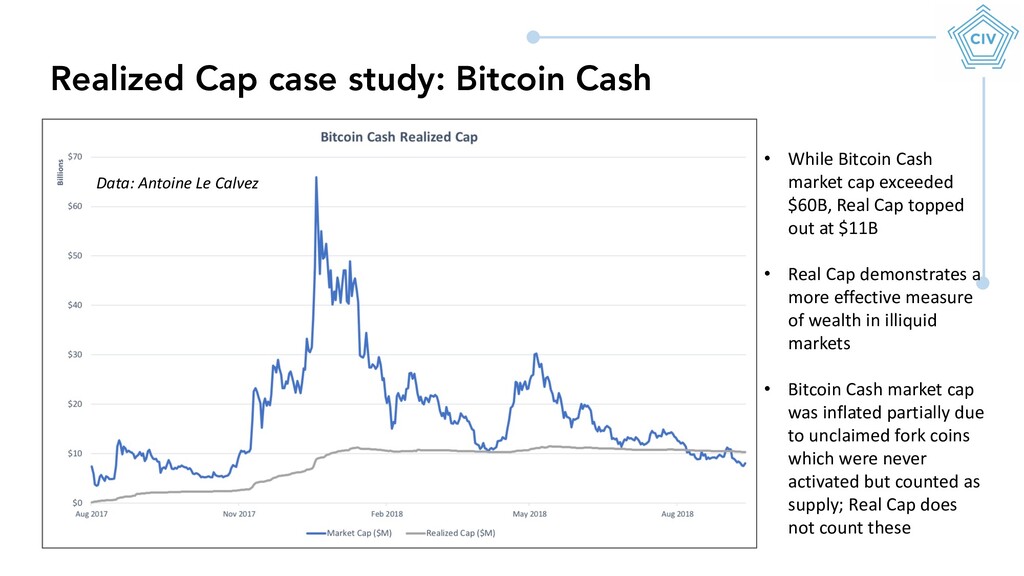
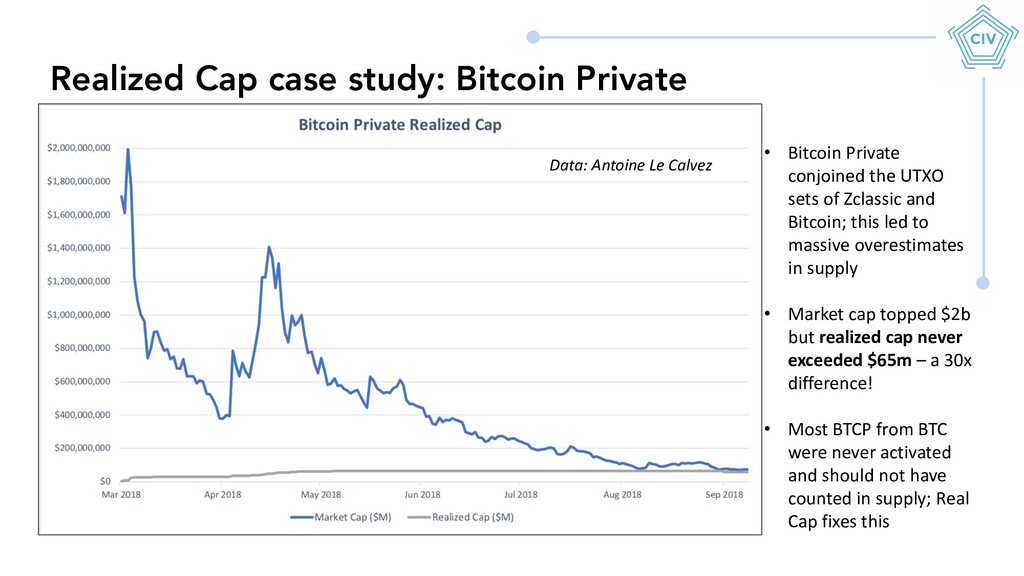
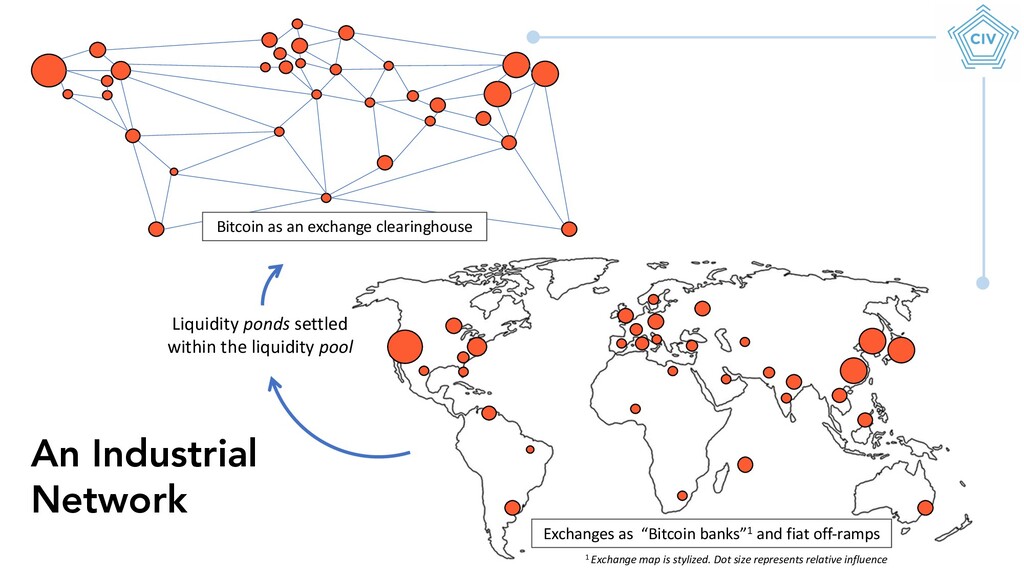
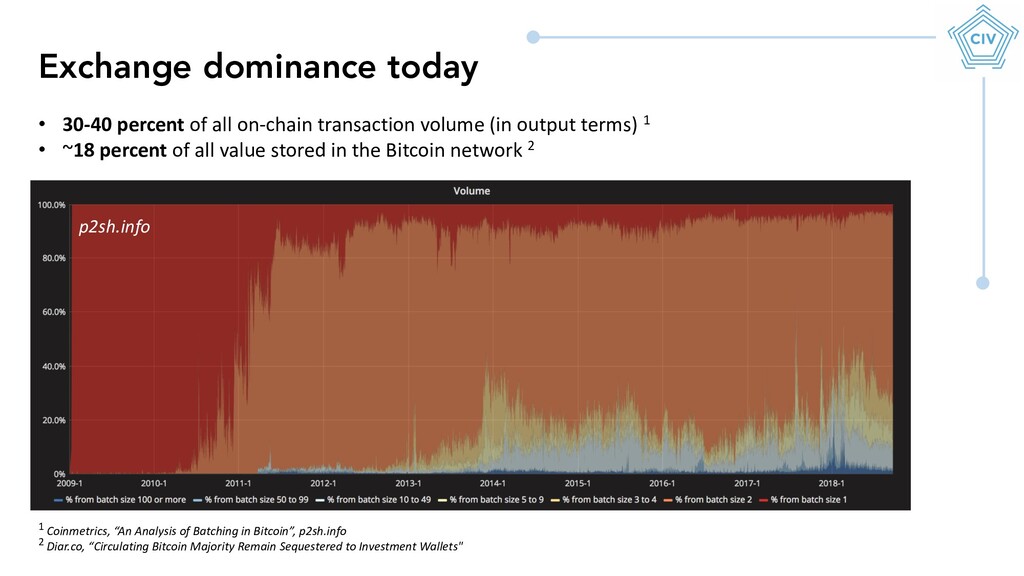
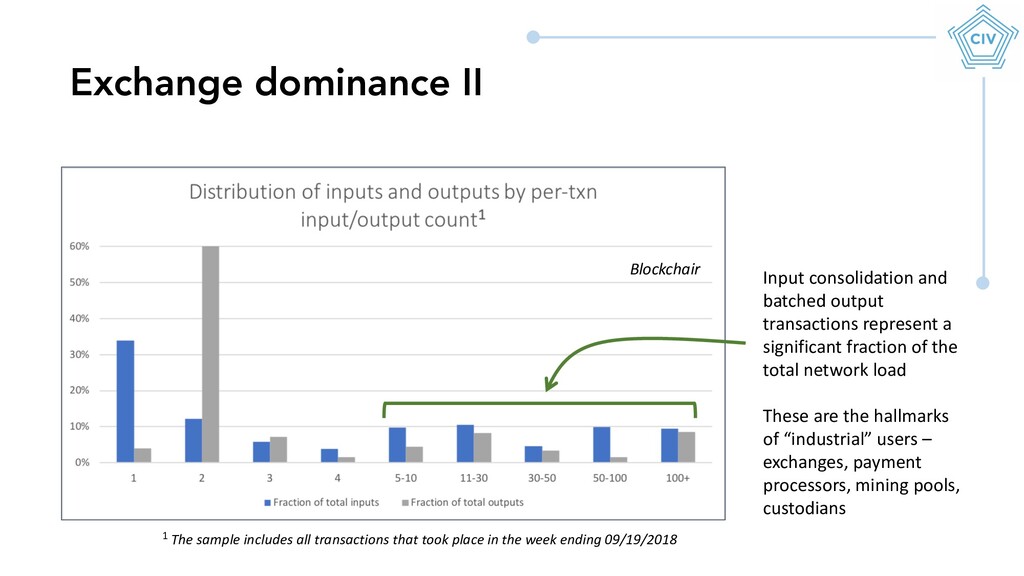
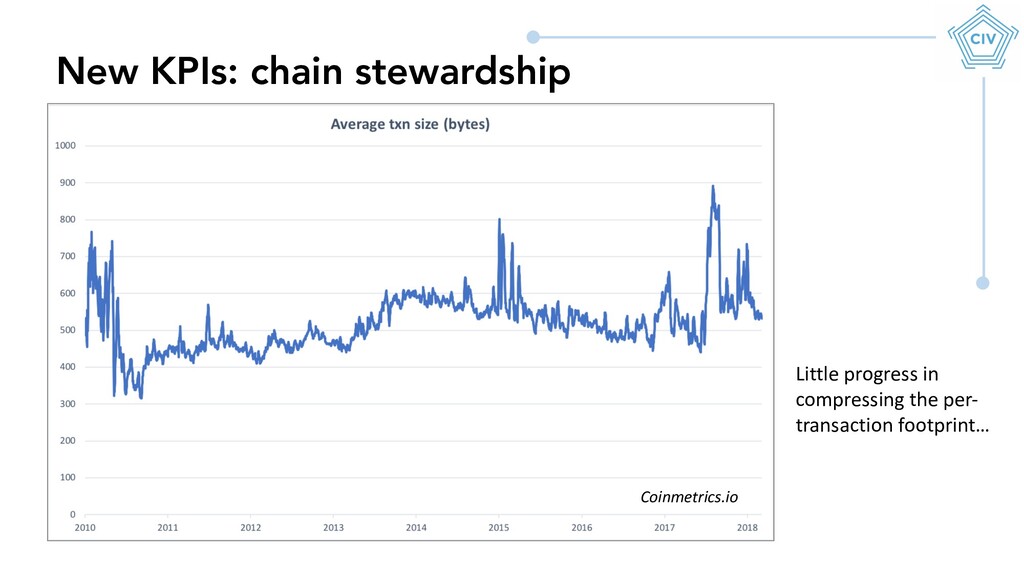
I issue a critique of popular measures of Bitcoin's economic size and throughput, and introduce the novel measure of 'realized capitalization'. I then describe how Bitcoin is trending towards partial intermediation, and how Bitcoiners can reckon with this reality.

Nic Carter

September 06, 2019
Tweet

More Decks by Nic Carter

Other Decks in Business

Transcript

  1. Most approaches to quantitatively measuring Bitcoin are terrible Contents Bitcoin’s

    economic throughput is paramount ‘Market cap’ sucks, let’s replace it I. Taking Stock Bitcoin is an industrial network, dominated by exchanges Let’s aim to maximize economic density We can keep intermediaries in check II. Looking Ahead
  2. What is Bitcoin’s actual economic throughput? Raw output (bitinfocharts) With

    knowable changed removed (coinmetrics) With more change + churn removed (coinmetrics) Even more adjustments (blockchain.info) Merchant payments at major processors 1 $6.5 billion $3.6 billion $1.8 billion $0.69 billion $3 million Method Daily txn value $2.37 trillion $1.3 trillion $0.65 trillion $0.25 trillion $1.09 billion Annualized 25.4 14.1 7.04 2.7 0.01 Velocity 2 1 Bitpay, Coinify, GoCoin 2 Supply reduced by 15% to account for lost coins
  3. Measuring BTC wealth stock: the problem with ‘Market Cap’ •

    This is a chart of units of Bitcoin based on when they were last active • This is also the Unchained Capital HodlWaves chart with the axes flipped • This chart lets you estimate lost or inactive BTC Data: Antoine Le Calvez
  4. Market cap alternatives: Realized Cap Realized cap: • Aggregate value

    of UTXOs priced by their value when they last moved • Avoids counting long-lost coins • Bitcoin current RealCap: ~$88b, versus $110b mcap Linear view Log view Data: Antoine Le Calvez Data: Antoine Le Calvez
  5. Realized Cap contribution by year Data: Antoine Le Calvez Data:

    Antoine Le Calvez Linear view Log view 1 • UTXOs created in 2018 account for 65% of current RealCap • UTXOs created in 2017 and 2018 account for 98% of current RealCap 1 The log view chart is truncated at a lower bound of $10,000
  6. Realized Cap case study: Bitcoin Cash • While Bitcoin Cash

    market cap exceeded $60B, Real Cap topped out at $11B • Real Cap demonstrates a more effective measure of wealth in illiquid markets • Bitcoin Cash market cap was inflated partially due to unclaimed fork coins which were never activated but counted as supply; Real Cap does not count these Data: Antoine Le Calvez
  7. Realized Cap case study: Bitcoin Private • Bitcoin Private conjoined

    the UTXO sets of Zclassic and Bitcoin; this led to massive overestimates in supply • Market cap topped $2b but realized cap never exceeded $65m – a 30x difference! • Most BTCP from BTC were never activated and should not have counted in supply; Real Cap fixes this Data: Antoine Le Calvez
  8. An Industrial Network Exchanges as “Bitcoin banks”1 and fiat off-ramps

    1 Exchange map is stylized. Dot size represents relative influence Bitcoin as an exchange clearinghouse Liquidity ponds settled within the liquidity pool
  9. Exchange dominance today • 30-40 percent of all on-chain transaction

    volume (in output terms) 1 • ~18 percent of all value stored in the Bitcoin network 2 1 Coinmetrics, “An Analysis of Batching in Bitcoin”, p2sh.info 2 Diar.co, “Circulating Bitcoin Majority Remain Sequestered to Investment Wallets" p2sh.info
  10. Blockchair Exchange dominance II 1 The sample includes all transactions

    that took place in the week ending 09/19/2018 Input consolidation and batched output transactions represent a significant fraction of the total network load These are the hallmarks of “industrial” users – exchanges, payment processors, mining pools, custodians
  11. Lightning and other deferred settlement Spenders Savers Bank Exchange Custodian

    Fiat offramp Lightning custodian The intermediated chain Payment processor
  12. New KPIs: economic density Coinmetrics.io The economic weight of a

    byte continues to increase… Economic density weighs the output of the chain against the cost (to full nodes)
  13. New KPIs: fee ratio Q: “If block rewards went to

    0 tomorrow, what percent of economic volume would we have to pay in fees to replace them?” Coinmetrics.io Coinmetrics.io A: About 0.6% of economic volume would have to be paid in fees to support an equivalent level of security
  14. • You can’t fight reality – they are here to

    stay • Hal Finney was right about the Bitcoin banks – we just call them exchanges • Most users prefer the UX of intermediated custody, payments, exchange • Intermediaries allow users to select scale and convenience tradeoffs Wait… aren’t we trying to dis-intermediate? • Intermediation and trust-minimization are not incompatible! • Bitcoin’s hard money and scarcity properties can still remain intact but…
  15. • Users: focus on chain stewardship • Lobby for Segwit,

    batching – minimize on-chain impact • Reward institutions that respect Bitcoin’s design philosophy and p2p network governance process, don’t support hostile forks • Demand segregated accounts at custodians & proofs of reserves • Allocators: support hybrid intermediaries which leverage BTC’s settlement guarantees • Non-custodial custodians, p2p exchanges, contract arbitrators, noncustodial payment processors • Maintain focus on verification cost, long-term sustainability • Give users the option of running a node so exit costs are low • Developers: explore the transition from issuance-funded security to fee- funded security Let’s encourage responsible behavior
  16. • Let’s have an honest conversation about measuring wealth held

    in Bitcoin • Proposed alternative: Realized Cap • Or, just reduce supply appropriately • Economic throughput, not transaction count matters – because txns can pack a huge punch! • Proposed KPIs: economic density, fee ratio, payments per transaction • Let’s be realistic about the Bitcoin economy today – intermediation exists, and is here to stay • But – we can keep them in check Takeaways
  17. Appendix Service Type Annual throughput (Billion USD) Source SWIFT Messaging

    1,825,000 https://www.fincen.gov/sites/default/files/shared/Appendix_D.pdf Fedwire Realtime settlement 766,500 https://www.fincen.gov/sites/default/files/shared/Appendix_D.pdf CHIPS Realtime settlement 511,000 https://www.fincen.gov/sites/default/files/shared/Appendix_D.pdf Visa Payments 8,400 https://www.digitaltransactions.net/visa-surpasses-2-trillion-in-payment-volume-in-its-third-quarter/ Alipay Payments 6,480 https://www.scmp.com/tech/apps-gaming/article/2134011/china-pulls-further-ahead-us-mobile-payments-record-us128-trillion Mastercard Payments 6,000 https://www.pymnts.com/news/retail/2018/mastercard-sees-cross-border-volumes-up-19-percent/ Wechat Payments 4,800 https://www.scmp.com/tech/apps-gaming/article/2134011/china-pulls-further-ahead-us-mobile-payments-record-us128-trillion Bitcoin (aggressive) Settlement 2,372 Coinmetrics American express Payments 732 https://247wallst.com/banking-finance/2018/06/26/will-amazon-deal-drive-american-express-volume-past-mastercard/ Bitcoin (conservative) Settlement 657 blockchain.info Global remittances Settlement 636 https://sibc.nd.edu/assets/228986/bain_wu_final.pdf OTC gold (LBMA) Physical settlement 446 http://www.lbma.org.uk/clearing-statistics Square Payments 86 https://www.pymnts.com/earnings/2018/transaction-volume-subscriptions-square-q2-earnings-beat/ Western union Settlement 70 https://sibc.nd.edu/assets/228986/bain_wu_final.pdf Year Payments volume (billion USD) Source 2010 3,592 http://www.annualreports.com/HostedData/AnnualReportArchive/v/NYSE_V_2012.pdf 2011 3,700 https://s1.q4cdn.com/050606653/files/doc_financials/Visa%20Q1%202012%20Operational%20Performance%20Data.pdf 2012 3,900 https://s1.q4cdn.com/050606653/files/doc_financials/Visa%20Q1%202012%20Operational%20Performance%20Data.pdf 2013 4,230 http://www.annualreports.com/HostedData/AnnualReportArchive/v/NYSE_V_2012.pdf 2014 4,700 http://www.annualreports.com/HostedData/AnnualReportArchive/v/NYSE_V_2012.pdf 2015 4,900 https://s1.q4cdn.com/050606653/files/doc_financials/annual/Visa-2016-Annual-Report.pdf 2016 5,800 https://s1.q4cdn.com/050606653/files/doc_financials/annual/Visa-2016-Annual-Report.pdf 2017 6,800 https://s1.q4cdn.com/050606653/files/doc_financials/annual/Visa-2016-Annual-Report.pdf 2018 8,400 https://www.digitaltransactions.net/visa-surpasses-2-trillion-in-payment-volume-in-its-third-quarter/ Historical Visa payment volume Settlement/payments volume for various services