Upgrade to Pro — share decks privately, control downloads, hide ads and more …

Modelling home to school travel for state pupils in England, 2008-2011, GISRUK 2014

nickbearman
April 18, 2014
28k

Modelling home to school travel for state pupils in England, 2008-2011, GISRUK 2014

Presented at GISRUK2014, University of Glasgow on 18th April 2014.
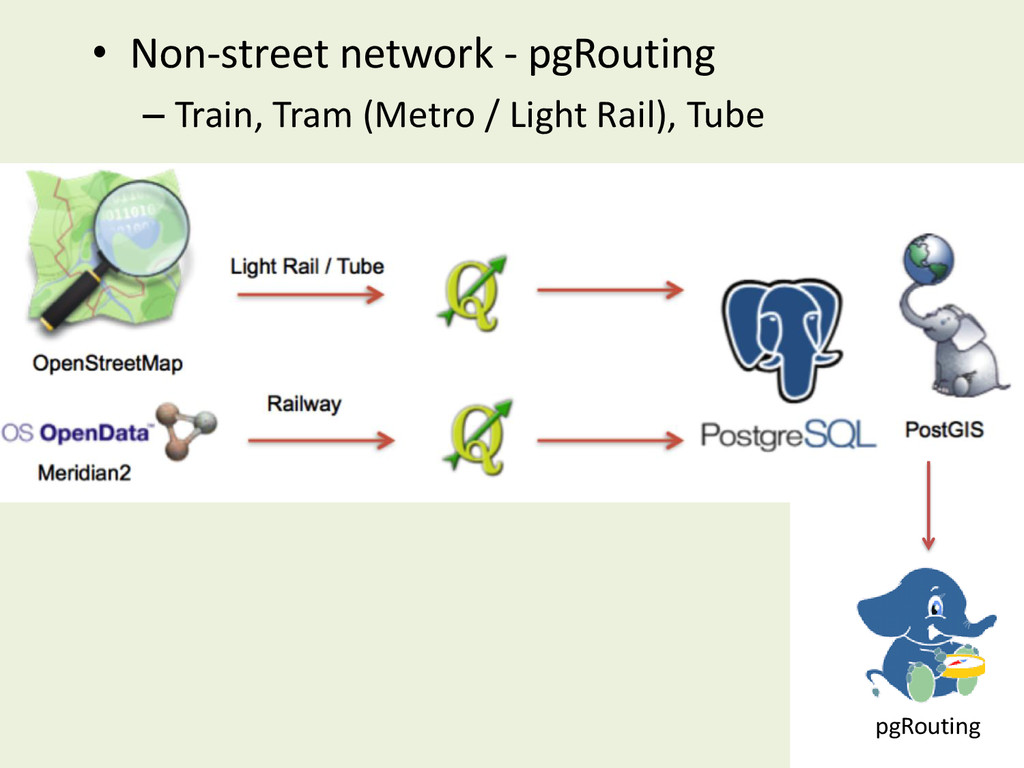
Discussion of work on home to school travel project for state school children in England, 2008-2011 using R, Routino and pgRouting

nickbearman

April 18, 2014
Tweet

More Decks by nickbearman

Transcript

  1. Dr Nick Bearman, CGeog (GIS) Department of Geography and Planning

    Modelling home to school travel for state pupils in England, 2008-2011 @nickbearmanuk http://www.fotolog.com/luckyshot/41568423/ https://twitter.com/Peter_Tennant/status/444404118330044416
  2. Overview • Home to school travel • Data, technical challenges

    & modeling routes • Primary to Secondary transition
  3. Home to School Travel • About 7.5m school aged children

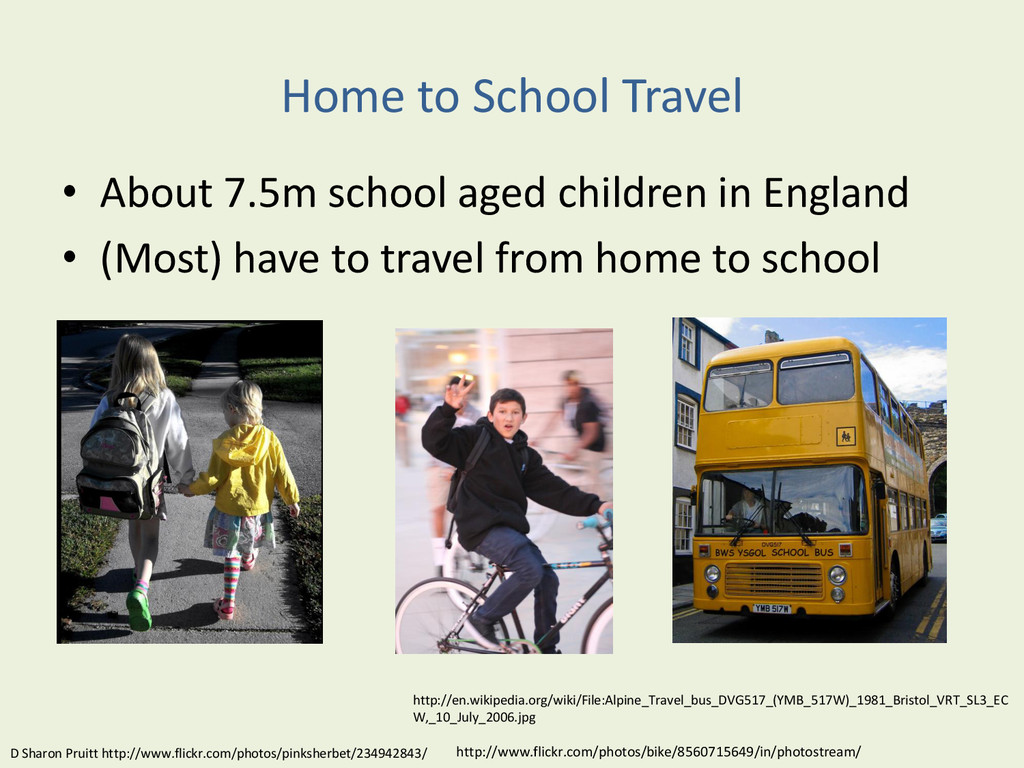
    in England • (Most) have to travel from home to school D Sharon Pruitt http://www.flickr.com/photos/pinksherbet/234942843/ http://www.flickr.com/photos/bike/8560715649/in/photostream/ http://en.wikipedia.org/wiki/File:Alpine_Travel_bus_DVG517_(YMB_517W)_1981_Bristol_VRT_SL3_EC W,_10_July_2006.jpg
  4. • What influences choice? – Distance – Pupil age –

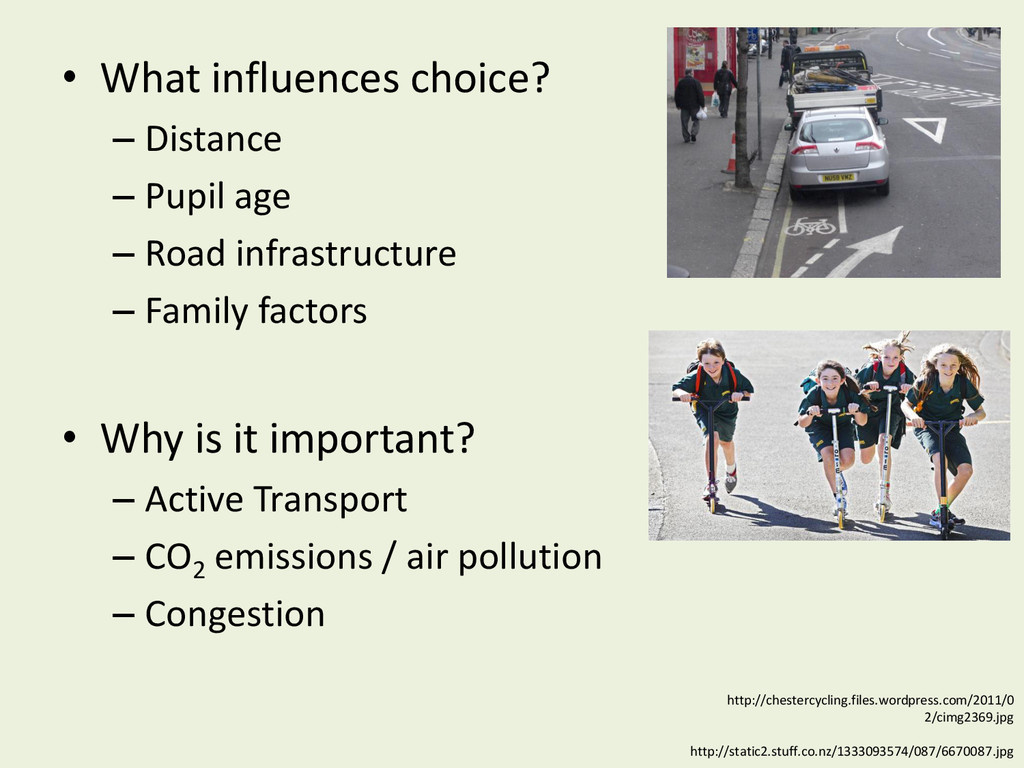
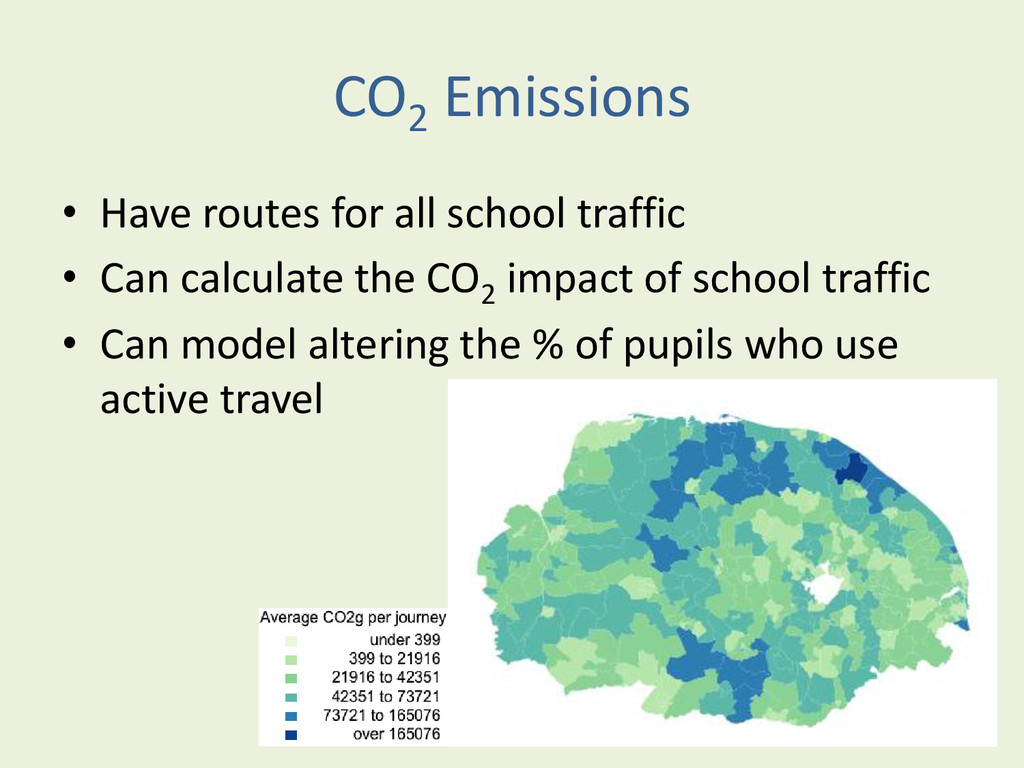
    Road infrastructure – Family factors • Why is it important? – Active Transport – CO2 emissions / air pollution – Congestion http://chestercycling.files.wordpress.com/2011/0 2/cimg2369.jpg http://static2.stuff.co.nz/1333093574/087/6670087.jpg
  5. Data sources • Pupil Level Annual School Census (2008-2011) –

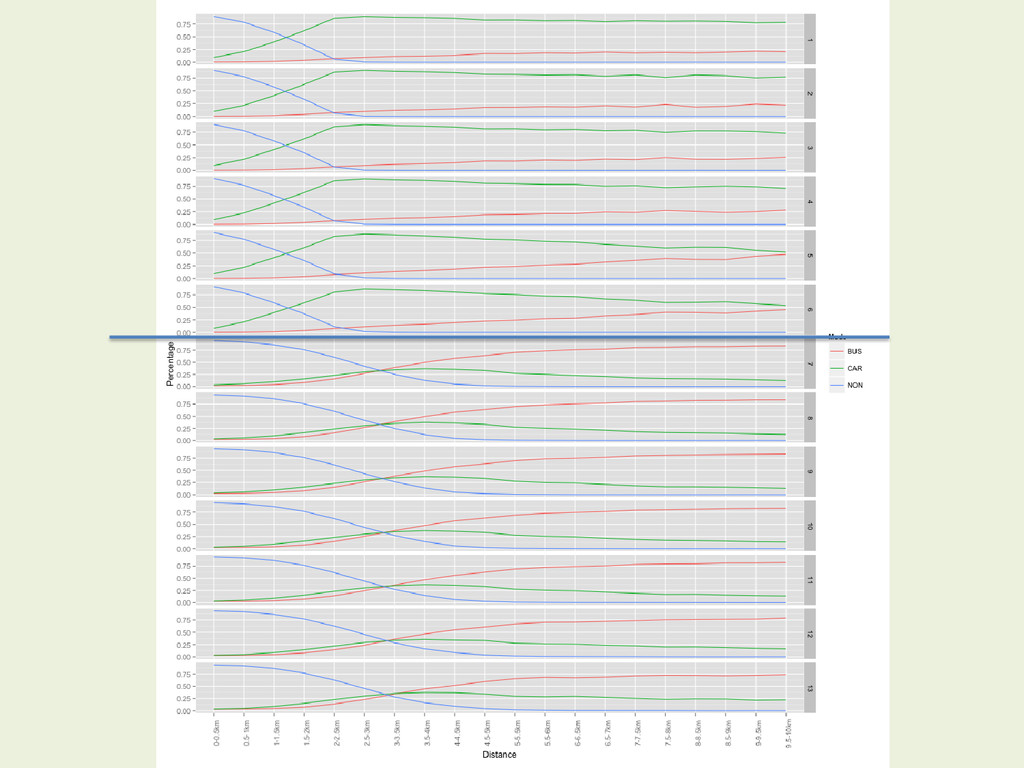
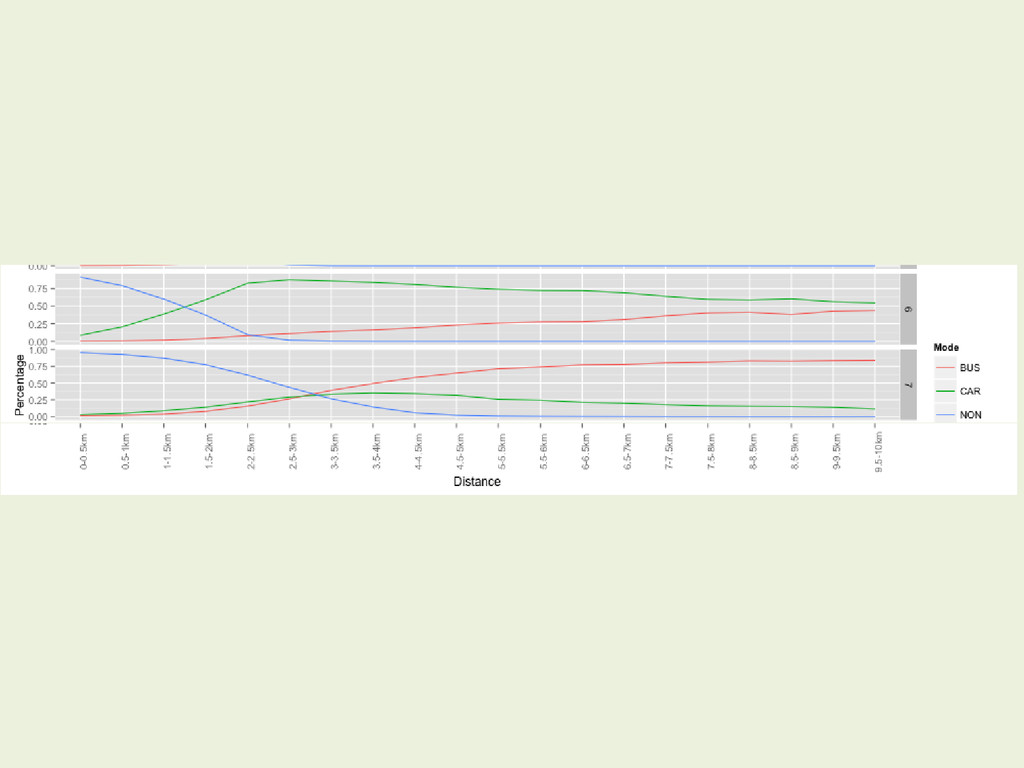
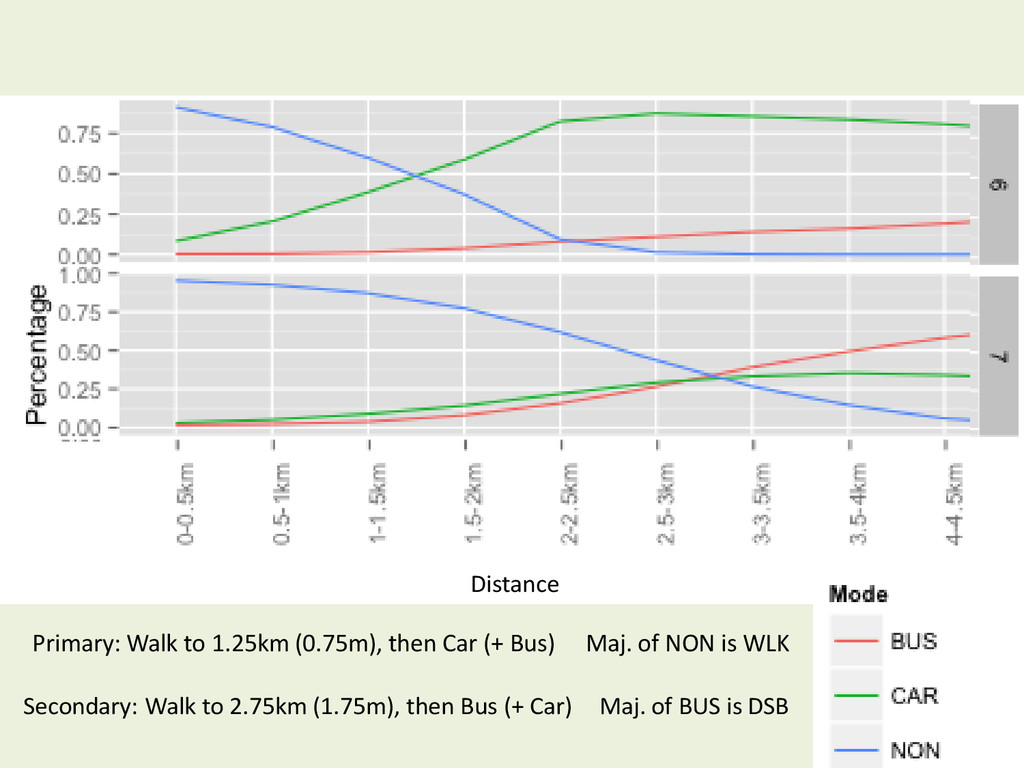
    Pupil home postcode – “Usual” mode of travel (11 options) – Data for each year – State schools only (Independent schools ~ 7%) • Edubase - school information • CO2 emissions by travel mode
  6. Traditional estimation technique • Euclidean distance • Average emissions values

    for mode of transport • Straight lines will typically underestimate true distances • No sensitivity to different vehicle types
  7. Technical challenges • Large data sets • Multiple routing modes

    • Long run times • Confidential data Arne Hückelheim (author) http://en.wikipedia.org/wiki/File:SunsetTracksCrop.JPG
  8. Routing: School census • 5m school children with records for

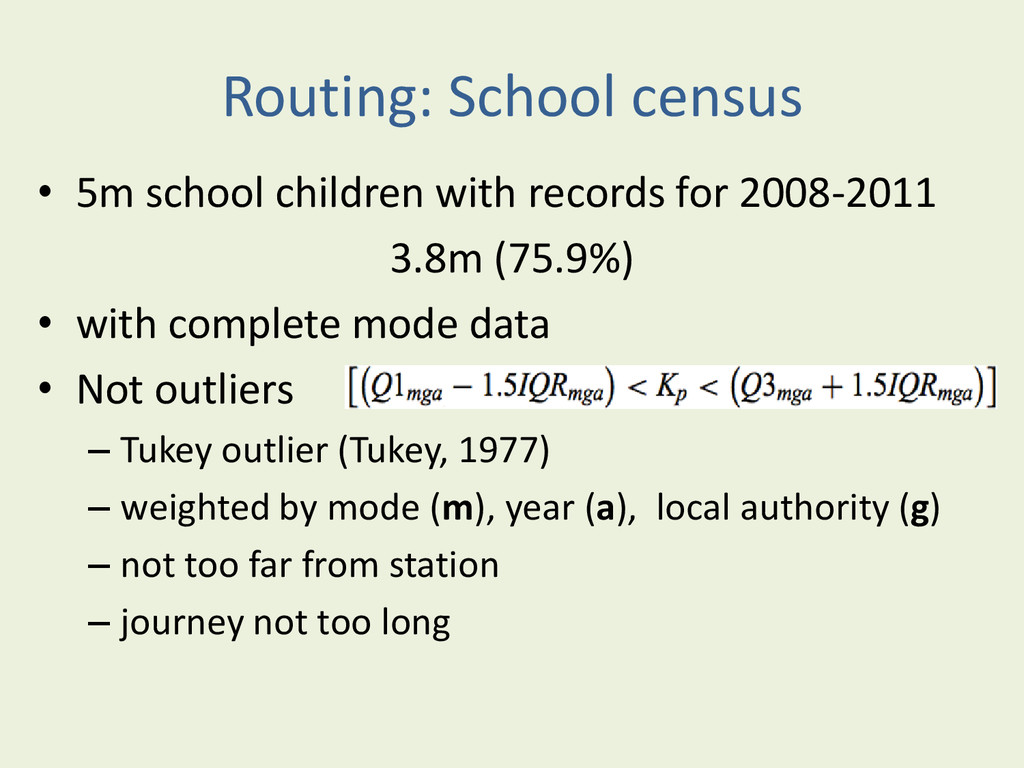
    2008-2011 3.8m (75.9%) • with complete mode data • Not outliers – Tukey outlier (Tukey, 1977) – weighted by mode (m), year (a), local authority (g) – not too far from station – journey not too long
  9. Routing: Mode of travel • Home: L11 4SH School: L11

    0BP Mode: WLK • Street network • Non-street network C. G. P. Grey http://en.wikipedia.org/wiki/File:Citadis_dublin.jpg
  10. • Street network - OpenStreetMap & Routino – Walk, Cycle,

    Car (+ Car Share), Taxi – Bus (public, school, unknown) Text file: • Distance • Route
  11. Home: L11 4SH School: L11 0BP Mode: WLK • R

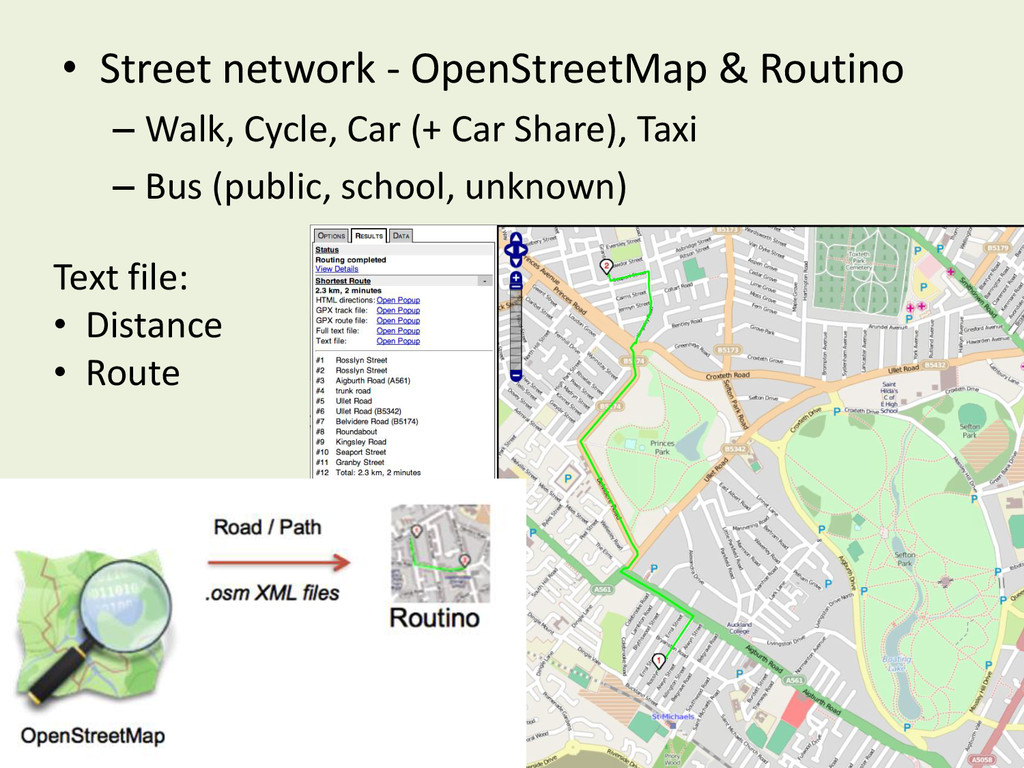
    then called Routino or pgRouting • Process was repeated for each school child • And for each year (2008-2011) – If either Mode, Start postcode or End postcode were different • Processing time ~8.5 days in total
  12. Why these programs? • Routino – Easy way of getting

    street based routes • pgRouting – Routes for custom networks • R - Open Source – can handle big data (o/n running) • OS X & R – good command line interface – stable (?)
  13. Big Data and the Cloud • Run time an issue

    • But confidential data • Cloud solutions complex for permissions • “Where is the data stored?” • Keeping locally is a solution http://www.ft.com/cms/s/0/e2672ccc-349f-11e2-8986- 00144feabdc0.html#axzz2xAmBRk6u
  14. Primary to Secondary mode choice • Big change primary to

    secondary – longer distances – Bus travel – limited average change in mode after this http://pixabay.com/en/boy-girl-hand-in-hand-kids-school- 160168/
  15. Maj. of BUS is DSB Secondary: Walk to 2.75km (1.75m),

    then Bus (+ Car) Primary: Walk to 1.25km (0.75m), then Car (+ Bus) Maj. of NON is WLK Distance
  16. CO2 Emissions • Have routes for all school traffic •

    Can calculate the CO2 impact of school traffic • Can model altering the % of pupils who use active travel
  17. Conclusion • Home to school travel is important • Can

    model individual routes nationally • Large processing can be done locally • Limitations • Future work
  18. Questions ? "Piled Higher and Deeper" by Jorge Cham www.phdcomics.com

    http://phdcomics.com/comics/archive.php?comicid=1692