Upgrade to Pro — share decks privately, control downloads, hide ads and more …

Improve Monitoring and Observability of Kubernetes with OSS tools

Nilesh Gule
January 27, 2022

Improve Monitoring and Observability of Kubernetes with OSS tools

Slide deck from the ASEAN Cloud Summit meetup on 27 January 2022. The session cover the following topics
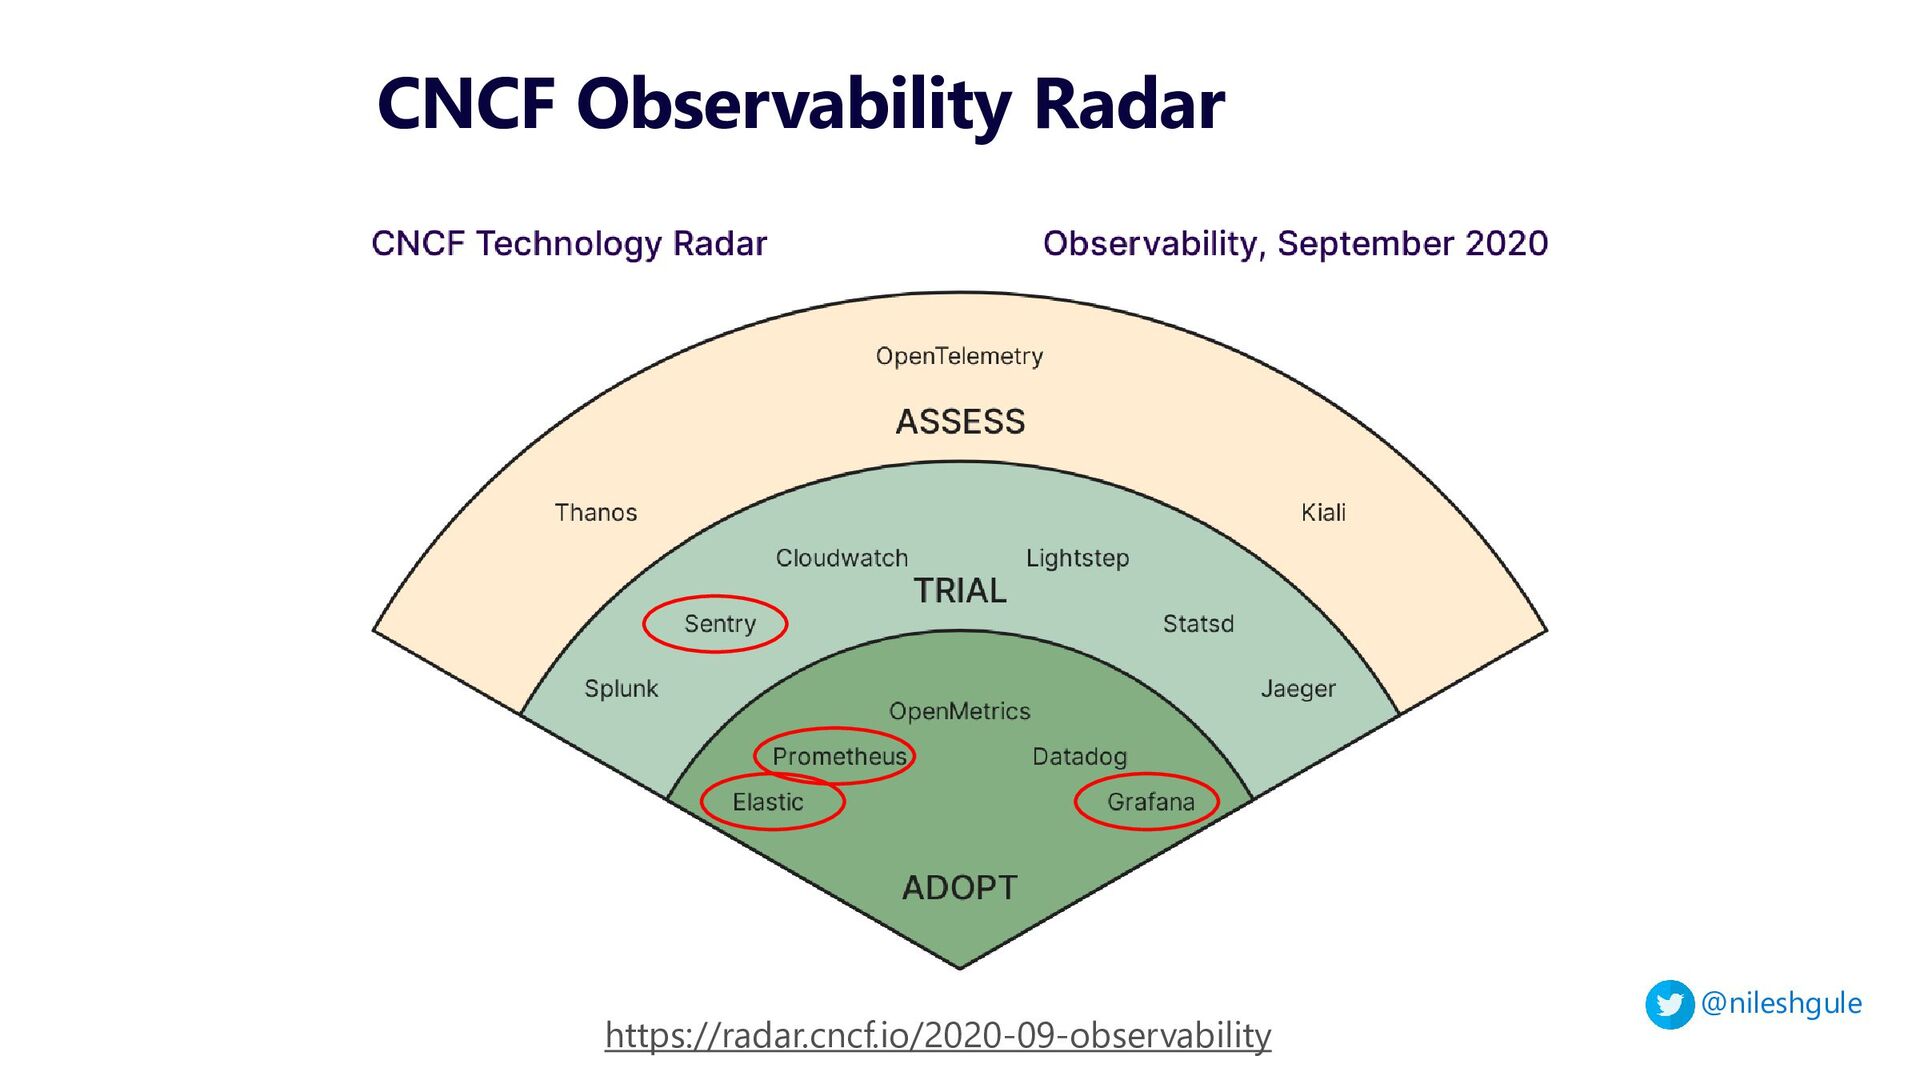
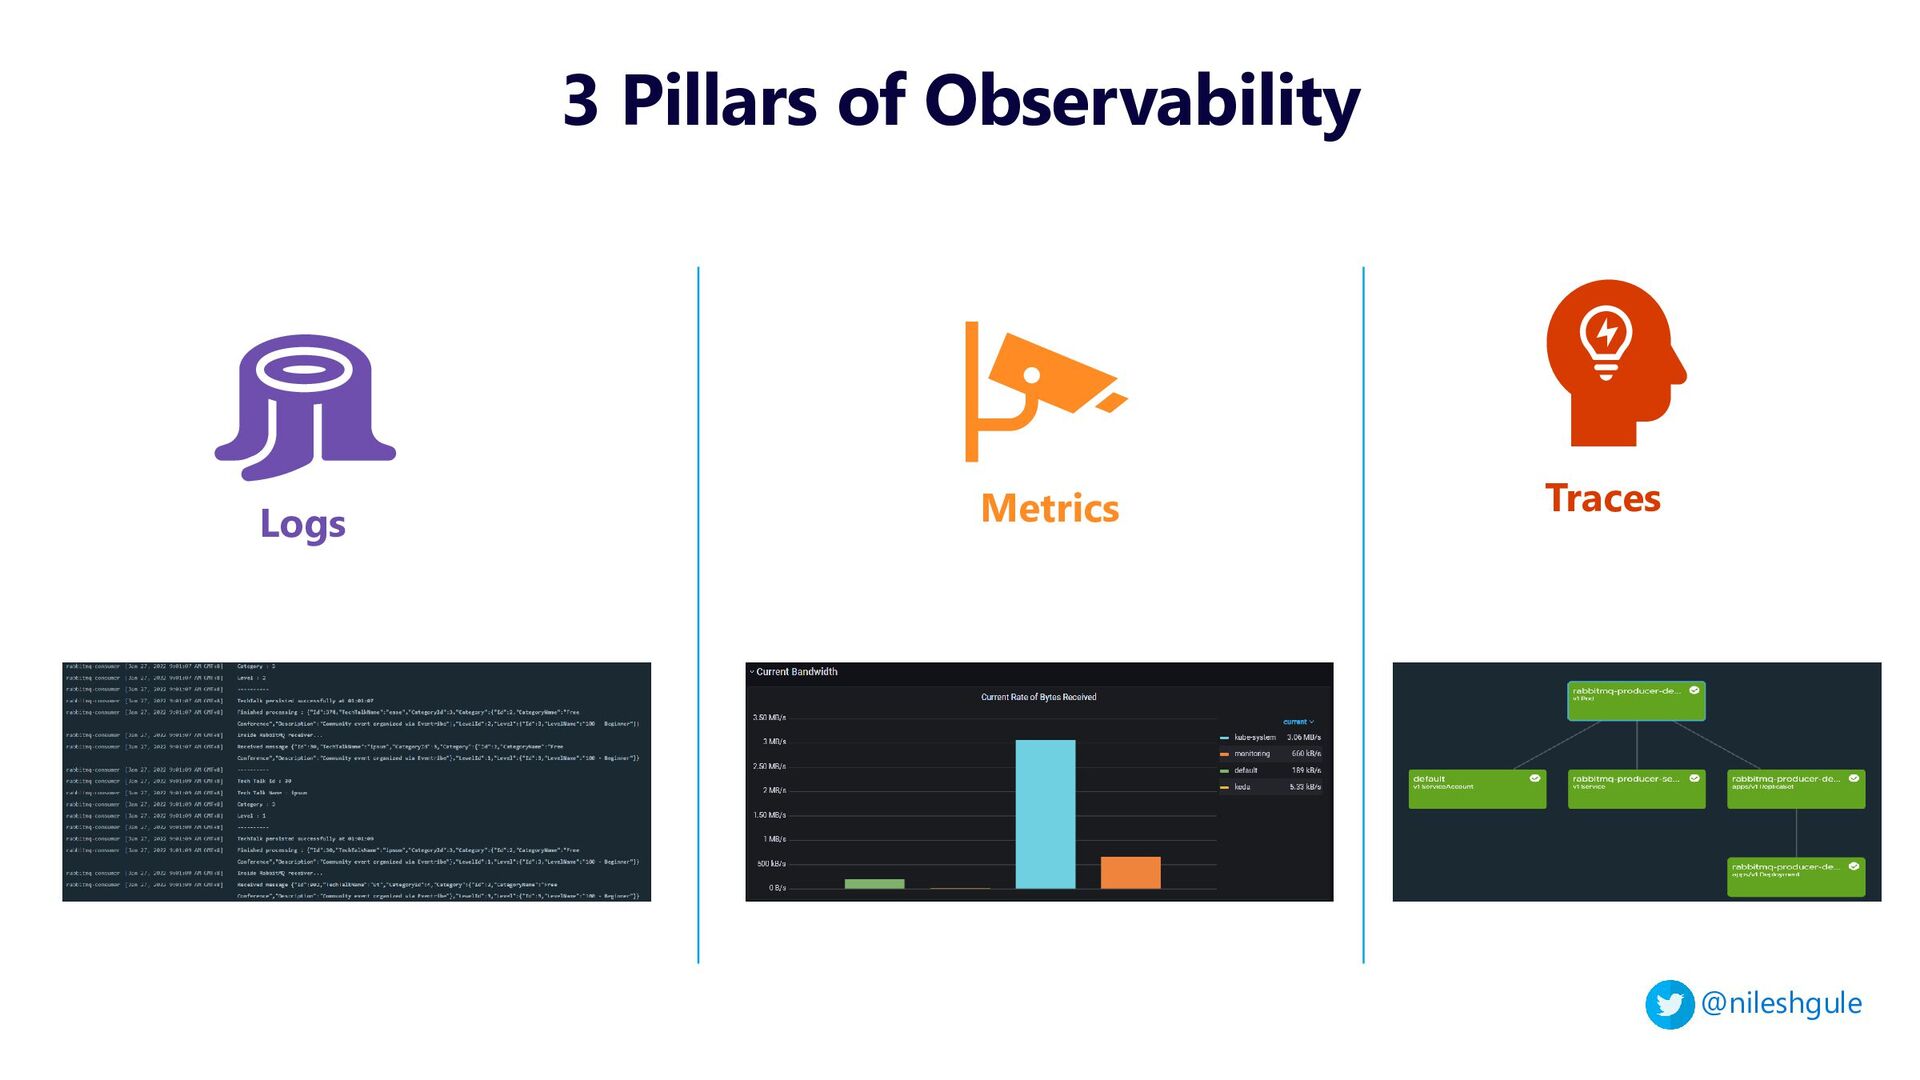
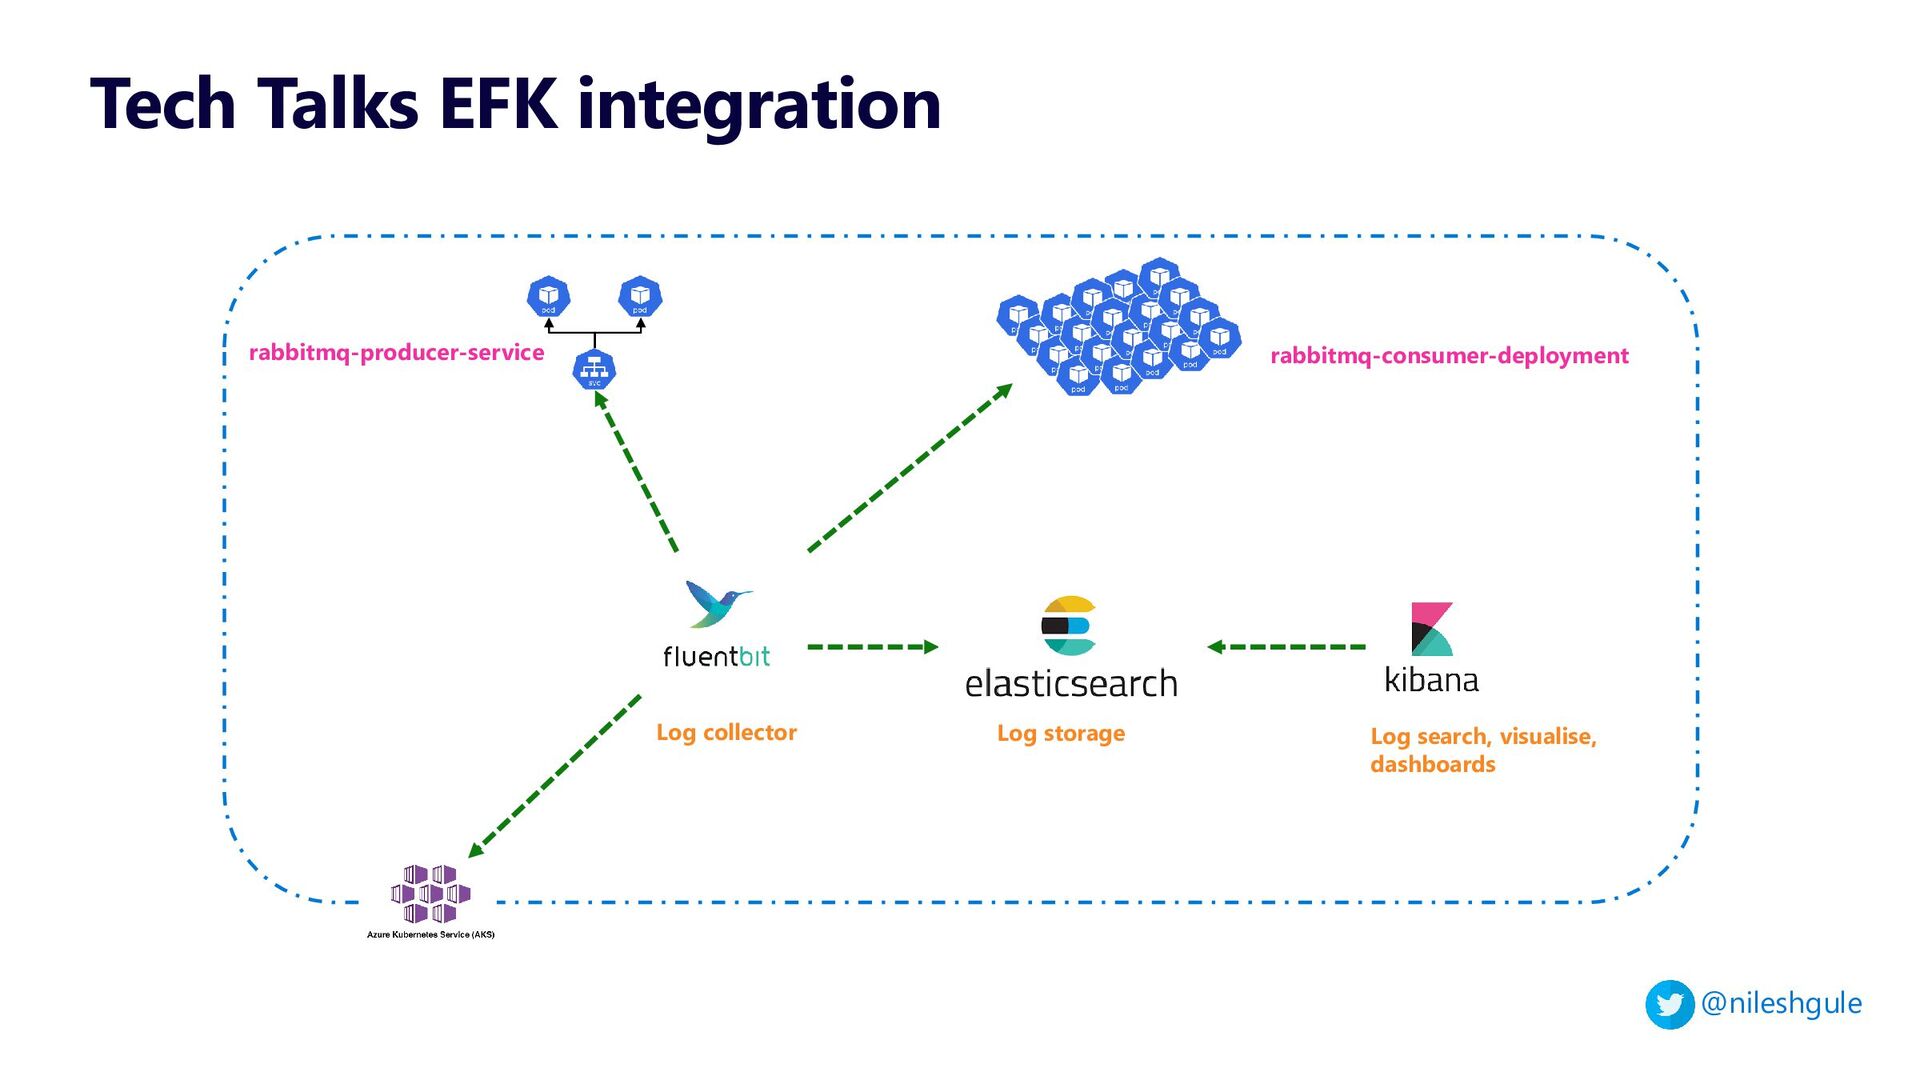
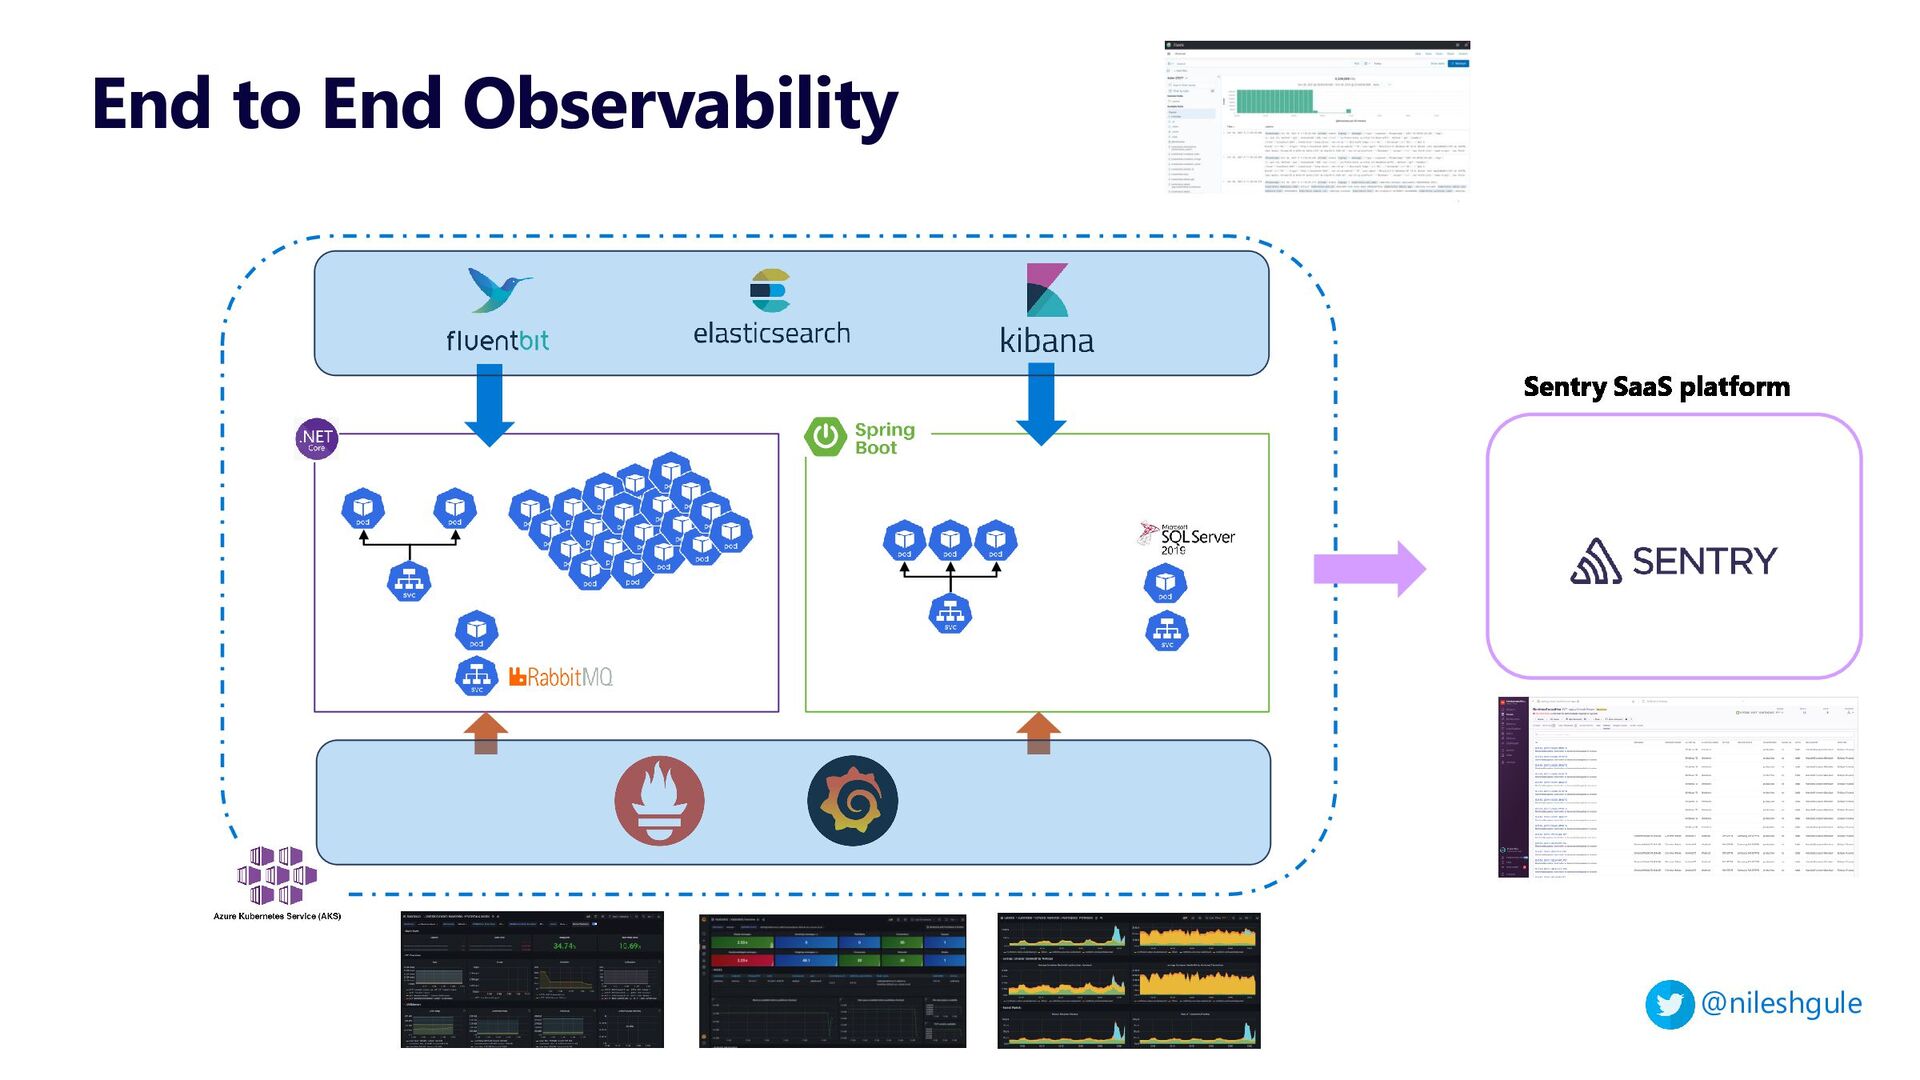
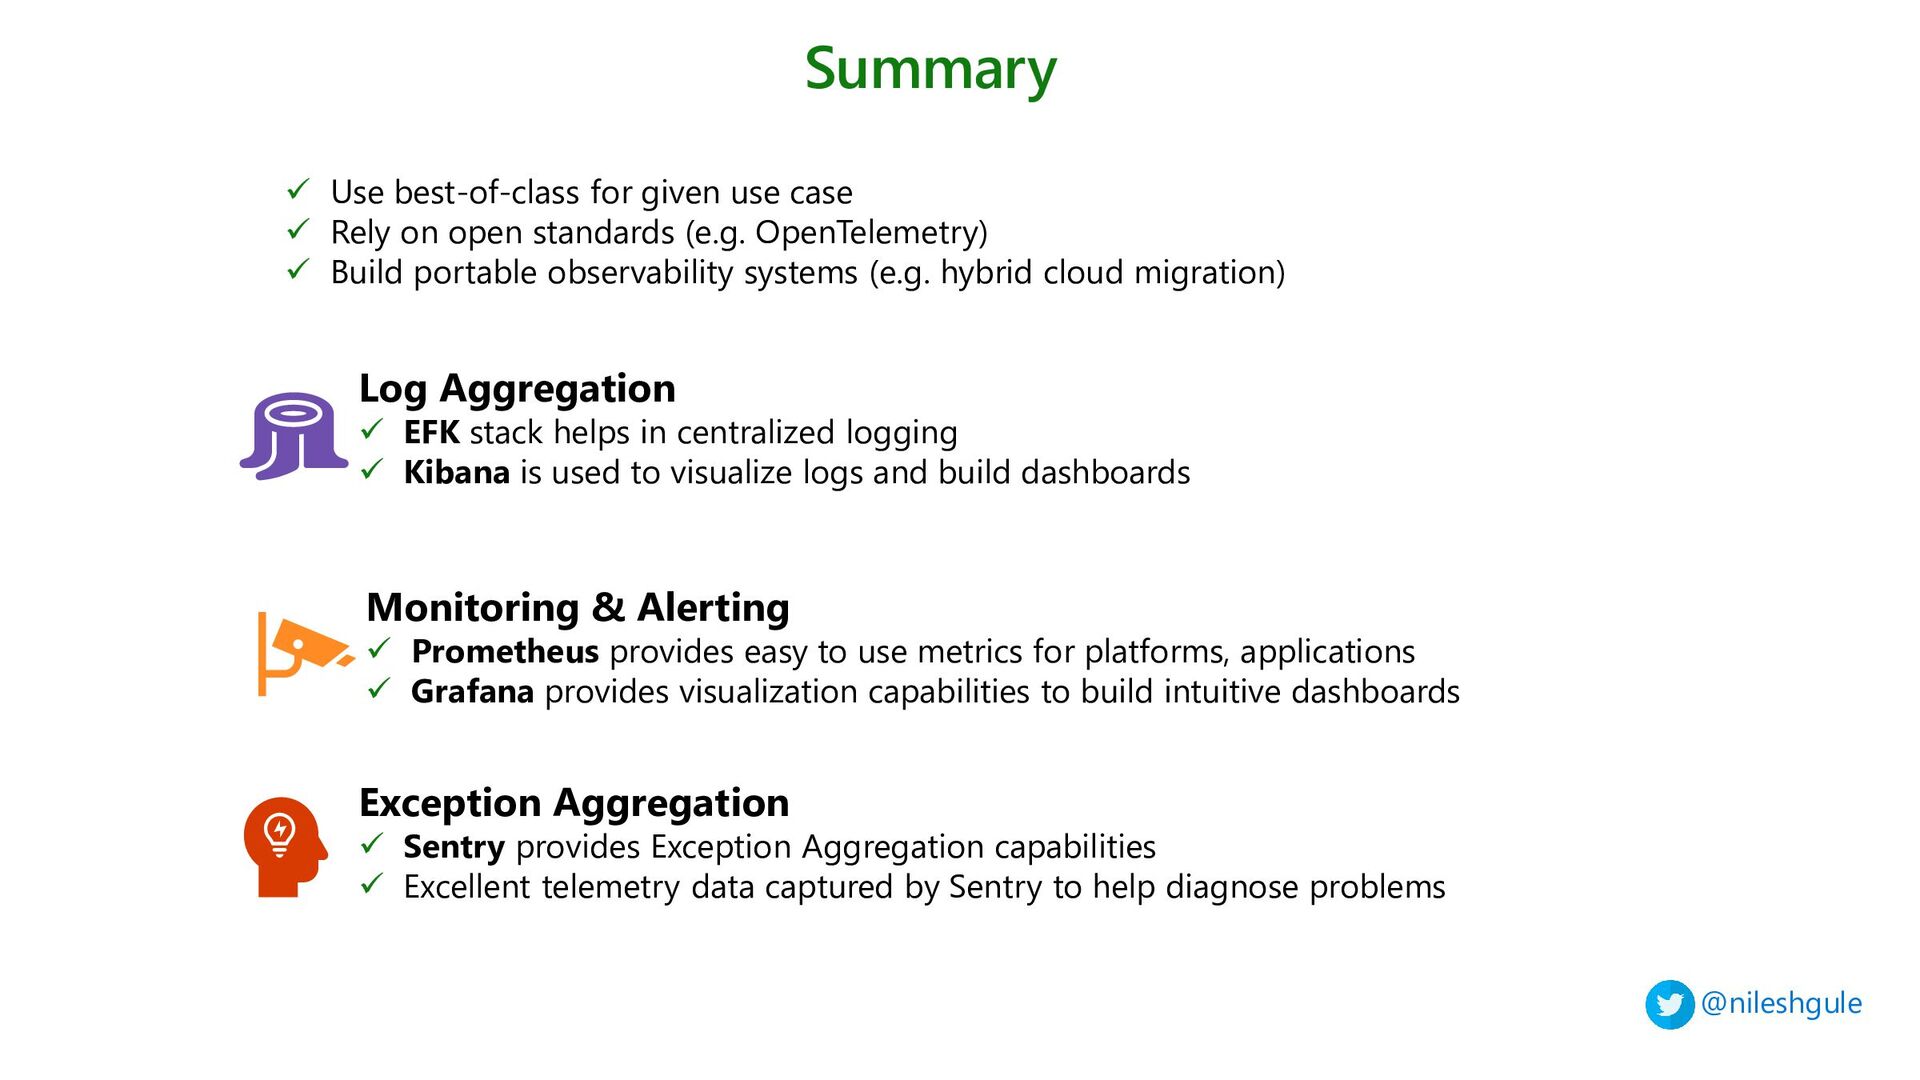
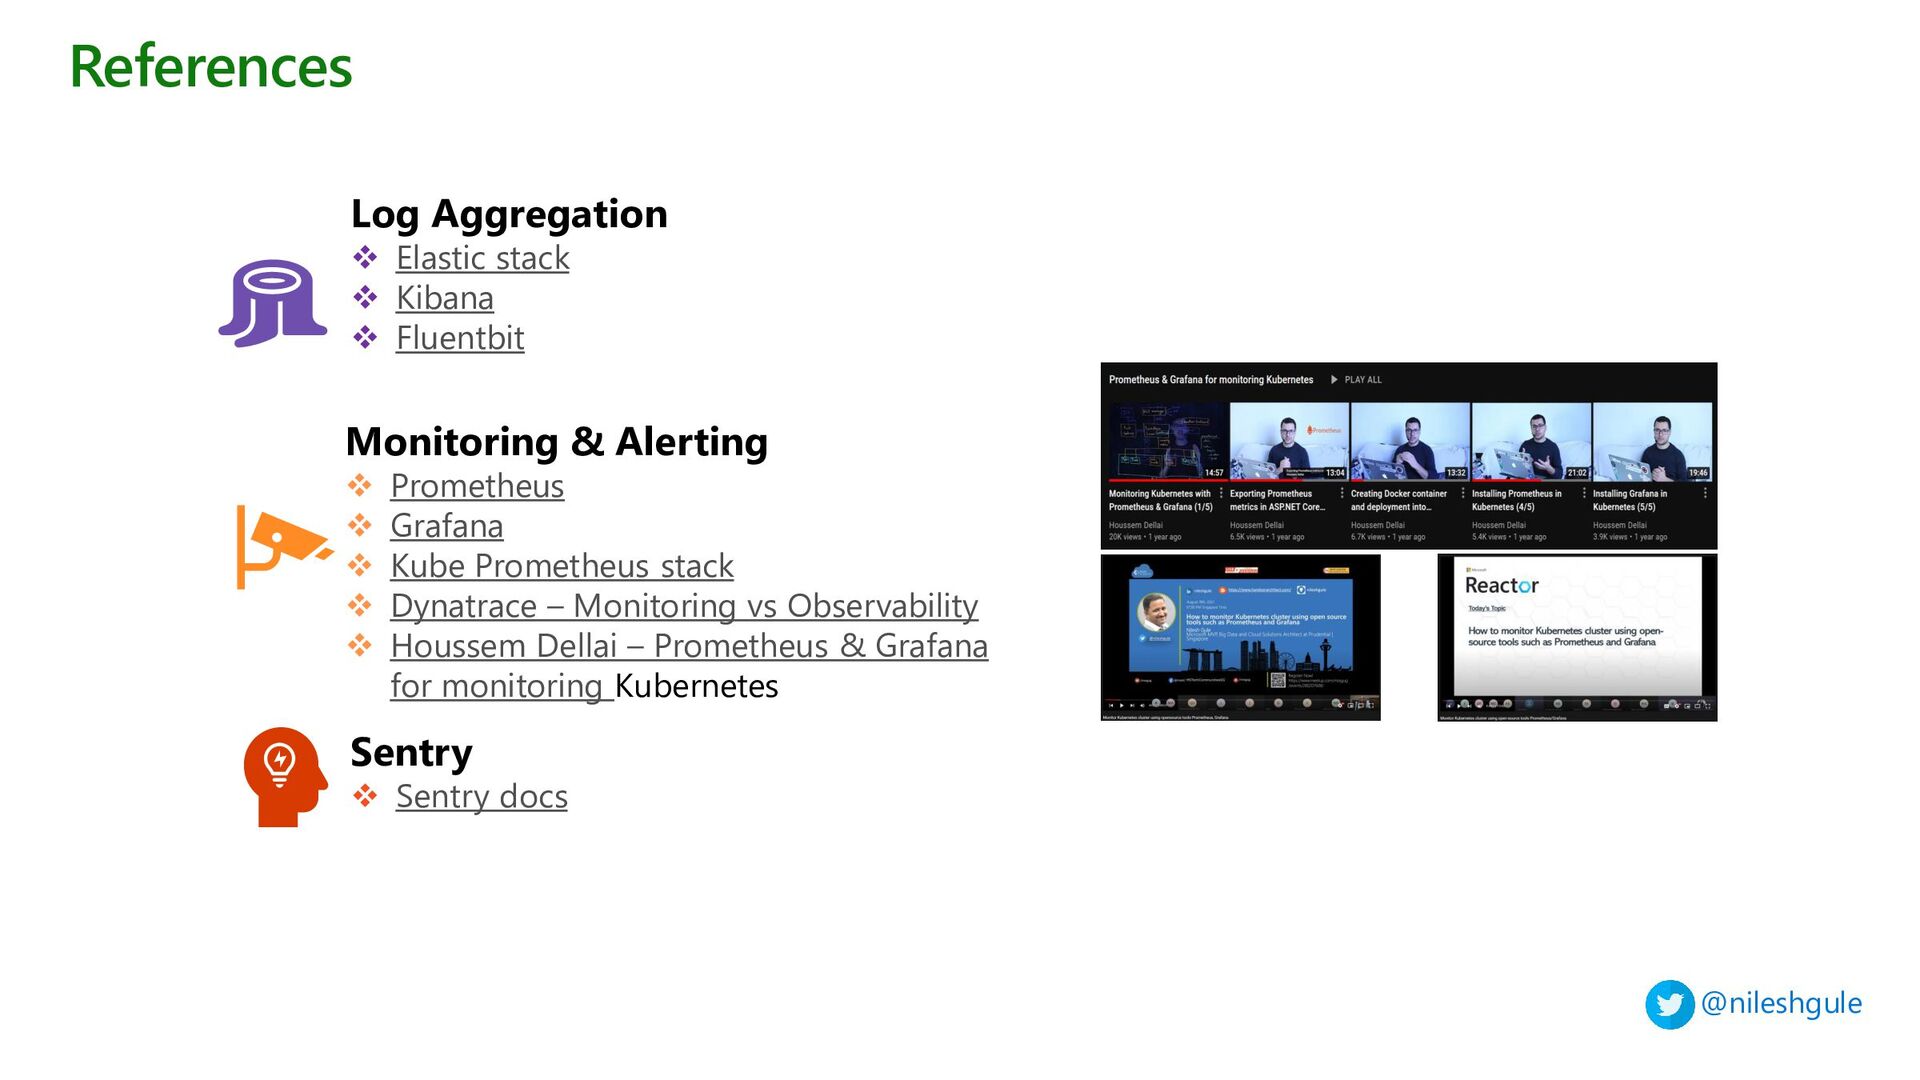
1 - Centralized Loggin with Elasticsearch, Fluentbit and Kibana
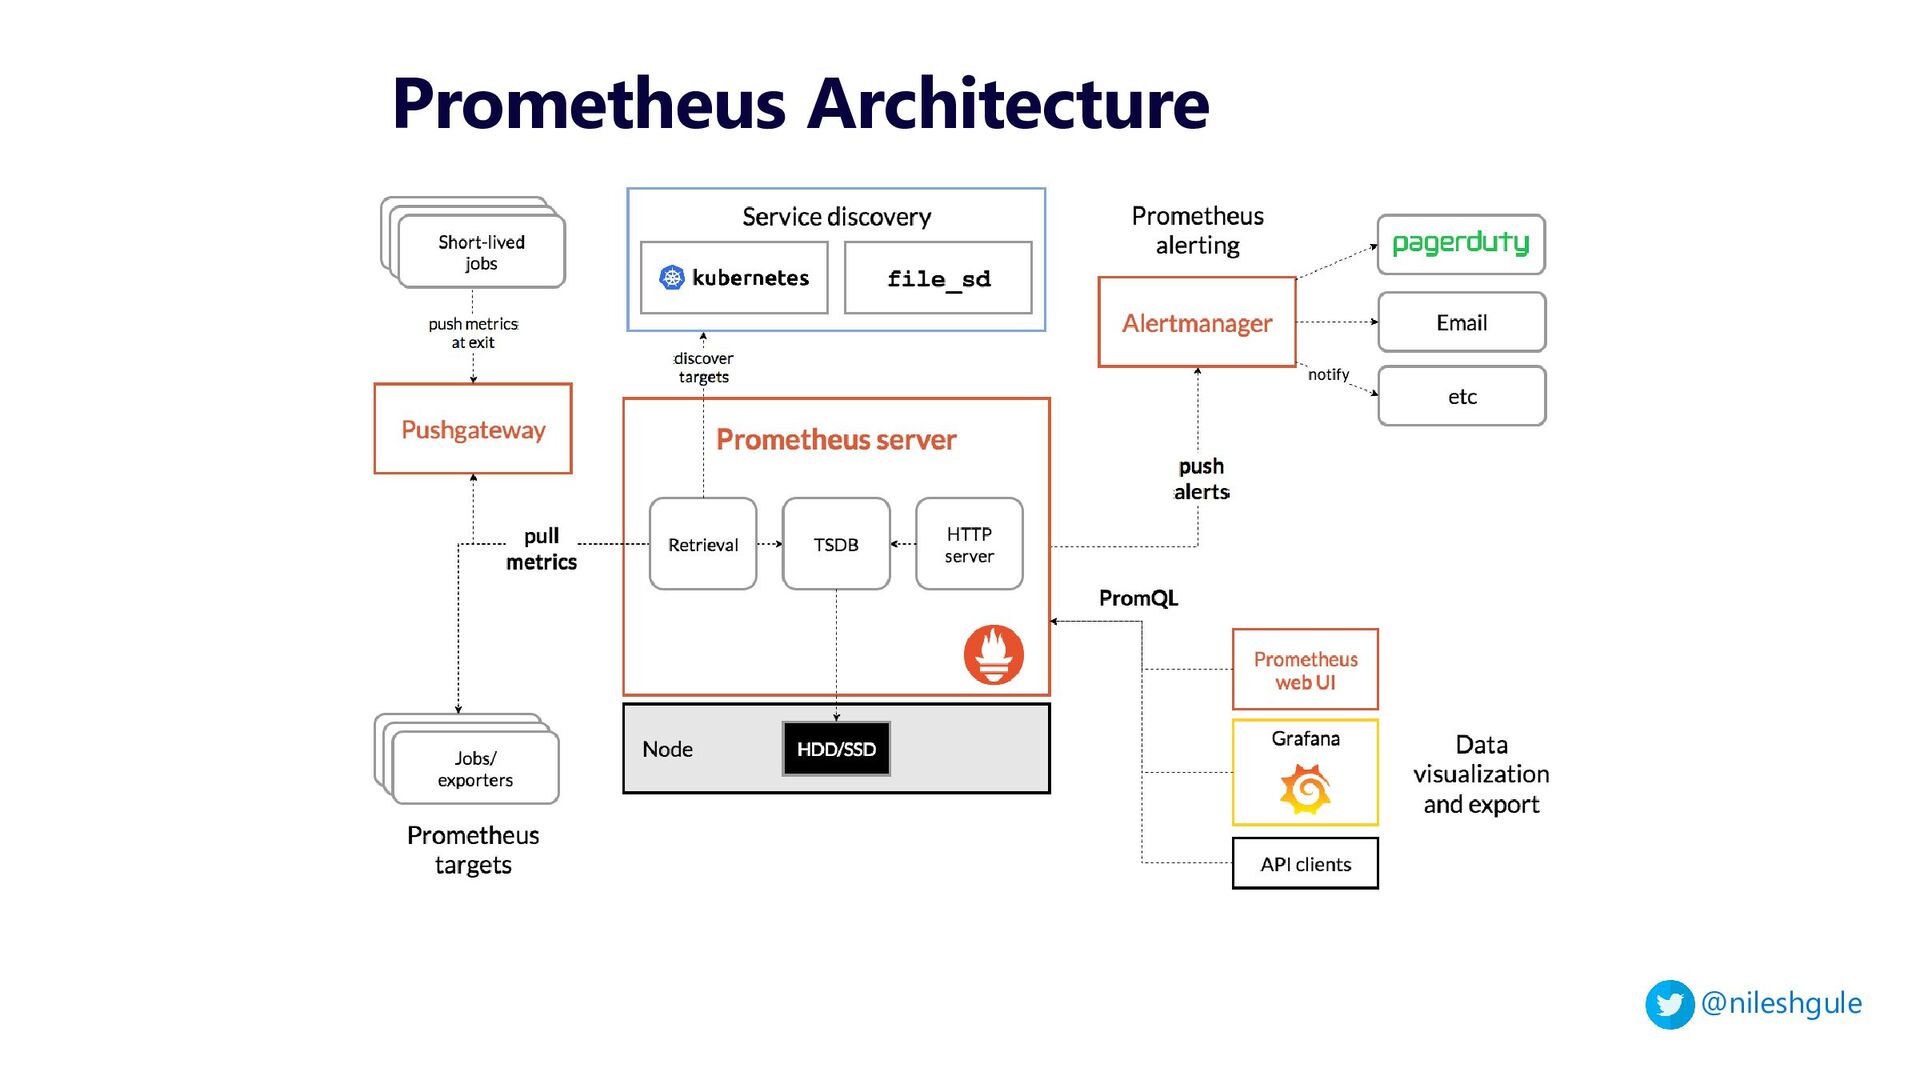
2 - Monitoring and Alerting with Prometheus and Grafana
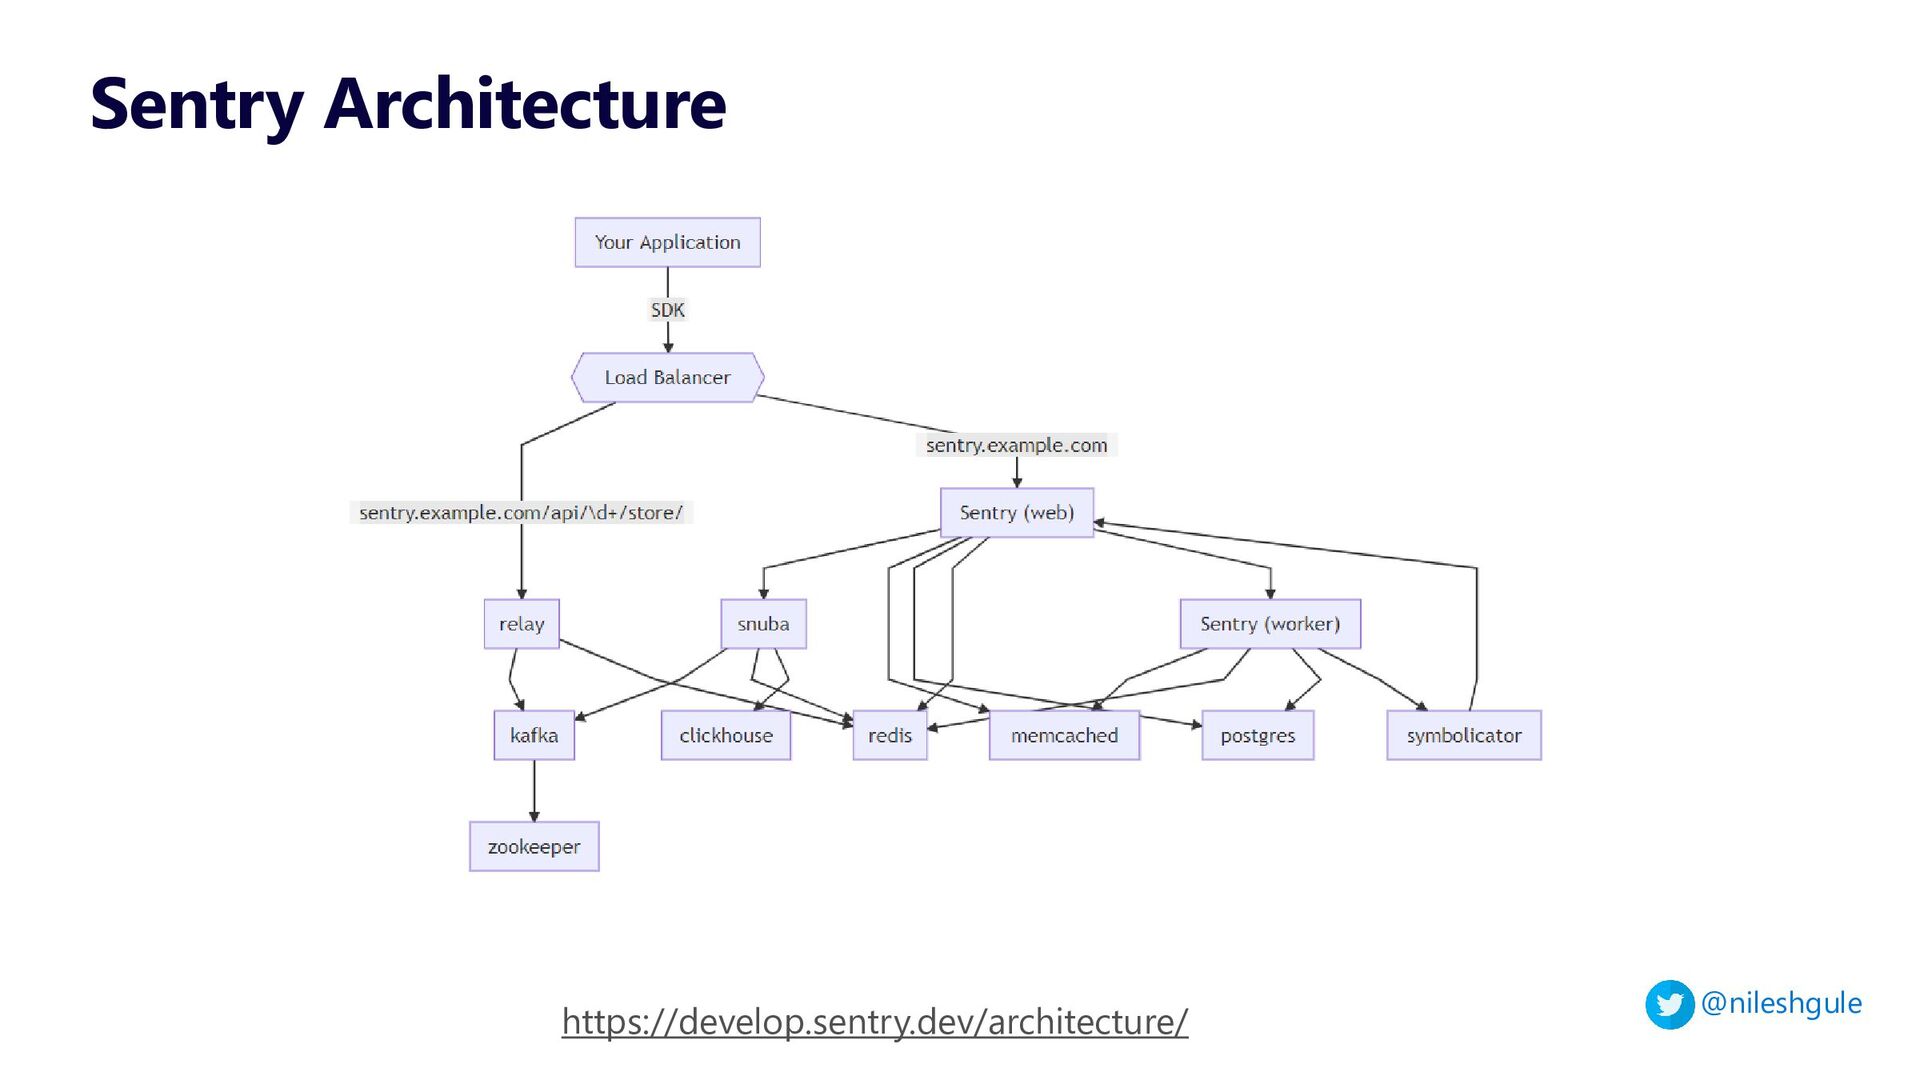
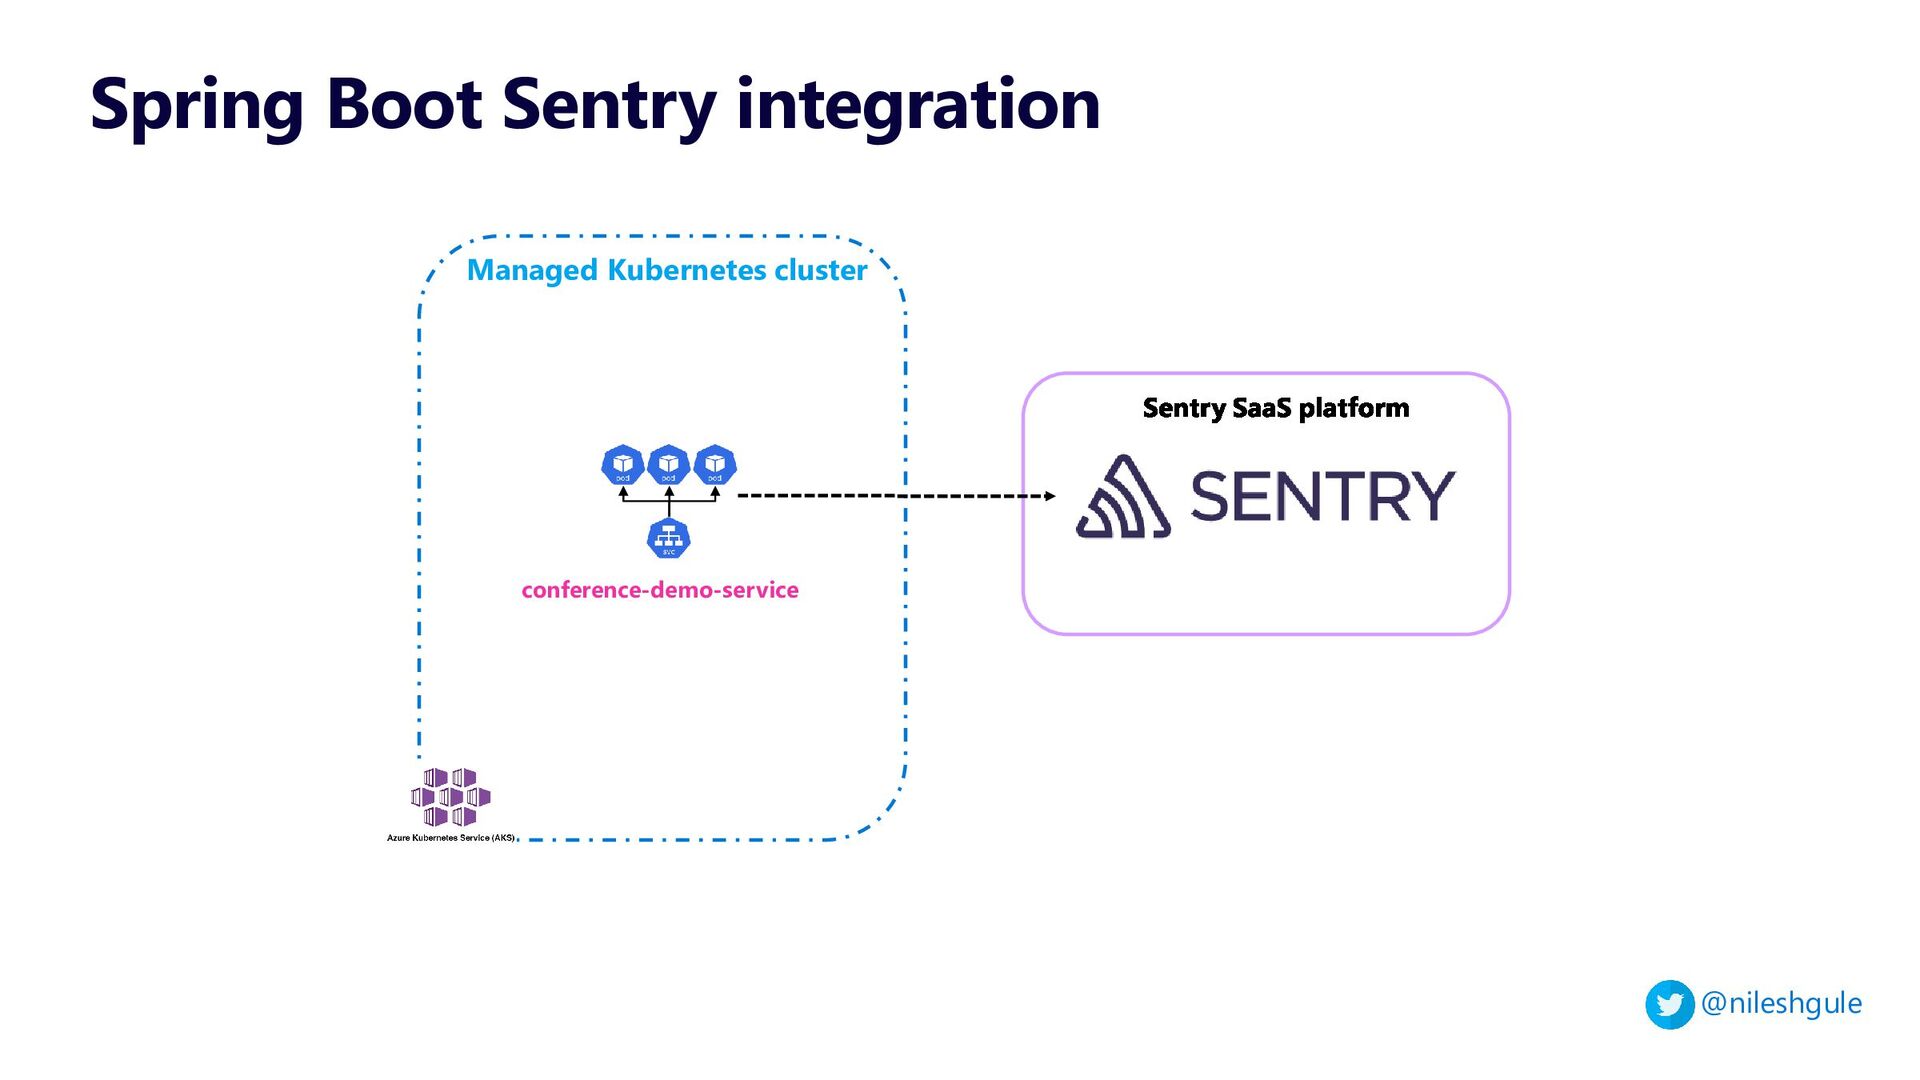
3 - Exception aggregation with Sentry
The live demo showcased these aspects using Azure Kubernetes Service (AKS)
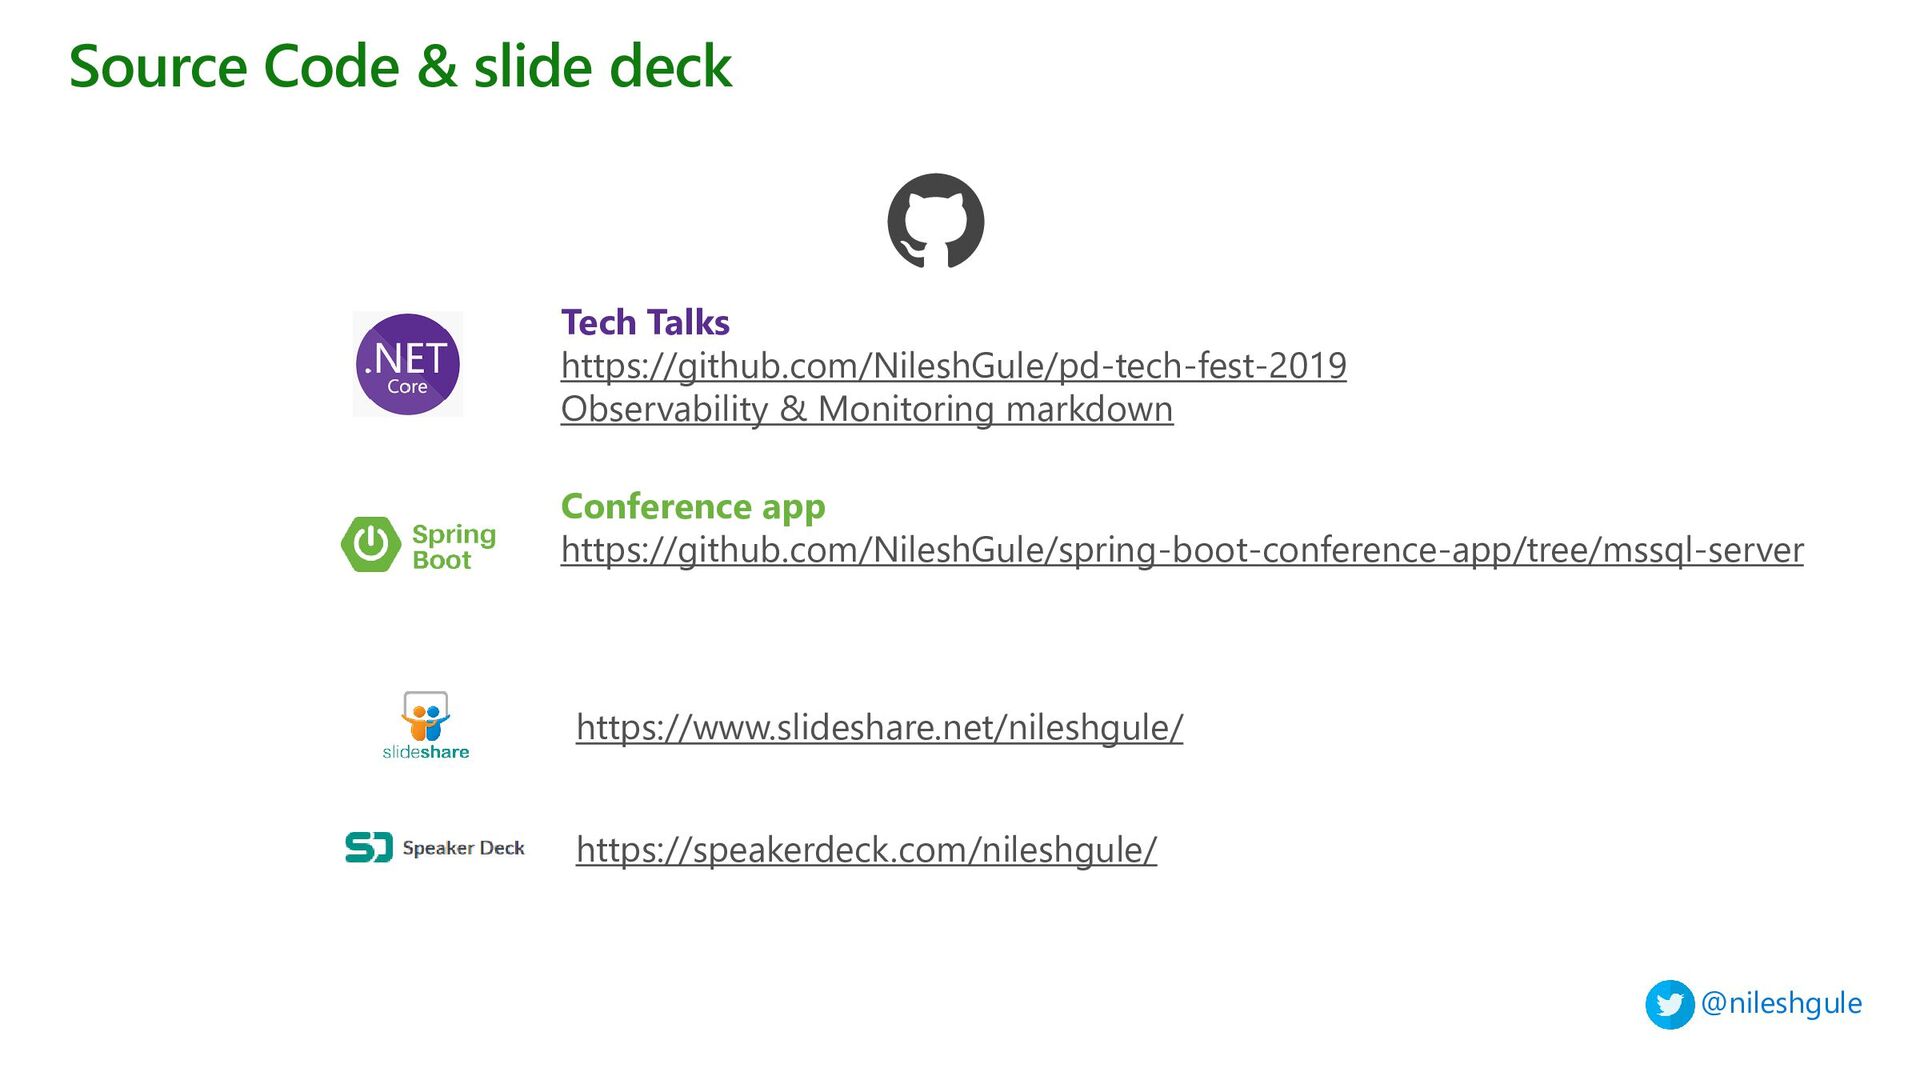
Nilesh Gule

January 27, 2022
Tweet

More Decks by Nilesh Gule

Other Decks in Technology

Transcript

  1. $whoami { “name” : “Nilesh Gule”, “website” : “https://www.HandsOnArchitect.com", “github”

    : “https://GitHub.com/NileshGule" “twitter” : “@nileshgule”, “linkedin” : “https://www.linkedin.com/in/nileshgule”, “likes” : “Technical Evangelism, Cricket”, “co-organizer” : “Azure Singapore UG” }
  2. @nileshgule Pre-requisites Self contained application with all its dependencies Docker

    ❖ Orchestrates containers ❖ Self healing ❖ Service discovery ❖ Scaling Kubernetes ❖ Scalable apps in dynamic environments (public / private / hybrid clouds) ❖ Exemplified by Containers, service meshes, microservices, immutable infrastructure & declarative APIs ❖ Loosely coupled systems, resilient, observable & manageable ❖ Robust automation Cloud Native Applications
  3. @nileshgule ❑ Application specific ❖ Long term log retention for

    compliance reasons ❖ Workloads scheduled on different nodes during application restarts / updates ❖ Autoscaling workloads ❑ Kubernetes upgrades ❖ Auto healing can reschedule workloads ❖ Underlying nodes added / deleted during cluster scaling ❖ Underlying nodes replaced during cluster upgrades Container based workloads Why centralized logging ❖ Not much control over underlying infra ❖ Relies on cloud prover specific logging and monitoring solution PaaS / Serverless services
  4. @nileshgule Tech Talks EFK integration Log collector Log storage Log

    search, visualise, dashboards rabbitmq-producer-service rabbitmq-consumer-deployment
  5. @nileshgule • Application specific • Monitor resource usage • Monitor

    scaling needs • Monitor anomalies / outliers • Kubernetes platform level • Monitor cluster resources (CPU / RAM) • API health • Autoscaling Container based workloads Why Monitoring & Alerting • Monitor resource usage • Scaling • Bottlenecks PaaS / Serverless services
  6. @nileshgule Observability challenges ➢ Too many telemetry agents ➢ Instrumentation

    of Apps ➢ Dynamic & small units in Cloud Native Applications ➢ Right retention period for each type of metric and usage ➢ Minimize vendor or feature lock-in ➢ Buy vs Build ➢ Transition from Monitoring to Observability ➢ Single pane of glass for consuming different information ➢ Correlation of signals
  7. @nileshgule Summary ✓ Use best-of-class for given use case ✓

    Rely on open standards (e.g. OpenTelemetry) ✓ Build portable observability systems (e.g. hybrid cloud migration) Log Aggregation ✓ EFK stack helps in centralized logging ✓ Kibana is used to visualize logs and build dashboards Monitoring & Alerting ✓ Prometheus provides easy to use metrics for platforms, applications ✓ Grafana provides visualization capabilities to build intuitive dashboards Exception Aggregation ✓ Sentry provides Exception Aggregation capabilities ✓ Excellent telemetry data captured by Sentry to help diagnose problems
  8. @nileshgule Some Recommendations ♣ Too many agents ♣ Instrumentation, vendor

    lock-in ♣ Cloud native logs ♣ Cloud native metrics ♣ Cloud native traces ♣ Single pane of glass, correlation ∞ OpenTelemetry collector ∞ OpenTelemetry, OpenMetrics ∞ Fluent Bit / Fluentd, OpenSearch, Loki ∞ Prometheus, Cortex, Thanos ∞ OpenTelemetry, Jaeger, Grafana ∞ Grafana Challenges Tools
  9. @nileshgule References Log Aggregation ❖ Elastic stack ❖ Kibana ❖

    Fluentbit Monitoring & Alerting ❖ Prometheus ❖ Grafana ❖ Kube Prometheus stack ❖ Dynatrace – Monitoring vs Observability ❖ Houssem Dellai – Prometheus & Grafana for monitoring Kubernetes Sentry ❖ Sentry docs
  10. @nileshgule Source Code & slide deck Tech Talks https://github.com/NileshGule/pd-tech-fest-2019 Observability

    & Monitoring markdown Conference app https://github.com/NileshGule/spring-boot-conference-app/tree/mssql-server https://speakerdeck.com/nileshgule/ https://www.slideshare.net/nileshgule/
  11. Nilesh Gule ARCHITECT | MICROSOFT MVP “Code with Passion and

    Strive for Excellence” nileshgule @nileshgule Nilesh Gule NileshGule www.handsonarchitect.com https://bit.ly/youtube-nileshgule
  12. Q&A