Upgrade to Pro — share decks privately, control downloads, hide ads and more …

Analytics in the age of the Internet of Things

Analytics in the age of the Internet of Things

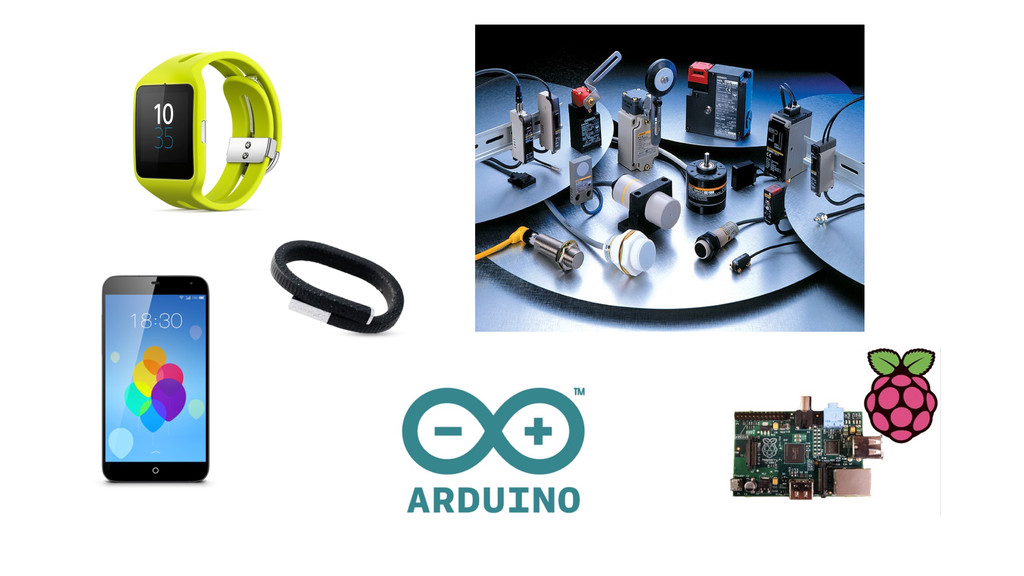
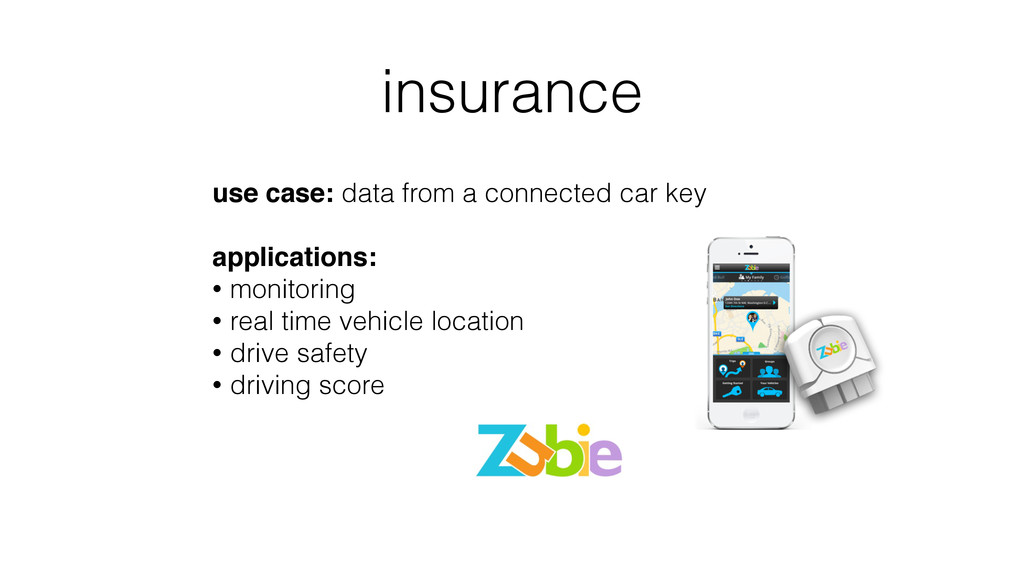
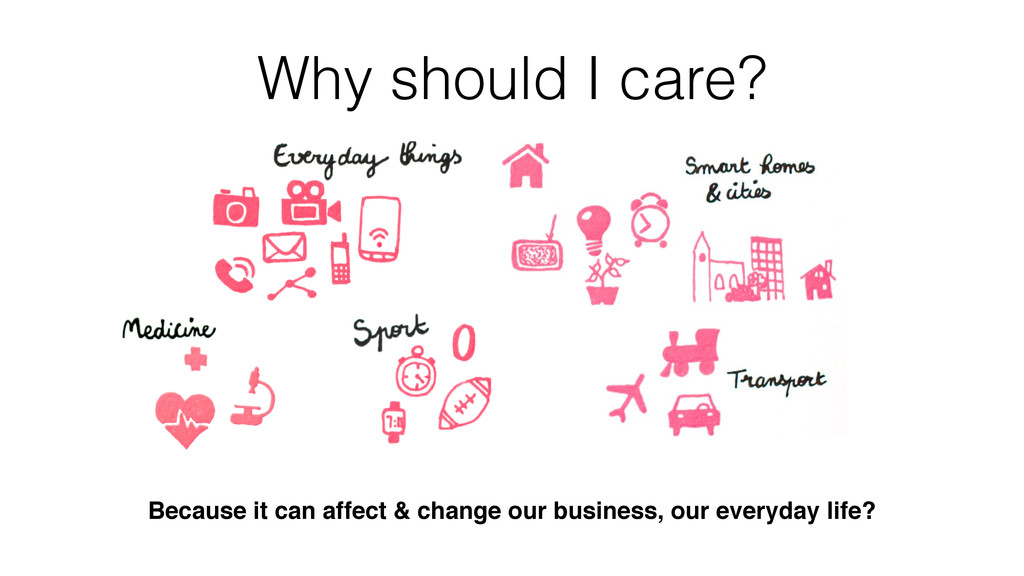
The presentation starts by introduce the concepts of IoT illustrated of some examples.
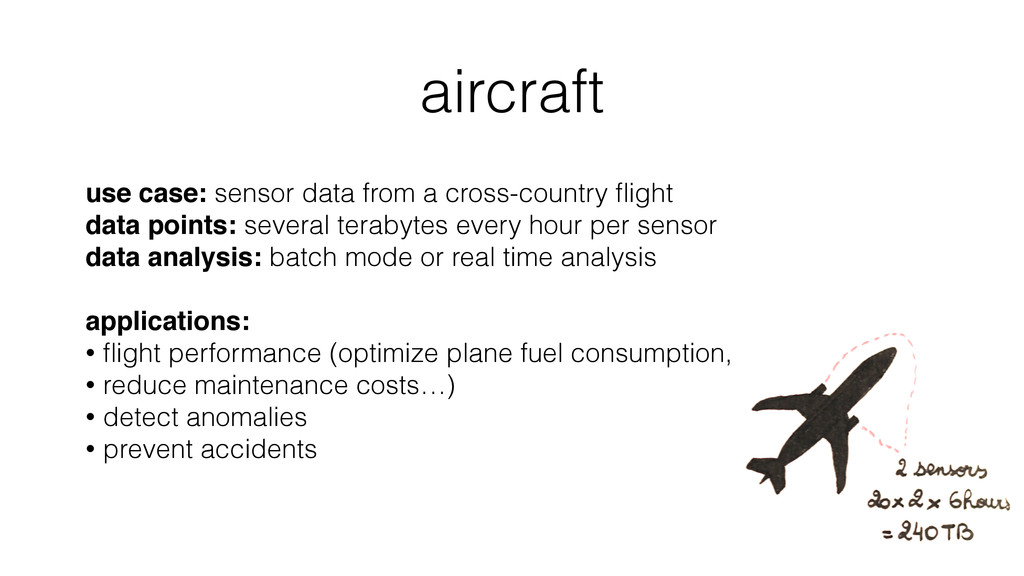
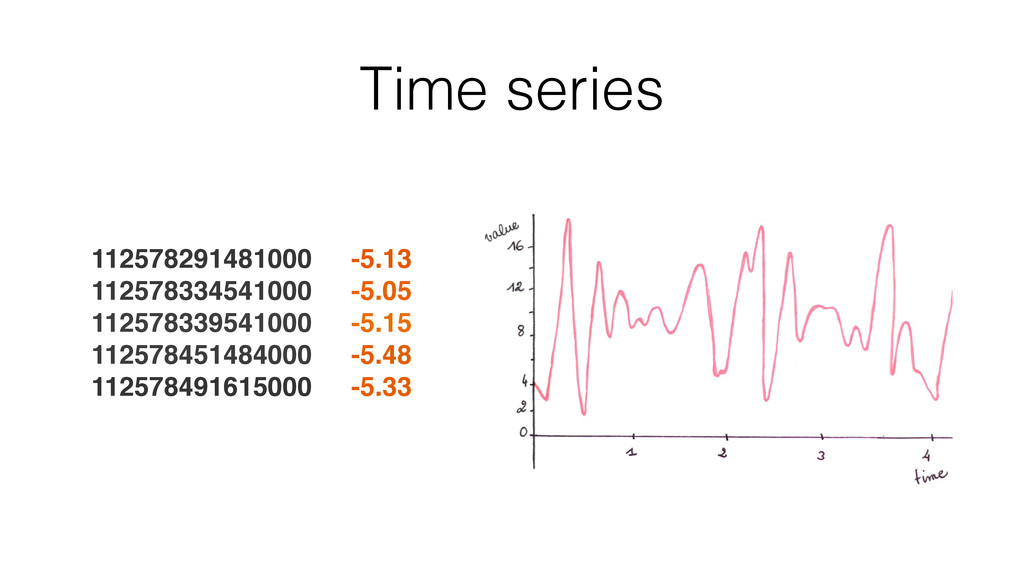
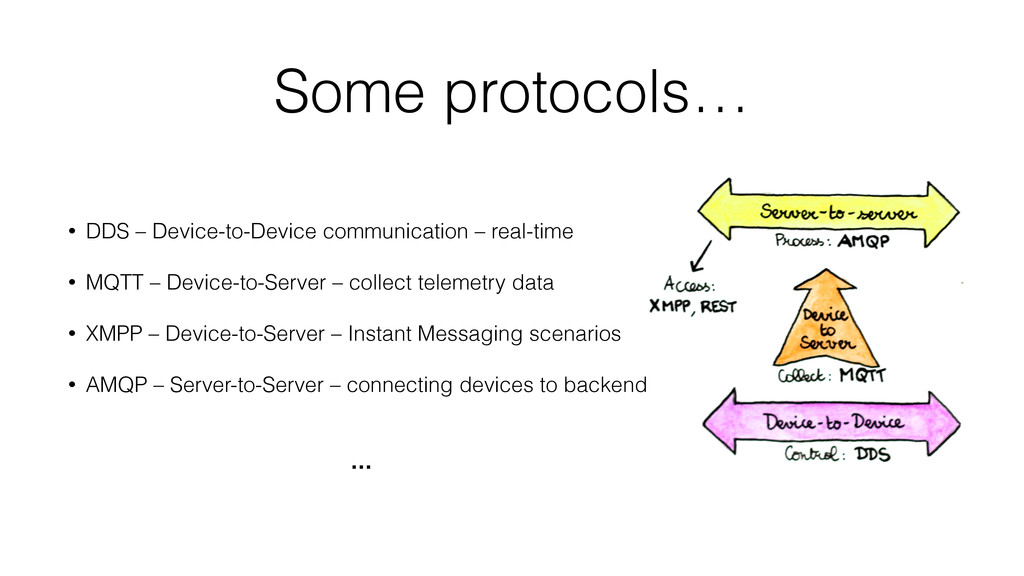
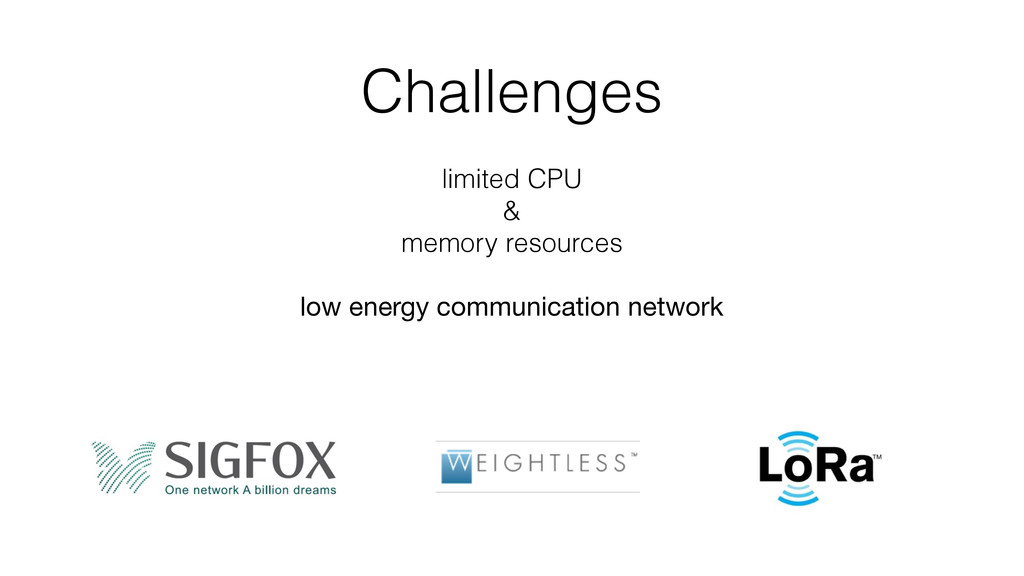
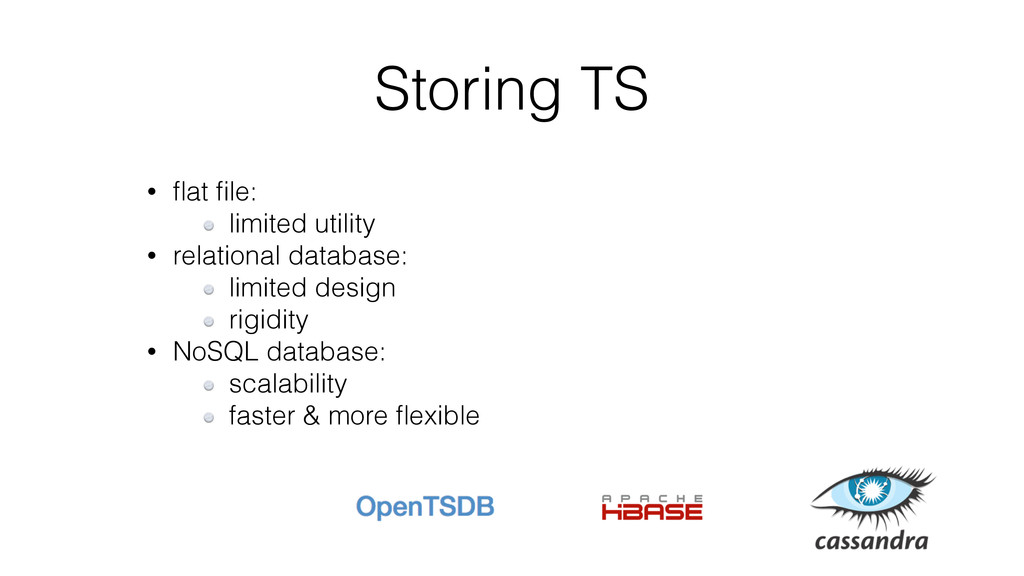
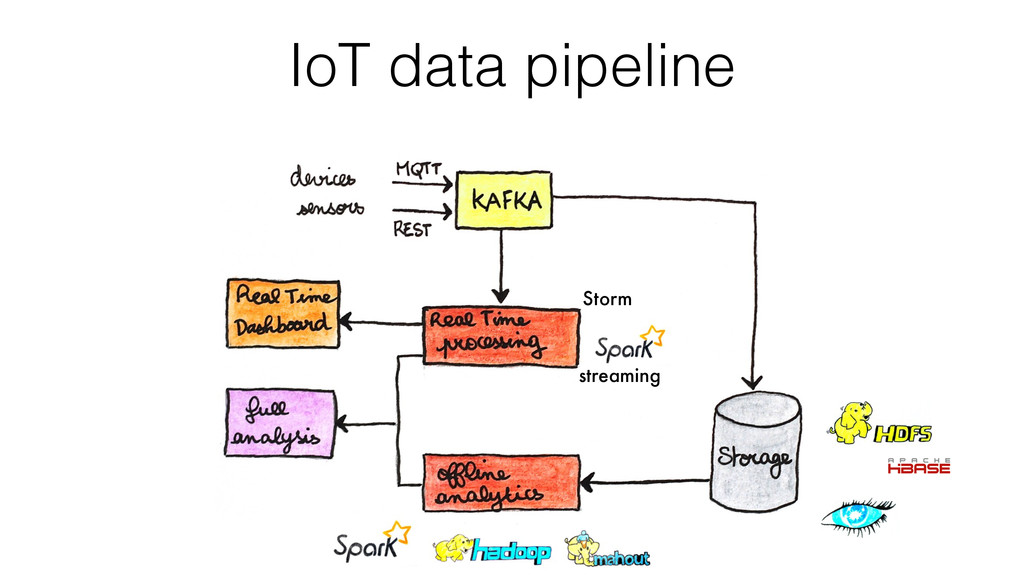
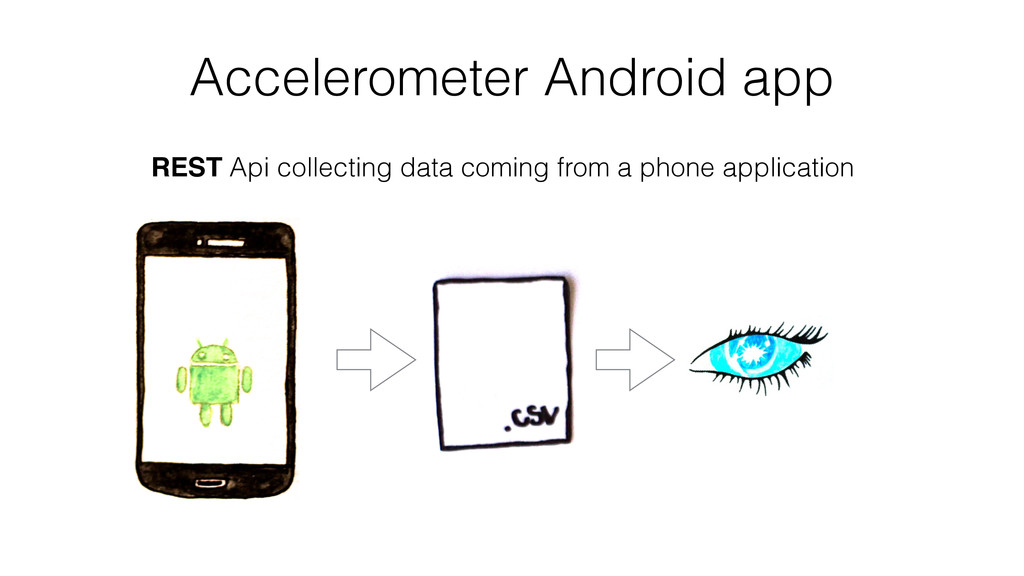
Following this we quickly see how to collect and store the data from connected devices.
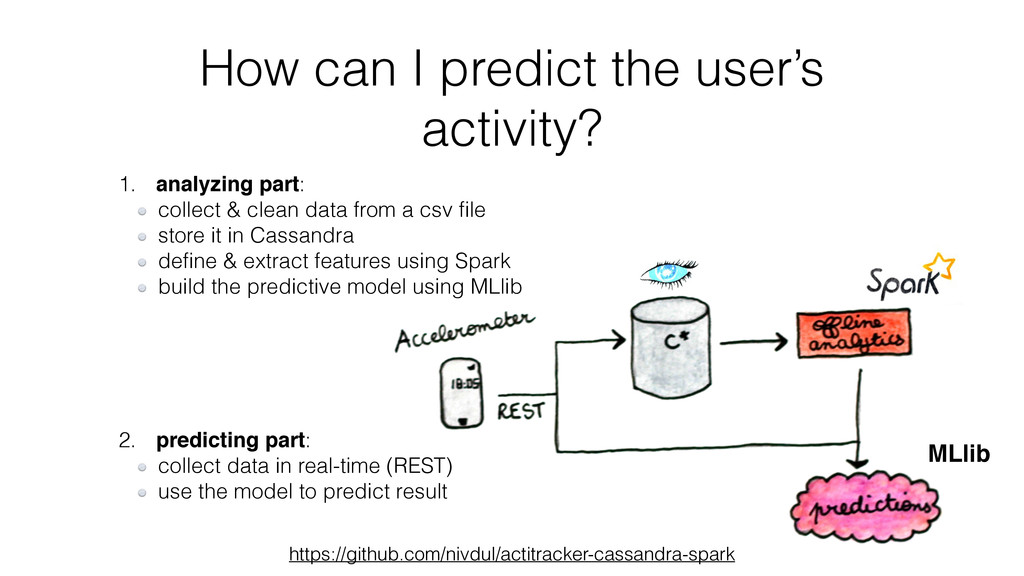
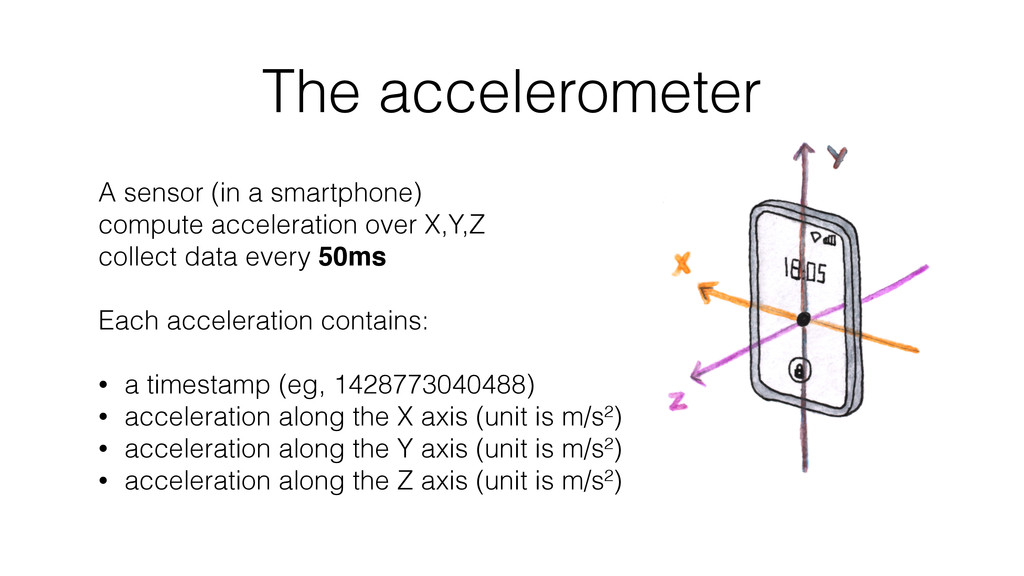
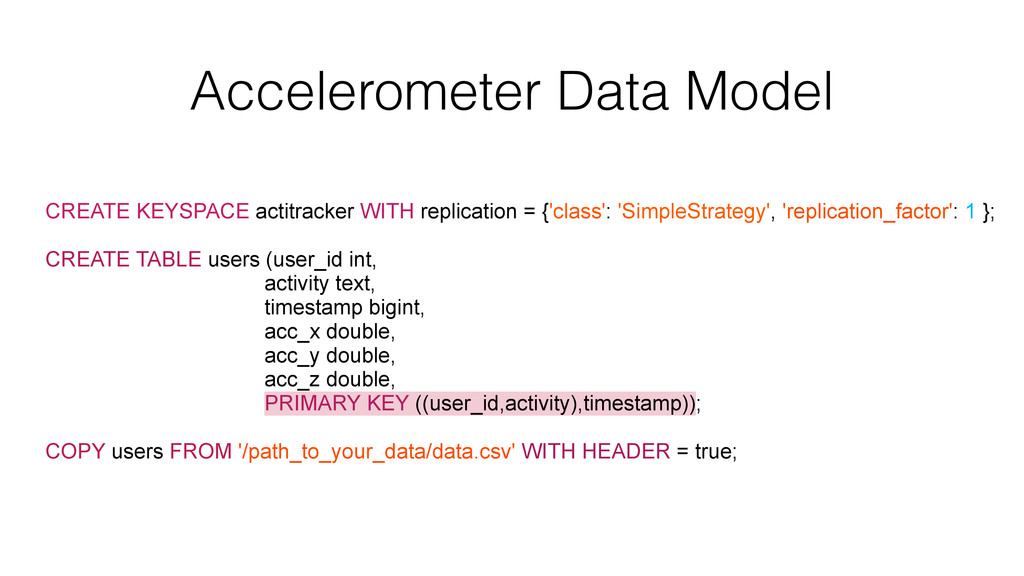
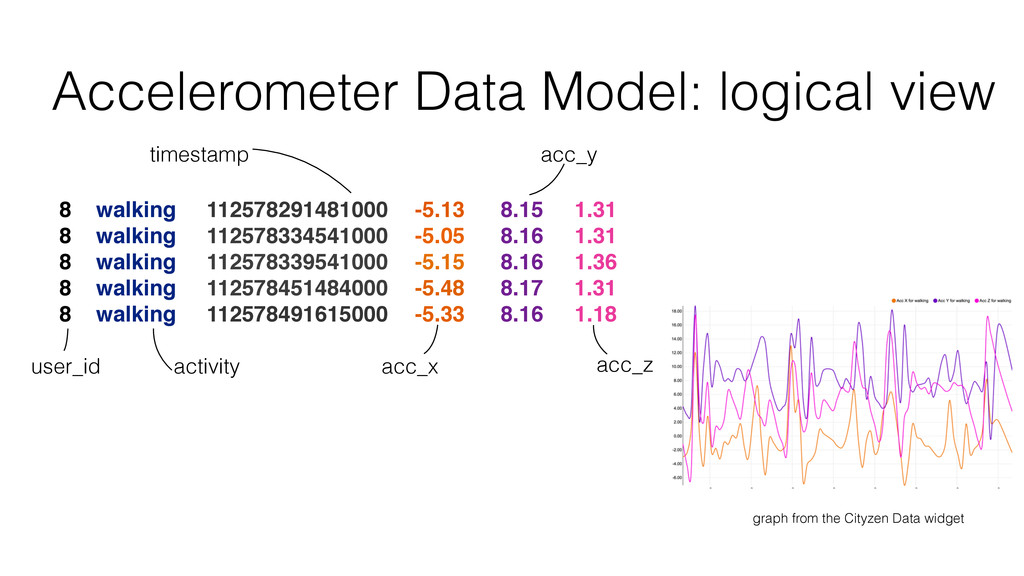
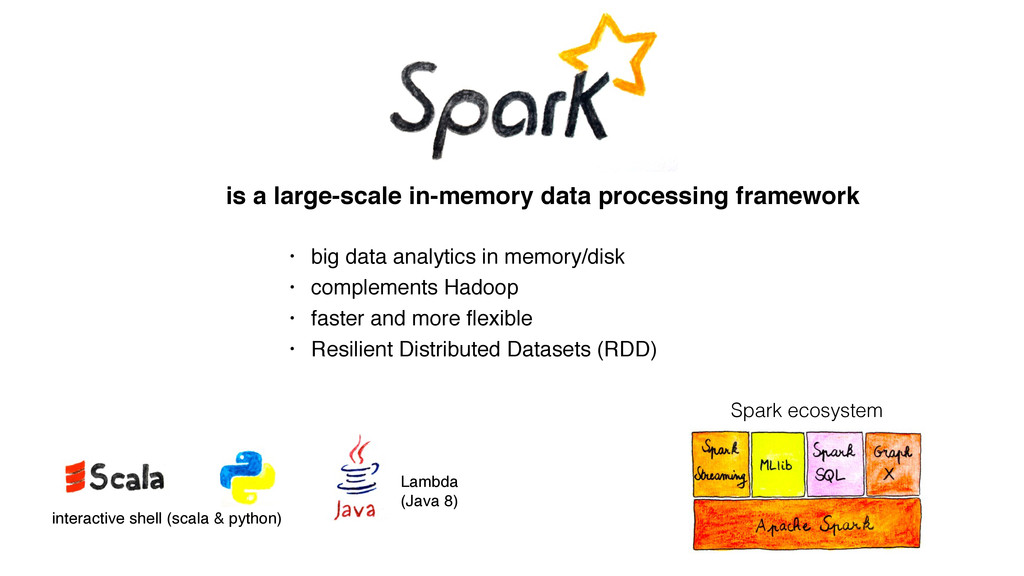
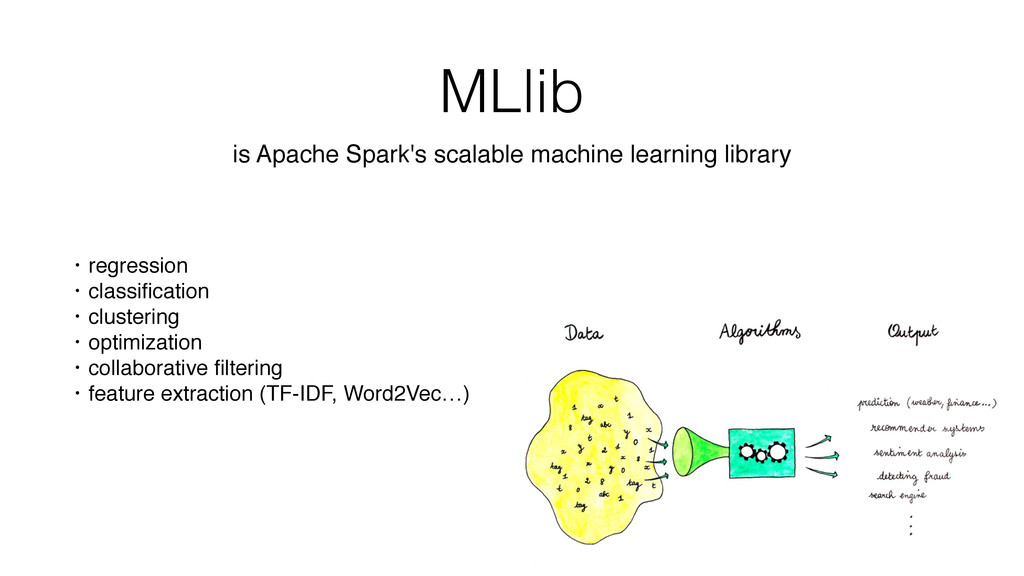
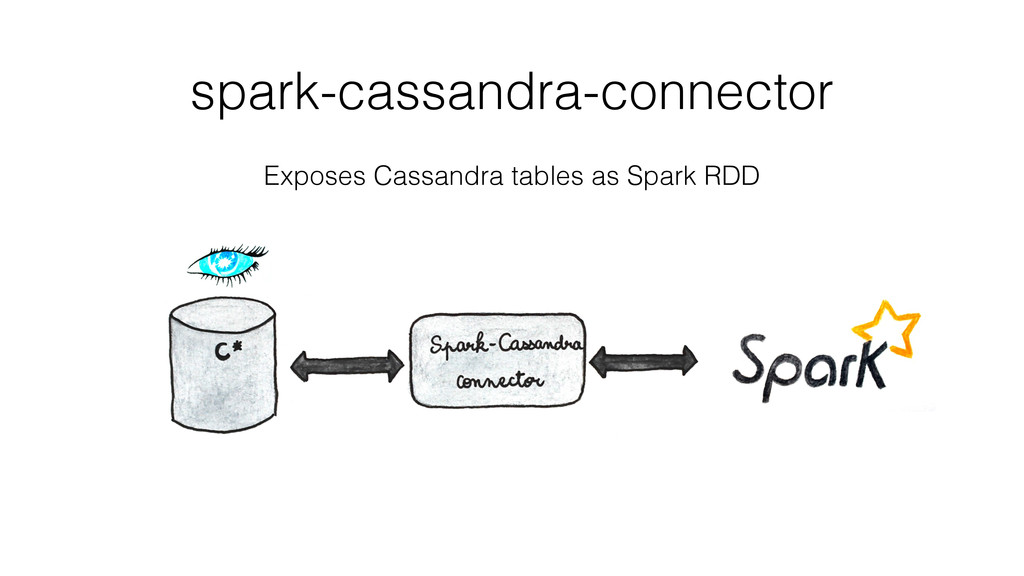
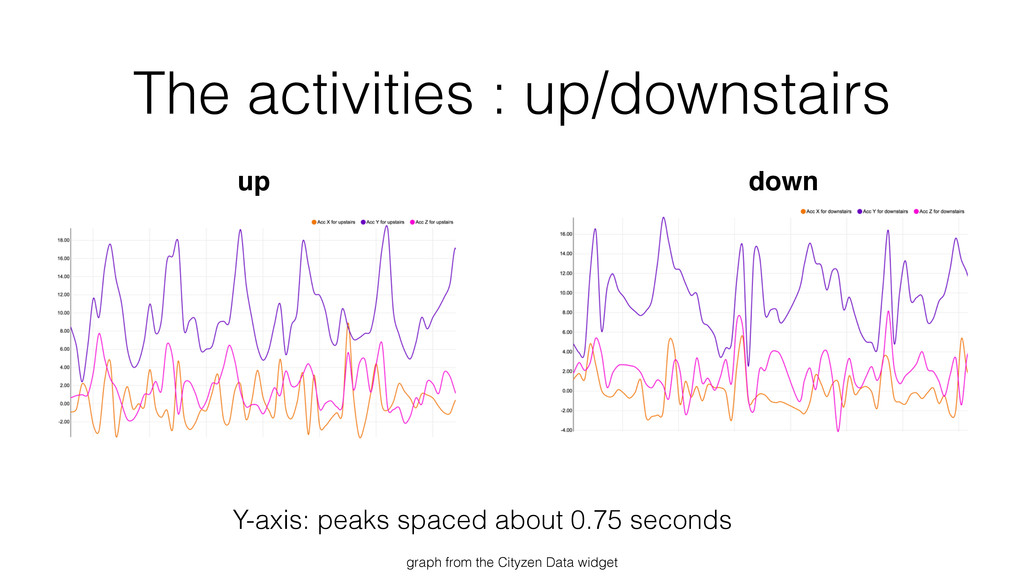
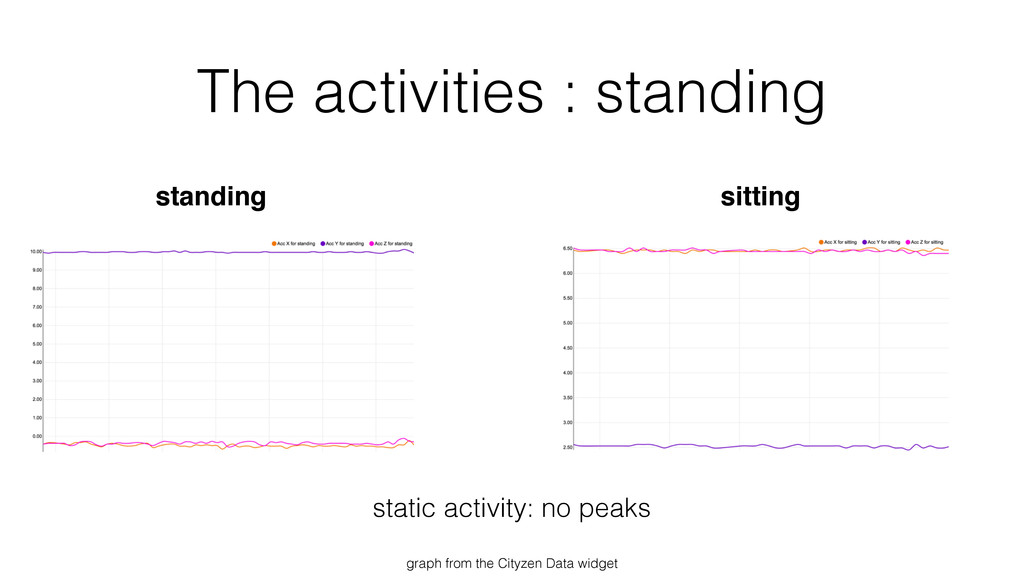
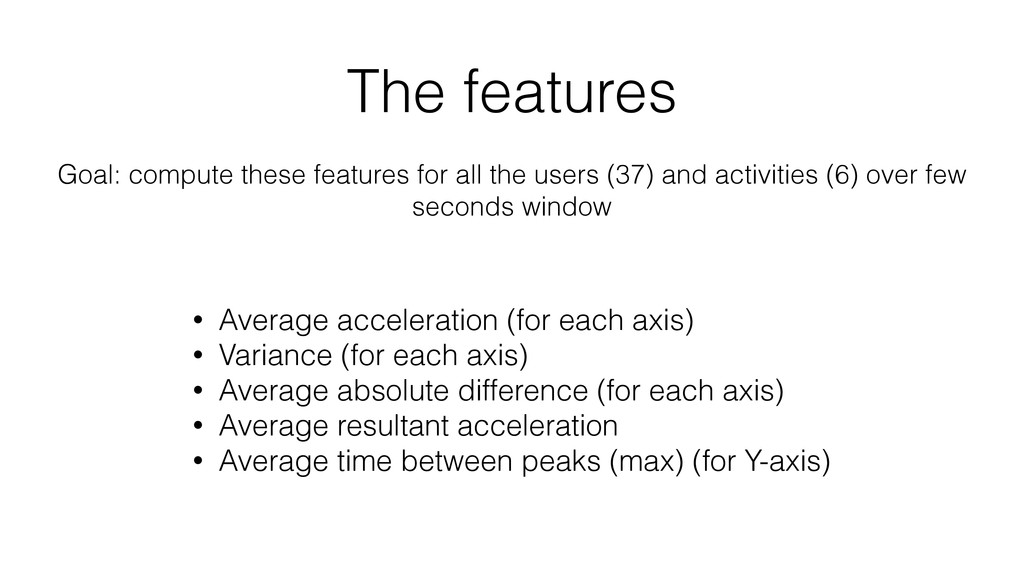
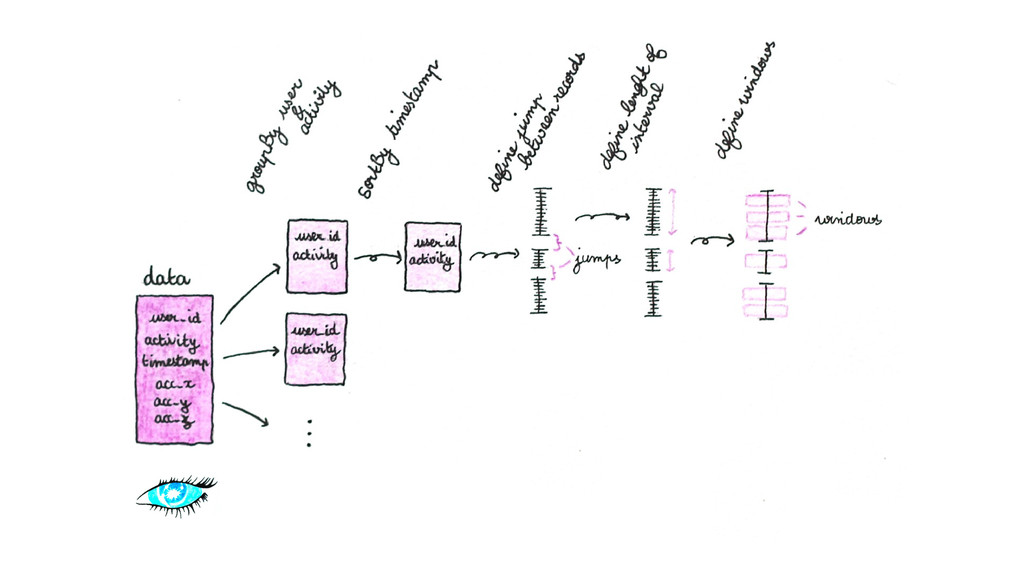
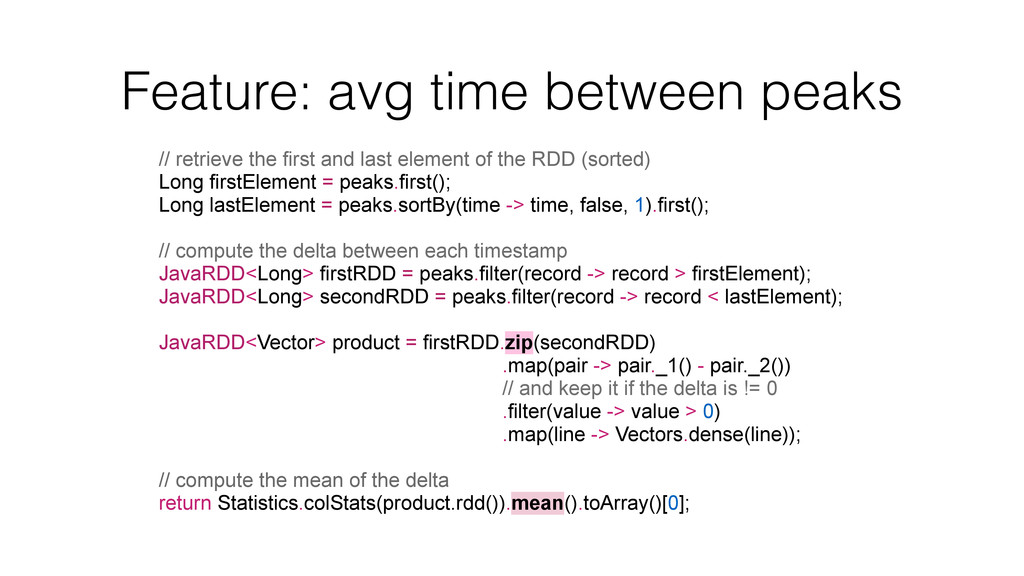
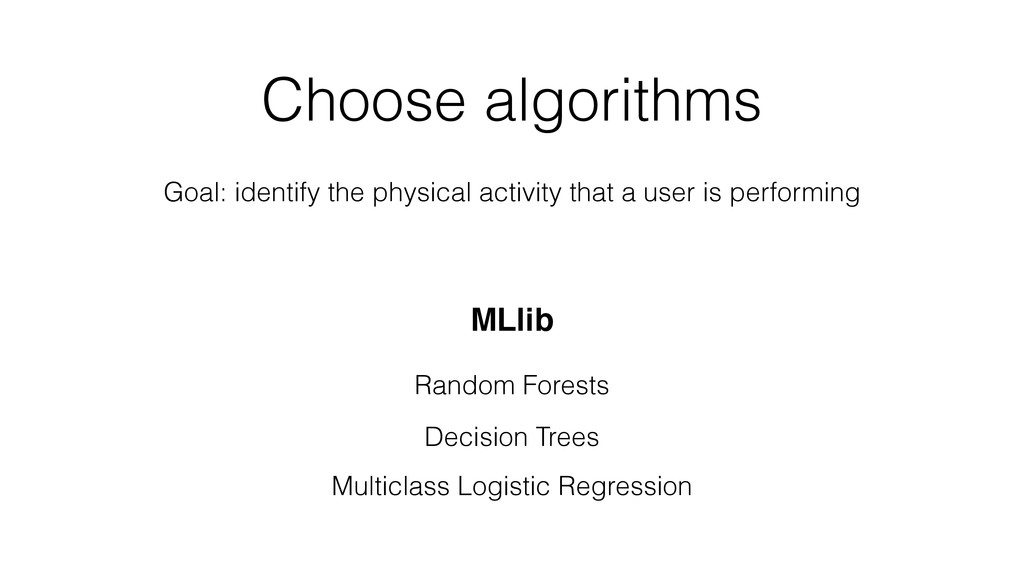
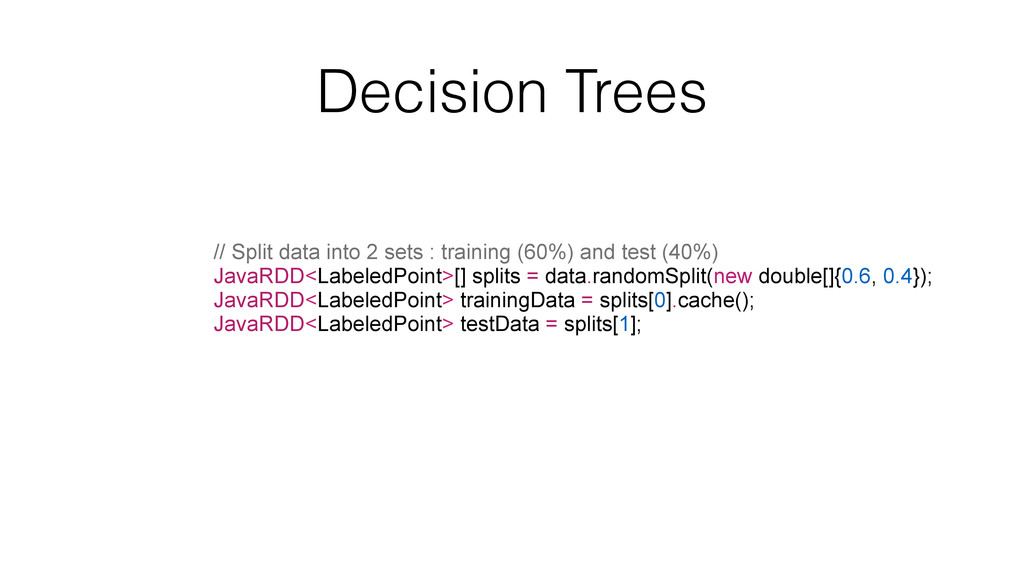
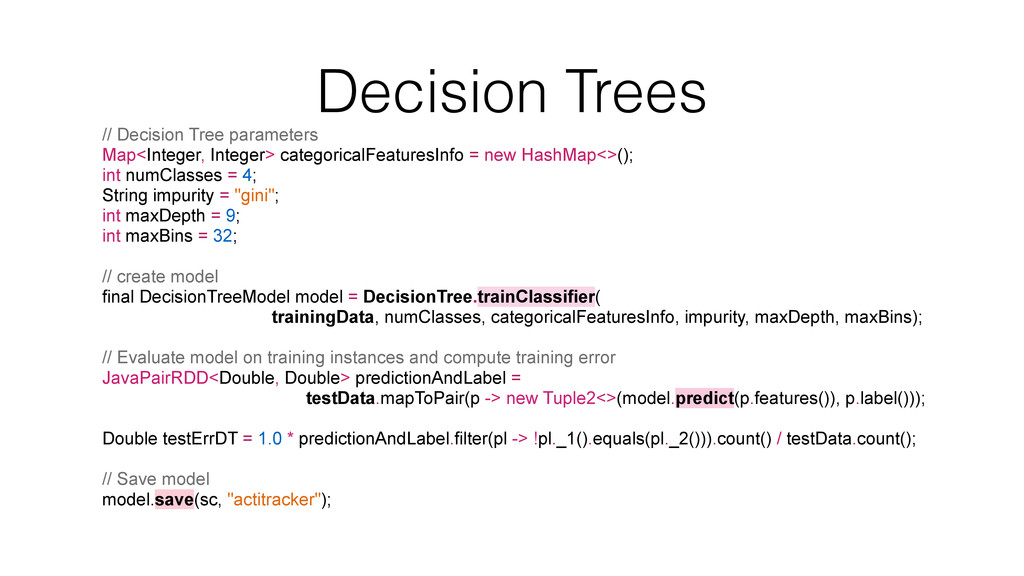
Finally, and this is the bigger part, thanks to a concrete example, I show how I have collected, stored and analyzed data from an accelerometer using Spark, Cassandra and MLlib.
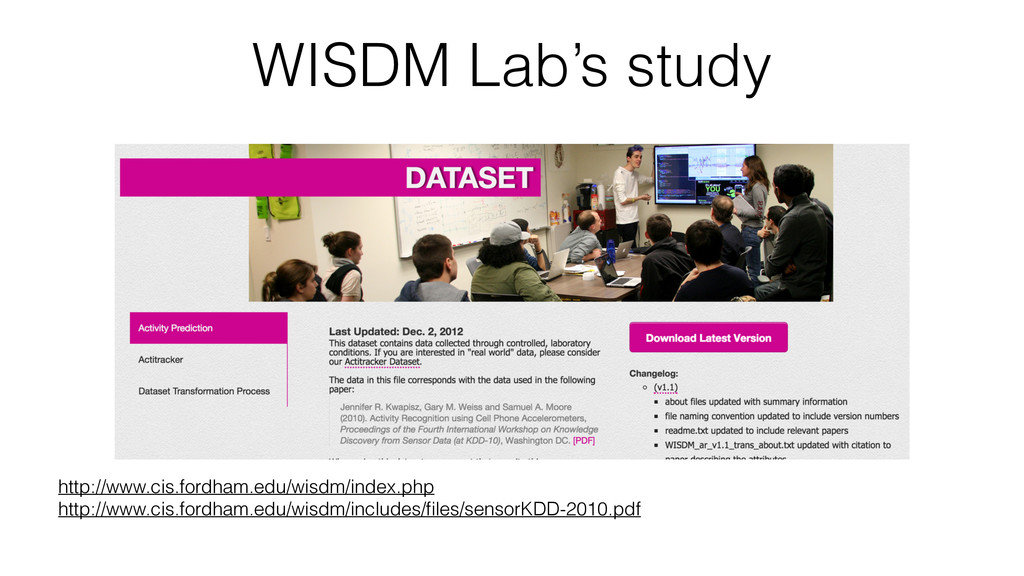
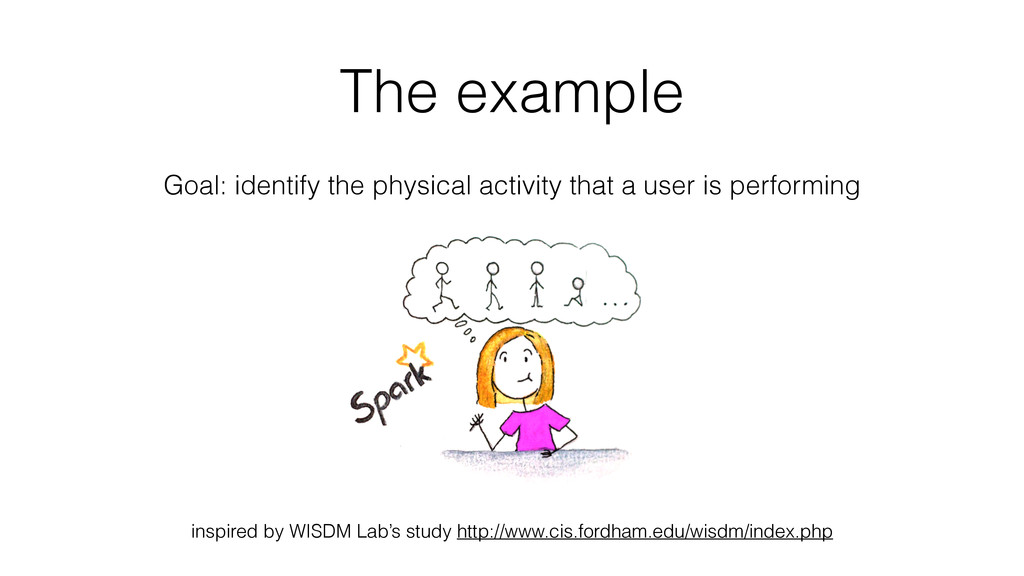
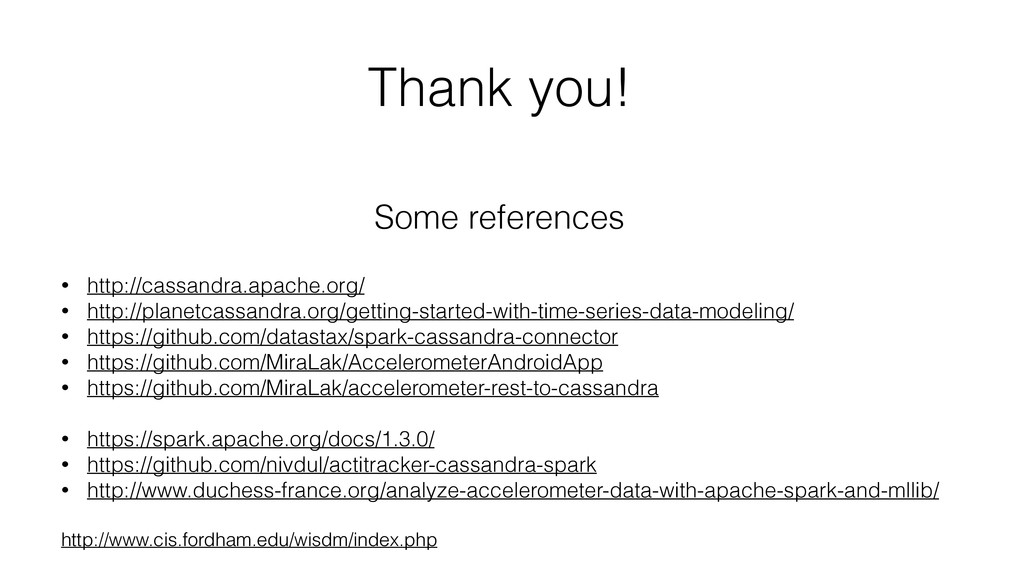
This example is inspired of this study: WISDM Lab’s study.
And the code is available on my github account: https://github.com/nivdul/actitracker-cassandra-spark

Probst Ludwine

June 10, 2015
Tweet

More Decks by Probst Ludwine

Other Decks in Programming

Transcript

  1. aircraft use case: sensor data from a cross-country flight data

    points: several terabytes every hour per sensor data analysis: batch mode or real time analysis applications: • flight performance (optimize plane fuel consumption, • reduce maintenance costs…) • detect anomalies • prevent accidents
  2. insurance use case: data from a connected car key applications:

    • monitoring • real time vehicle location • drive safety • driving score
  3. Why should I care? Because it can affect & change

    our business, our everyday life?
  4. Some protocols… • DDS – Device-to-Device communication – real-time •

    MQTT – Device-to-Server – collect telemetry data • XMPP – Device-to-Server – Instant Messaging scenarios • AMQP – Server-to-Server – connecting devices to backend …
  5. • flat file: limited utility • relational database: limited design

    rigidity • NoSQL database: scalability faster & more flexible Storing TS
  6. The example Goal: identify the physical activity that a user

    is performing inspired by WISDM Lab’s study http://www.cis.fordham.edu/wisdm/index.php
  7. The situation The labeled data comes from an accelerometer (37

    users) Possible activities are: walking, jogging, sitting, standing, downstairs and upstairs. This is a classification problem here! Some algorithms to use: Decision tree, Random Forest, Multinomial logistic regression...
  8. How can I predict the user’s activity? 1. analyzing part:

    collect & clean data from a csv file store it in Cassandra define & extract features using Spark build the predictive model using MLlib 2. predicting part: collect data in real-time (REST) use the model to predict result MLlib https://github.com/nivdul/actitracker-cassandra-spark
  9. The accelerometer A sensor (in a smartphone) compute acceleration over

    X,Y,Z collect data every 50ms Each acceleration contains: • a timestamp (eg, 1428773040488) • acceleration along the X axis (unit is m/s²) • acceleration along the Y axis (unit is m/s²) • acceleration along the Z axis (unit is m/s²)
  10. Accelerometer Data Model CREATE KEYSPACE actitracker WITH replication = {'class':

    'SimpleStrategy', 'replication_factor': 1 }; CREATE TABLE users (user_id int, activity text, timestamp bigint, acc_x double, acc_y double, acc_z double, PRIMARY KEY ((user_id,activity),timestamp)); COPY users FROM '/path_to_your_data/data.csv' WITH HEADER = true;
  11. Accelerometer Data Model: logical view 8 walking 112578291481000 -5.13 8.15

    1.31 8 walking 112578334541000 -5.05 8.16 1.31 8 walking 112578339541000 -5.15 8.16 1.36 8 walking 112578451484000 -5.48 8.17 1.31 8 walking 112578491615000 -5.33 8.16 1.18 activity user_id timestamp acc_x acc_z acc_y graph from the Cityzen Data widget
  12. is a large-scale in-memory data processing framework • big data

    analytics in memory/disk • complements Hadoop • faster and more flexible • Resilient Distributed Datasets (RDD) interactive shell (scala & python) Lambda (Java 8) Spark ecosystem
  13. MLlib • regression • classification • clustering • optimization •

    collaborative filtering • feature extraction (TF-IDF, Word2Vec…) is Apache Spark's scalable machine learning library
  14. The activities : jogging mean_x = 3.3 mean_y = -6.9

    mean_z = 0.8 Y-axis: peaks spaced out about 0.25 seconds graph from the Cityzen Data widget
  15. The activities : walking mean_x = 1 mean_y = 10

    mean_z = -0.3 Y-axis: peaks spaced about 0.5 seconds graph from the Cityzen Data widget
  16. The activities : standing graph from the Cityzen Data widget

    standing static activity: no peaks sitting
  17. The features • Average acceleration (for each axis) • Variance

    (for each axis) • Average absolute difference (for each axis) • Average resultant acceleration • Average time between peaks (max) (for Y-axis) Goal: compute these features for all the users (37) and activities (6) over few seconds window
  18. retrieve the data from Cassandra // define Spark context SparkConf

    sparkConf = new SparkConf() .setAppName("User's physical activity recognition") .set("spark.cassandra.connection.host", "127.0.0.1") .setMaster("local[*]"); JavaSparkContext sc = new JavaSparkContext(sparkConf); // retrieve data from Cassandra and create an CassandraRDD CassandraJavaRDD<CassandraRow> cassandraRowsRDD = javaFunctions(sc).cassandraTable("actitracker", "users");
  19. Feature: mean import org.apache.spark.mllib.stat.MultivariateStatisticalSummary; import org.apache.spark.mllib.stat.Statistics; private MultivariateStatisticalSummary summary; public

    ExtractFeature(JavaRDD<Vector> data) { this.summary = Statistics.colStats(data.rdd()); } // return a Vector (mean_acc_x, mean_acc_y, mean_acc_z) public Vector computeAvgAcc() { return this.summary.mean(); }
  20. Feature: avg time between peaks // define the maximum using

    the max function from MLlib double max = this.summary.max().toArray()[1]; // keep the timestamp of data point for which the value is greater than 0.9 * max // and sort it ! // Here: data = RDD (ts, acc_y) JavaRDD<Long> peaks = data.filter(record -> record[1] > 0.9 * max) .map(record -> record[0]) .sortBy(time -> time, true, 1);
  21. Feature: avg time between peaks // retrieve the first and

    last element of the RDD (sorted) Long firstElement = peaks.first(); Long lastElement = peaks.sortBy(time -> time, false, 1).first(); // compute the delta between each timestamp JavaRDD<Long> firstRDD = peaks.filter(record -> record > firstElement); JavaRDD<Long> secondRDD = peaks.filter(record -> record < lastElement); JavaRDD<Vector> product = firstRDD.zip(secondRDD) .map(pair -> pair._1() - pair._2()) // and keep it if the delta is != 0 .filter(value -> value > 0) .map(line -> Vectors.dense(line)); // compute the mean of the delta return Statistics.colStats(product.rdd()).mean().toArray()[0];
  22. Choose algorithms Random Forests Decision Trees Multiclass Logistic Regression MLlib

    Goal: identify the physical activity that a user is performing
  23. Decision Trees // Split data into 2 sets : training

    (60%) and test (40%) JavaRDD<LabeledPoint>[] splits = data.randomSplit(new double[]{0.6, 0.4}); JavaRDD<LabeledPoint> trainingData = splits[0].cache(); JavaRDD<LabeledPoint> testData = splits[1];
  24. Decision Trees // Decision Tree parameters Map<Integer, Integer> categoricalFeaturesInfo =

    new HashMap<>(); int numClasses = 4; String impurity = "gini"; int maxDepth = 9; int maxBins = 32; // create model final DecisionTreeModel model = DecisionTree.trainClassifier( trainingData, numClasses, categoricalFeaturesInfo, impurity, maxDepth, maxBins); // Evaluate model on training instances and compute training error JavaPairRDD<Double, Double> predictionAndLabel = testData.mapToPair(p -> new Tuple2<>(model.predict(p.features()), p.label())); Double testErrDT = 1.0 * predictionAndLabel.filter(pl -> !pl._1().equals(pl._2())).count() / testData.count(); // Save model model.save(sc, "actitracker");
  25. Accelerometer Android app REST Api collecting data coming from a

    phone application An example: https://github.com/MiraLak/accelerometer-rest-to-cassandra
  26. Predictions! // load the model saved before DecisionTreeModel model =

    DecisionTreeModel.load(sc.sc(), "actitracker"); // connection between Spark and Cassandra using the spark-cassandra-connector CassandraJavaRDD<CassandraRow> cassandraRowsRDD = javaFunctions(sc).cassandraTable("accelerations", "acceleration"); // retrieve data from Cassandra and create an CassandraRDD JavaRDD<CassandraRow> data = cassandraRowsRDD.select("timestamp", "acc_x", "acc_y", "acc_z") .where("user_id=?", "TEST_USER") .withDescOrder() .limit(250); Vector feature = computeFeature(sc); double prediction = model.predict(feature);
  27. How can I use my computations? possible applications: • adapt

    the music over your speed • detects lack of activity • smarter pacemakers • smarter oxygen therapy
  28. • http://cassandra.apache.org/ • http://planetcassandra.org/getting-started-with-time-series-data-modeling/ • https://github.com/datastax/spark-cassandra-connector • https://github.com/MiraLak/AccelerometerAndroidApp • https://github.com/MiraLak/accelerometer-rest-to-cassandra

    • https://spark.apache.org/docs/1.3.0/ • https://github.com/nivdul/actitracker-cassandra-spark • http://www.duchess-france.org/analyze-accelerometer-data-with-apache-spark-and-mllib/ http://www.cis.fordham.edu/wisdm/index.php Some references Thank you!