Upgrade to Pro — share decks privately, control downloads, hide ads and more …

Challenges in Representing Spatio-Temporal Wildlife Migration Data

Challenges in Representing Spatio-Temporal Wildlife Migration Data

Lauren Tierney, InfoGraphics Lab, Department of Geography, University of Oregon
James E. Meacham, InfoGraphics Lab, Department of Geography, University of Oregon
Alethea Y. Steingisser, InfoGraphics Lab, Department of Geography, University of Oregon
Emily L. Nyholm, InfoGraphics Lab, Department of Geography, University of Oregon

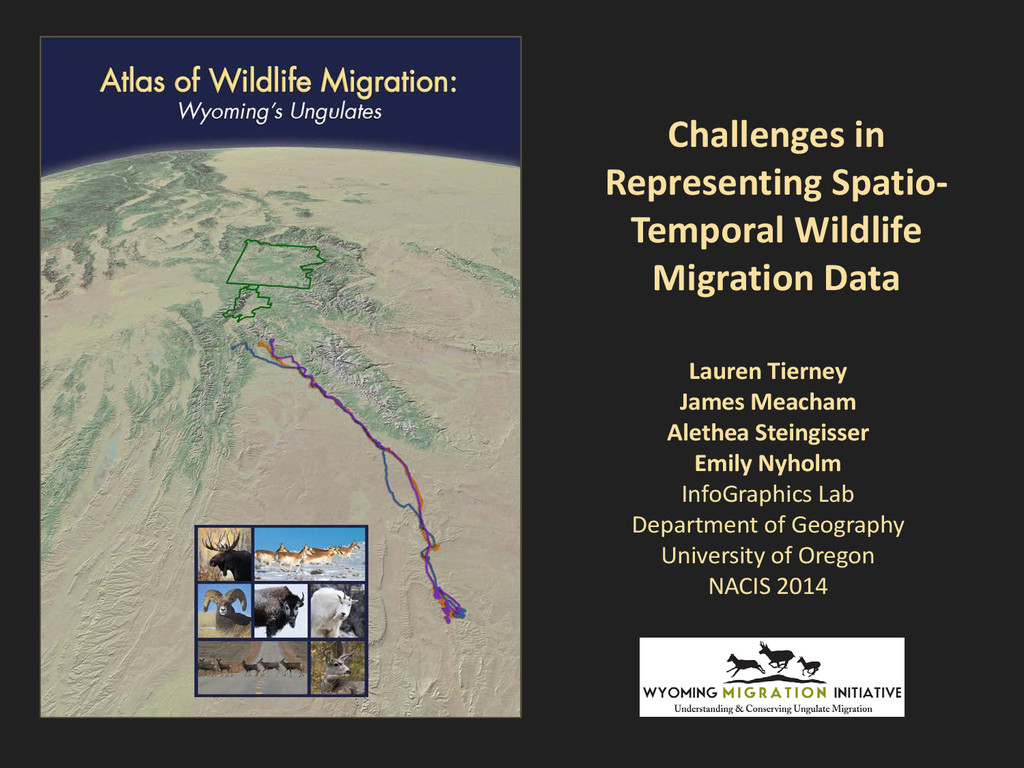
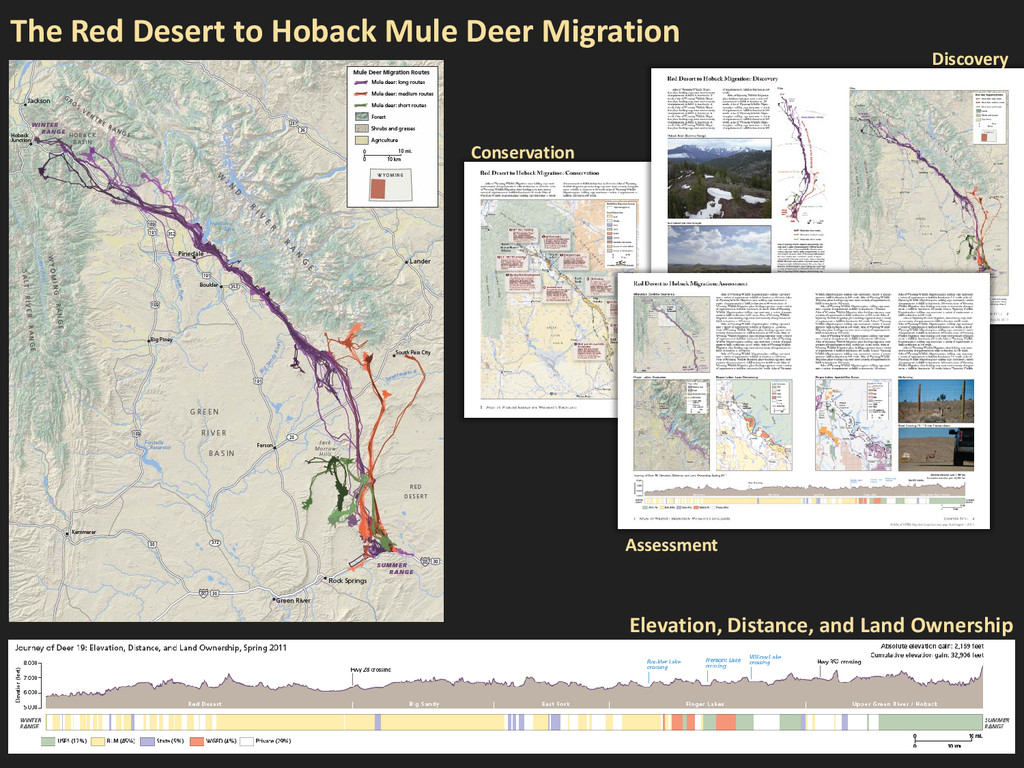
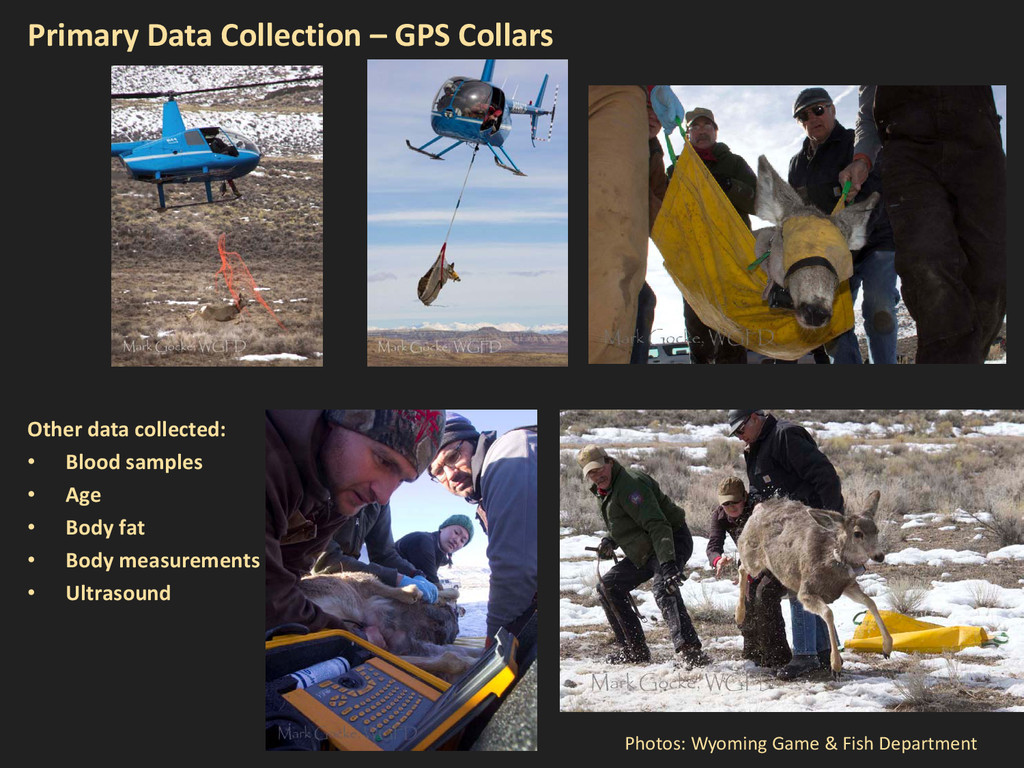
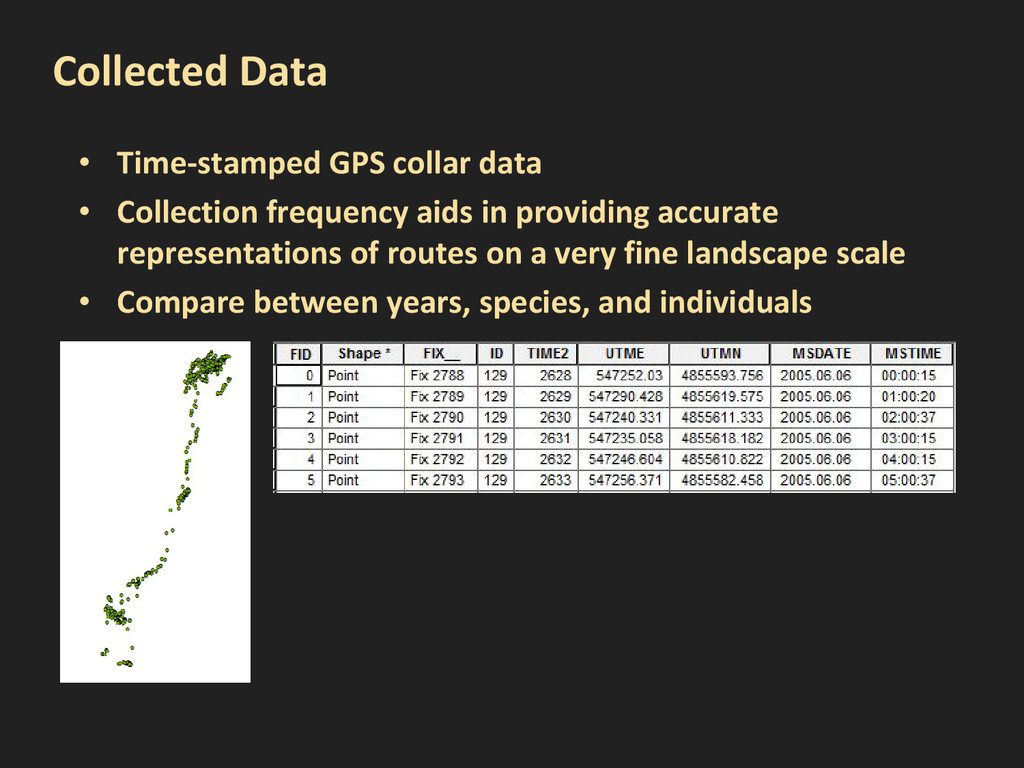
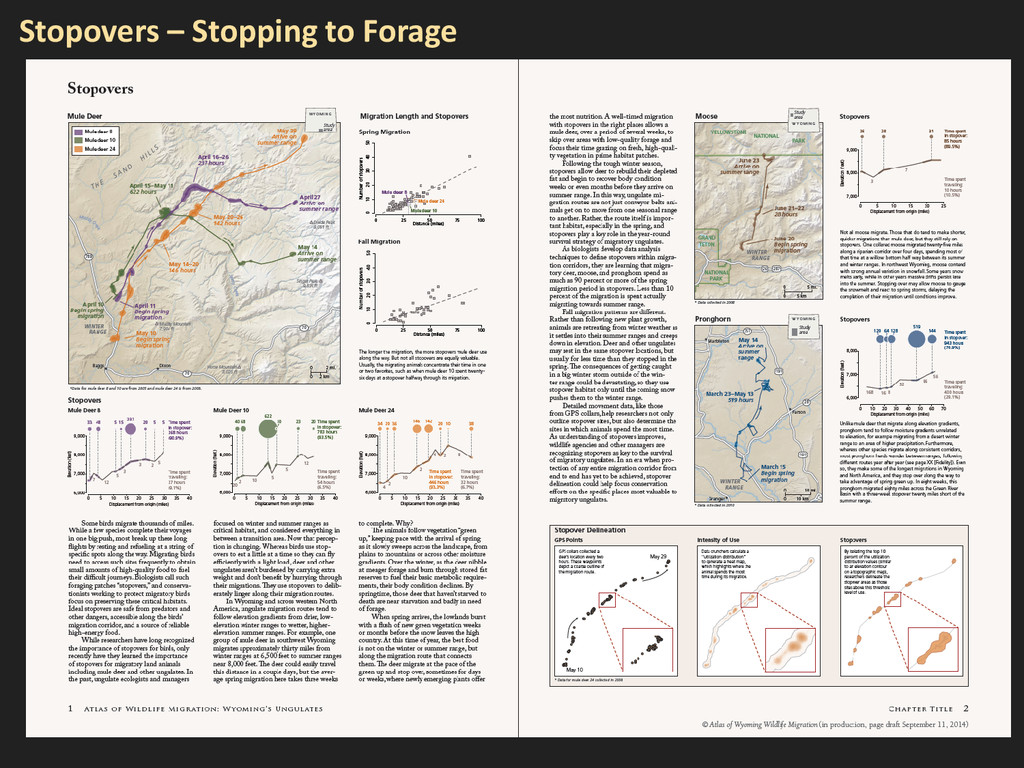
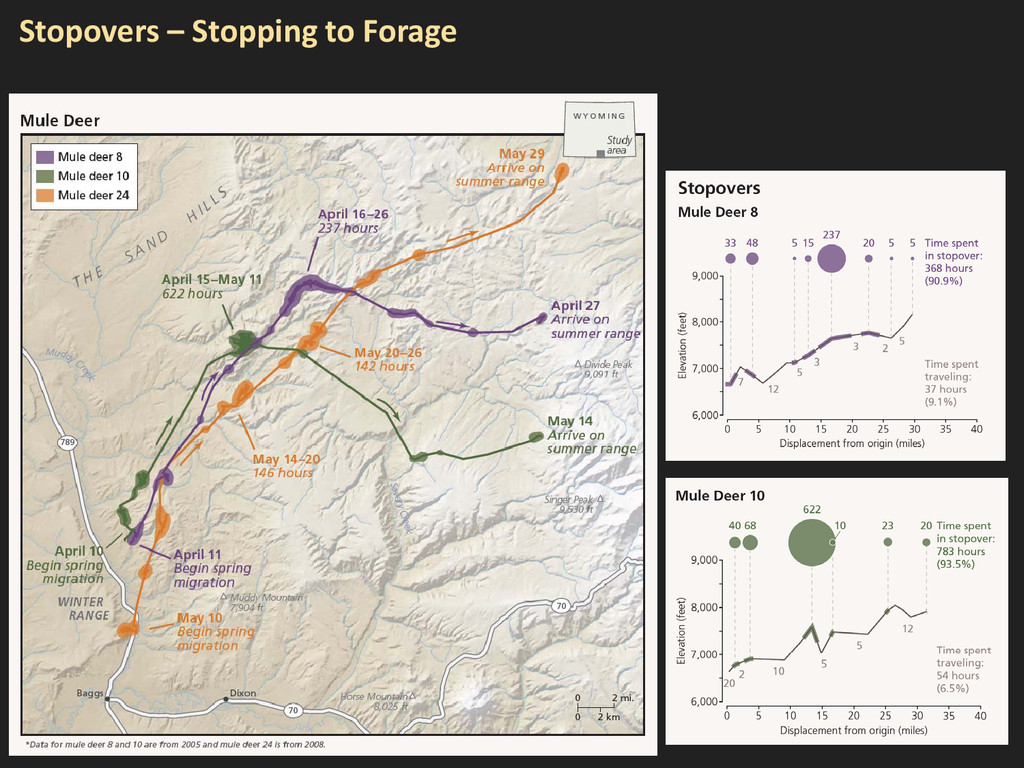
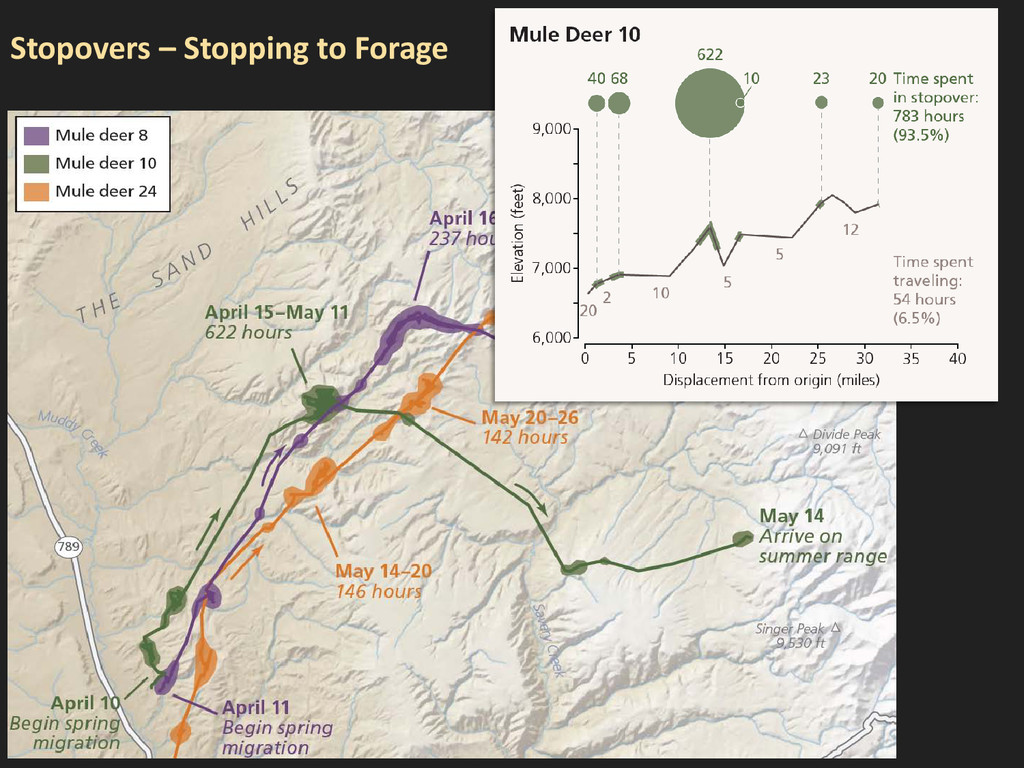
New GPS-collar technology is providing wildlife ecologists the opportunity to collect an immense amount of location and time-stamped data, giving new insight into animal migration and ecology that was not possible before. Mapping and visualizing the wildlife migration data in meaningful ways poses many design challenges. This presentation focuses on the temporal data and cartographic design challenges encountered in the creation of thematic maps and data graphics for the in-production Atlas of Wildlife Migration: Wyoming's Ungulates, as well as associated scientific and conservation reports. The recent discovery of the longest land mammal migration in the lower 48 states, the 150-mile "Red Desert to Hoback" mule deer seasonal migration, will be featured in this presentation.

NACIS 2014

Nathaniel V. KELSO

October 10, 2014
Tweet

More Decks by Nathaniel V. KELSO

Other Decks in Design

Transcript

  1. Challenges in Representing Spatio- Temporal Wildlife Migration Data Lauren Tierney

    James Meacham Alethea Steingisser Emily Nyholm InfoGraphics Lab Department of Geography University of Oregon NACIS 2014
  2. http://vimeo.com/88619272 Film Clip Red Desert to Hoback Mule Deer Migration

    The longest land mammal migration in the lower 48
  3. The Red Desert to Hoback Mule Deer Migration Discovery Conservation

    Assessment Elevation, Distance, and Land Ownership
  4. Primary Data Collection – GPS Collars Photos: Wyoming Game &

    Fish Department Other data collected: • Blood samples • Age • Body fat • Body measurements • Ultrasound
  5. Collected Data • Time-stamped GPS collar data • Collection frequency

    aids in providing accurate representations of routes on a very fine landscape scale • Compare between years, species, and individuals
  6. Data Analysis: How do we use it? • Used to

    create lines and annotate seasonal ranges, intensity of use, and stopovers
  7. Wyoming Cooperative Fish and Wildlife Research Unit – USGS University

    of Wyoming Matt Kauffman Senior Editor Hall Sawyer Associate Editor William Rudd Contributing Editor Matt Hayes Spatial Analyst Emilene Ostlind Text editor University of Oregon InfoGraphics Lab Department of Geography James Meacham Cartographic Editor Alethea Steingisser Production Manager Lauren Tierney Graduate Research Fellow Students Megen Brittell, Riley Champine, Emily Nyholm