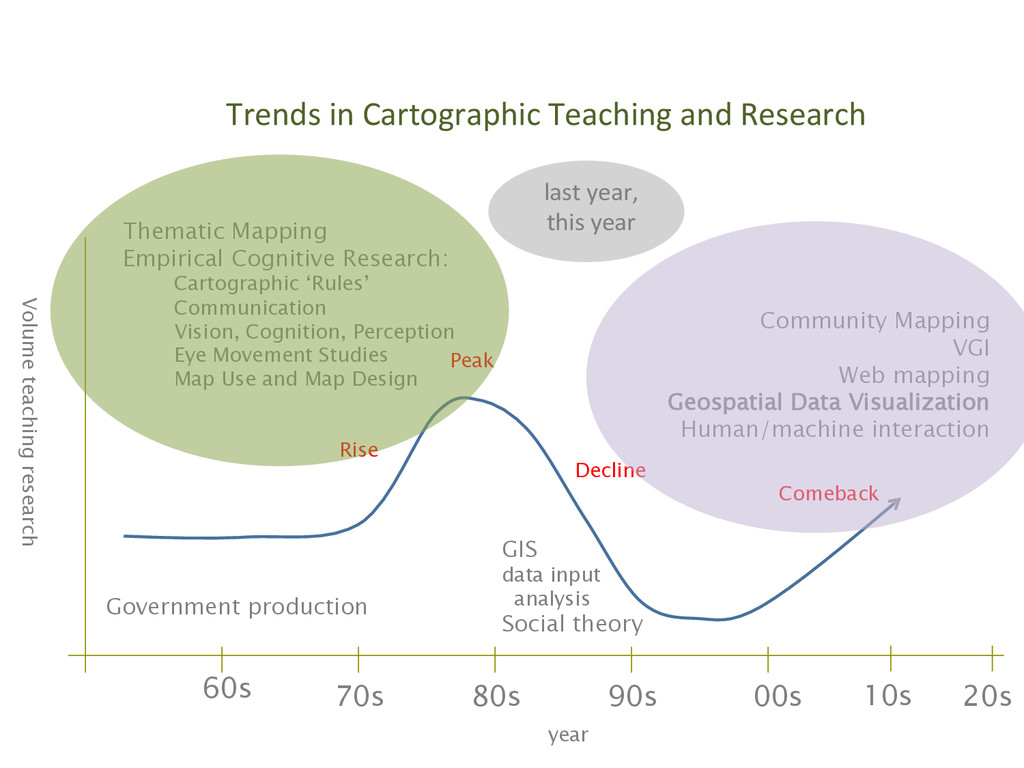
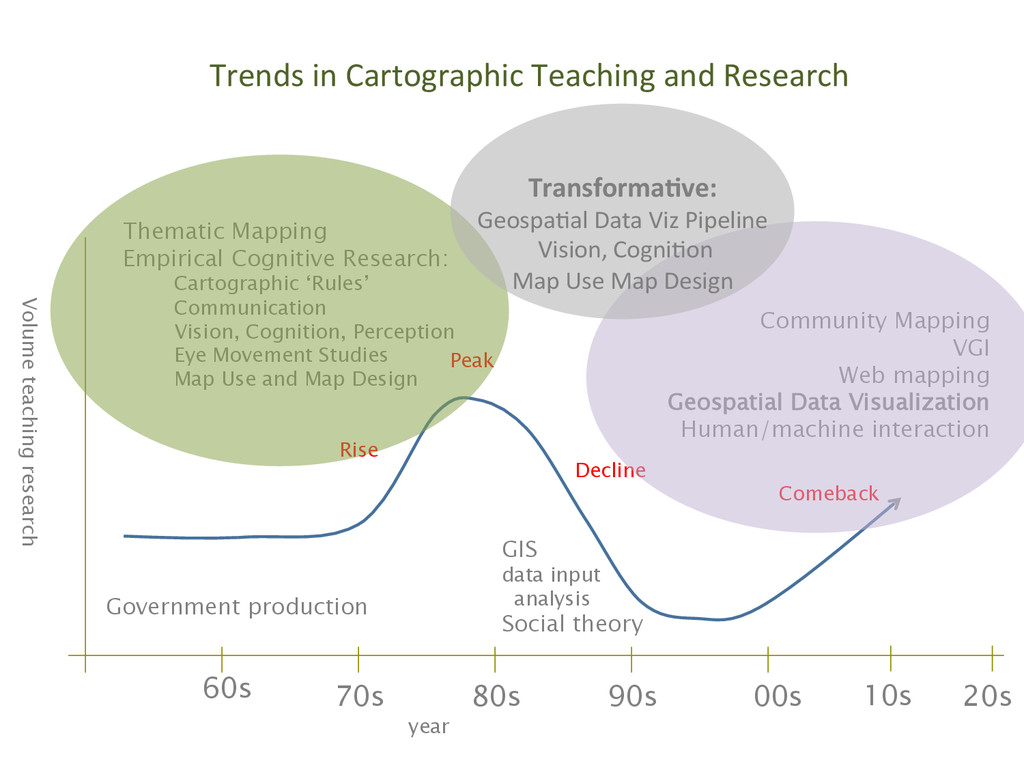
80s 90s 00s Government production Thematic Mapping Empirical Cognitive Research: Cartographic ‘Rules’ Communication Vision, Cognition, Perception Eye Movement Studies Map Use and Map Design GIS data input analysis Social theory Community Mapping VGI Web mapping Geospatial Data Visualization Human/machine interaction Volume teaching research year Rise Peak Decline Comeback 10s 20s last year, this year
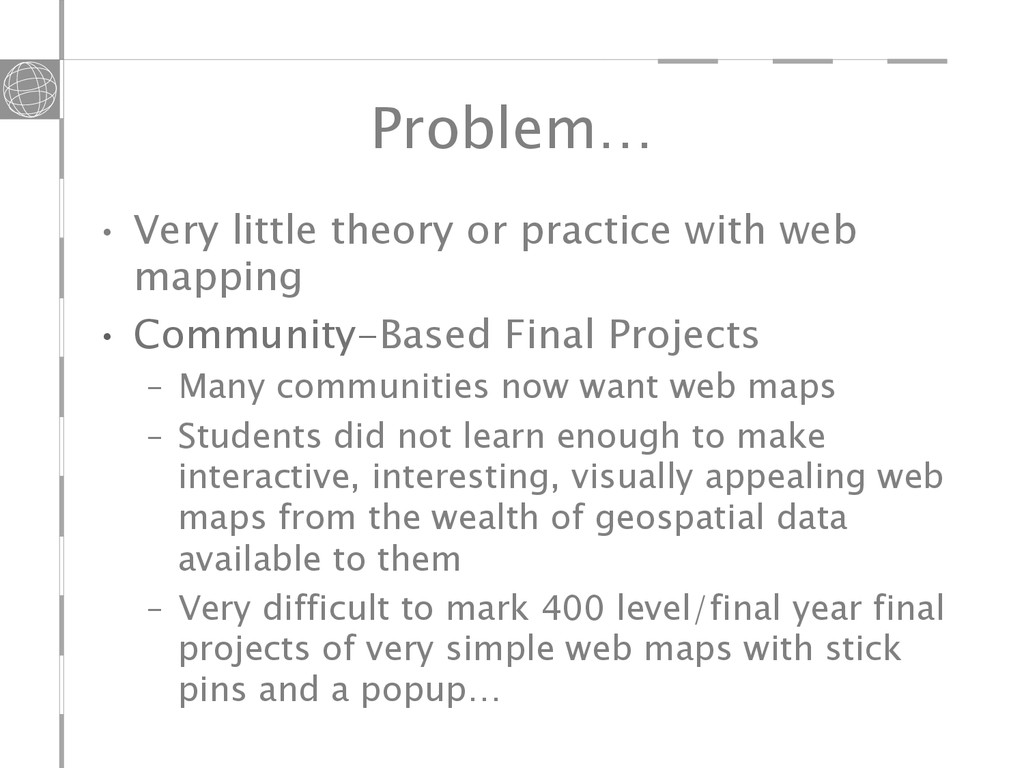
• Community-Based Final Projects – Many communities now want web maps – Students did not learn enough to make interactive, interesting, visually appealing web maps from the wealth of geospatial data available to them – Very difficult to mark 400 level/final year final projects of very simple web maps with stick pins and a popup…
80s 90s 00s Government production Thematic Mapping Empirical Cognitive Research: Cartographic ‘Rules’ Communication Vision, Cognition, Perception Eye Movement Studies Map Use and Map Design GIS data input analysis Social theory Community Mapping VGI Web mapping Geospatial Data Visualization Human/machine interaction Volume teaching research year Rise Peak Decline Comeback 10s 20s Transforma)ve: Geospa@al Data Viz Pipeline Vision, Cogni@on Map Use Map Design
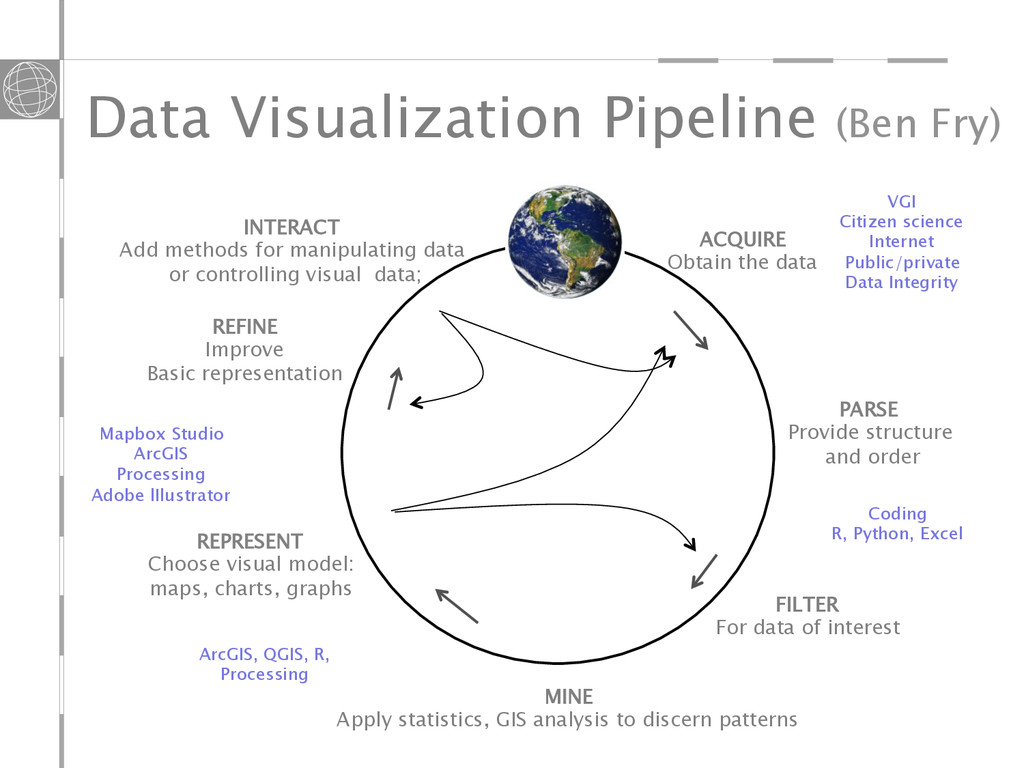
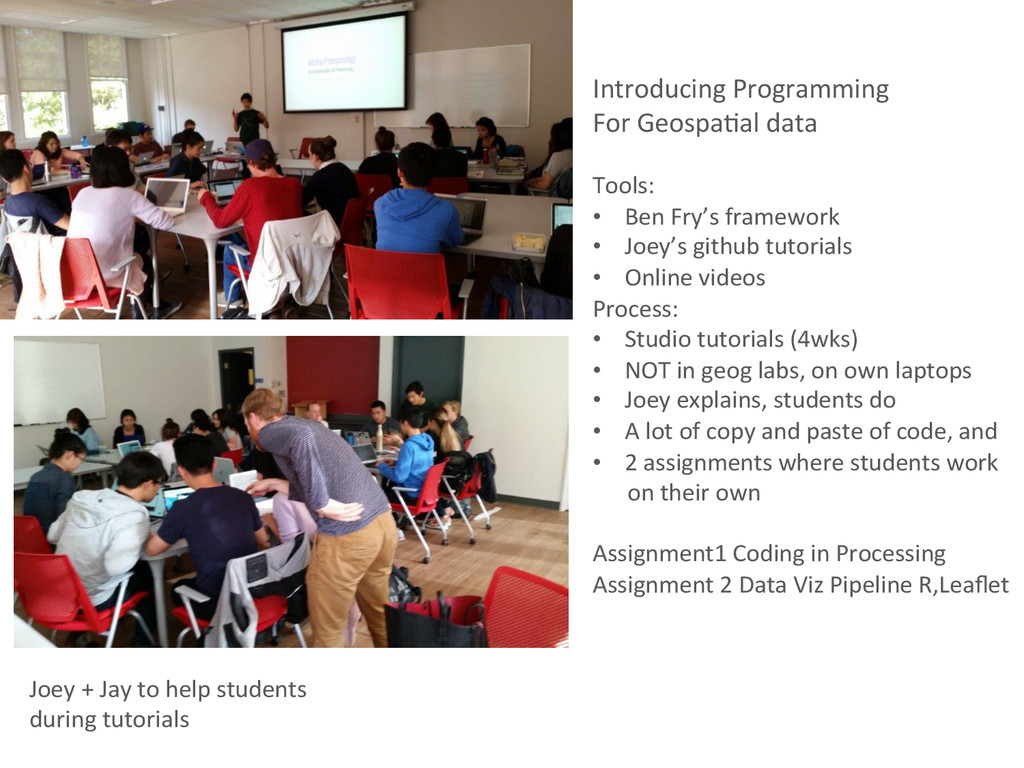
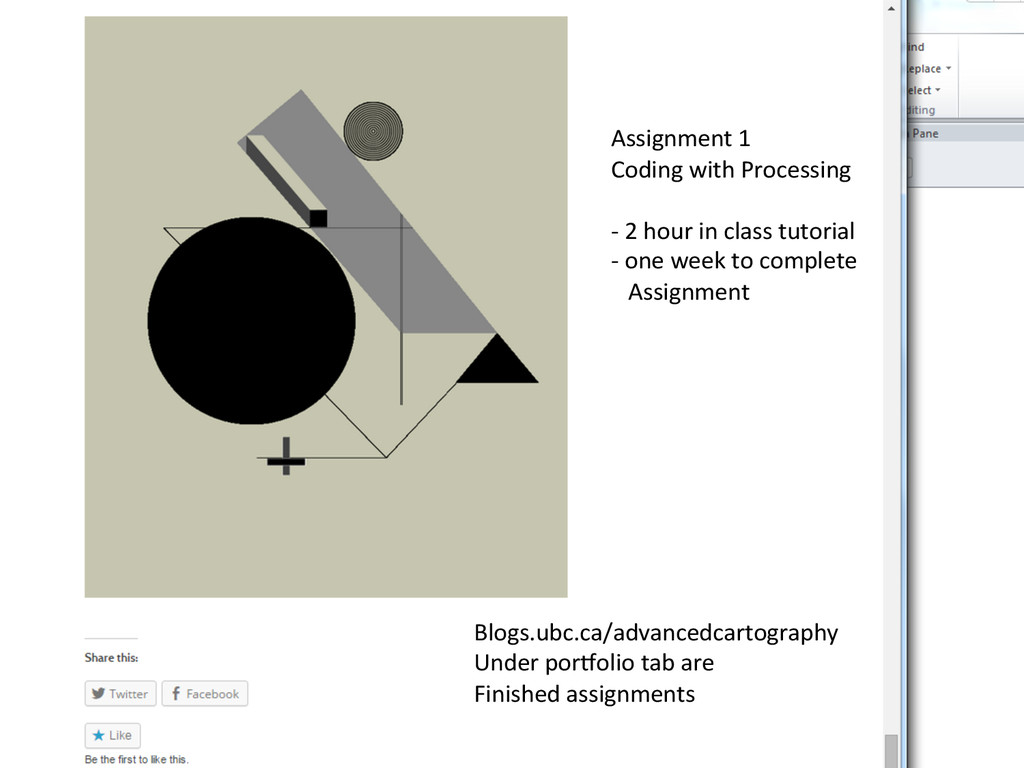
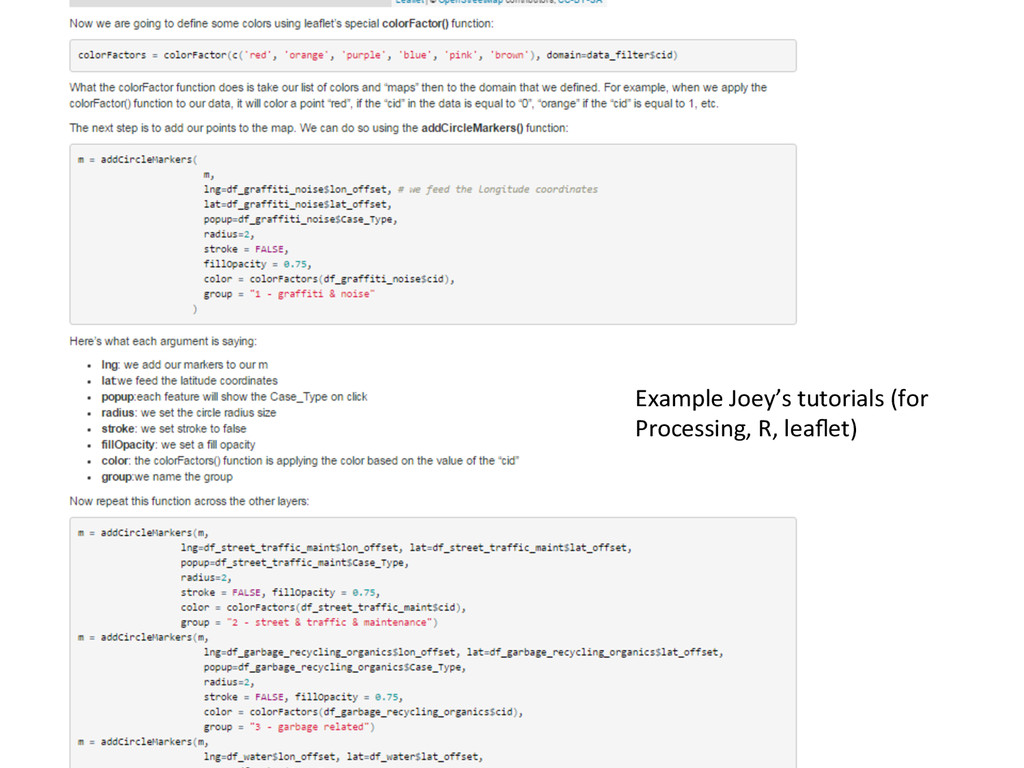
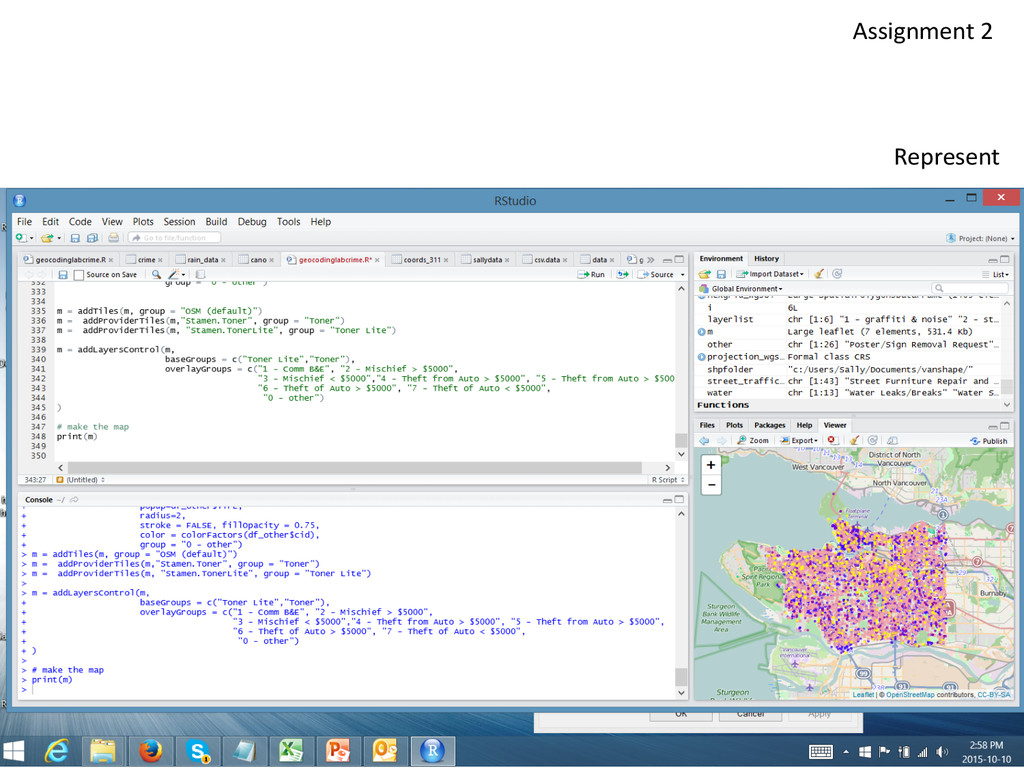
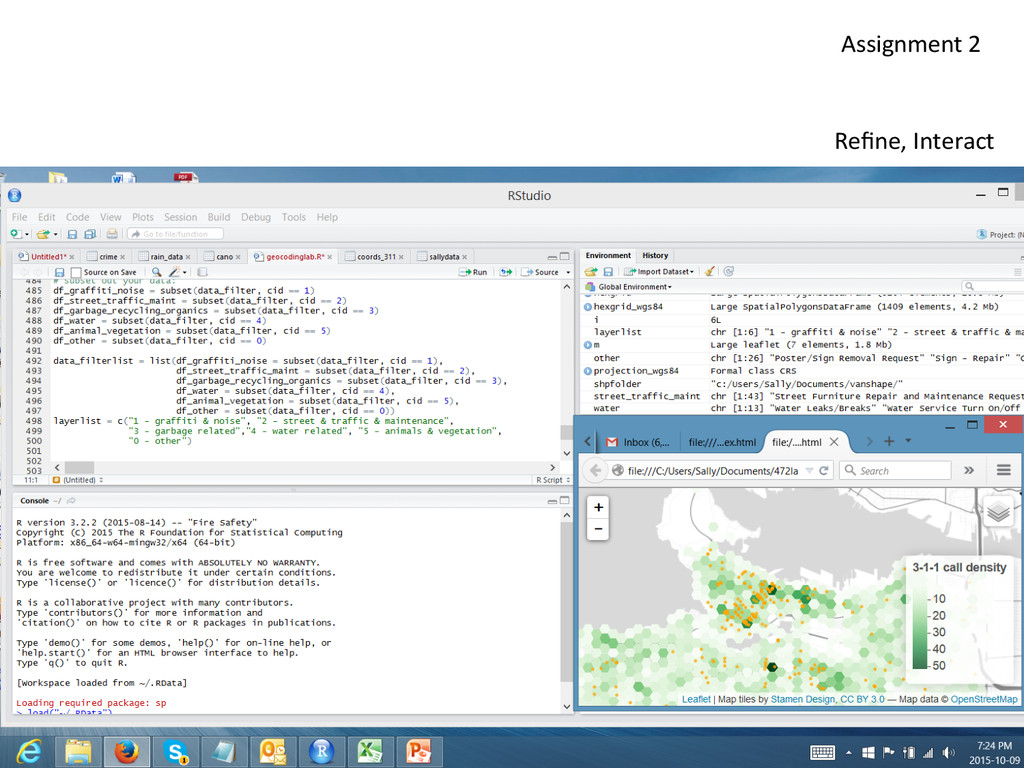
• Ben Fry’s framework • Joey’s github tutorials • Online videos Process: • Studio tutorials (4wks) • NOT in geog labs, on own laptops • Joey explains, students do • A lot of copy and paste of code, and • 2 assignments where students work on their own Assignment1 Coding in Processing Assignment 2 Data Viz Pipeline R,Leaflet Joey + Jay to help students during tutorials
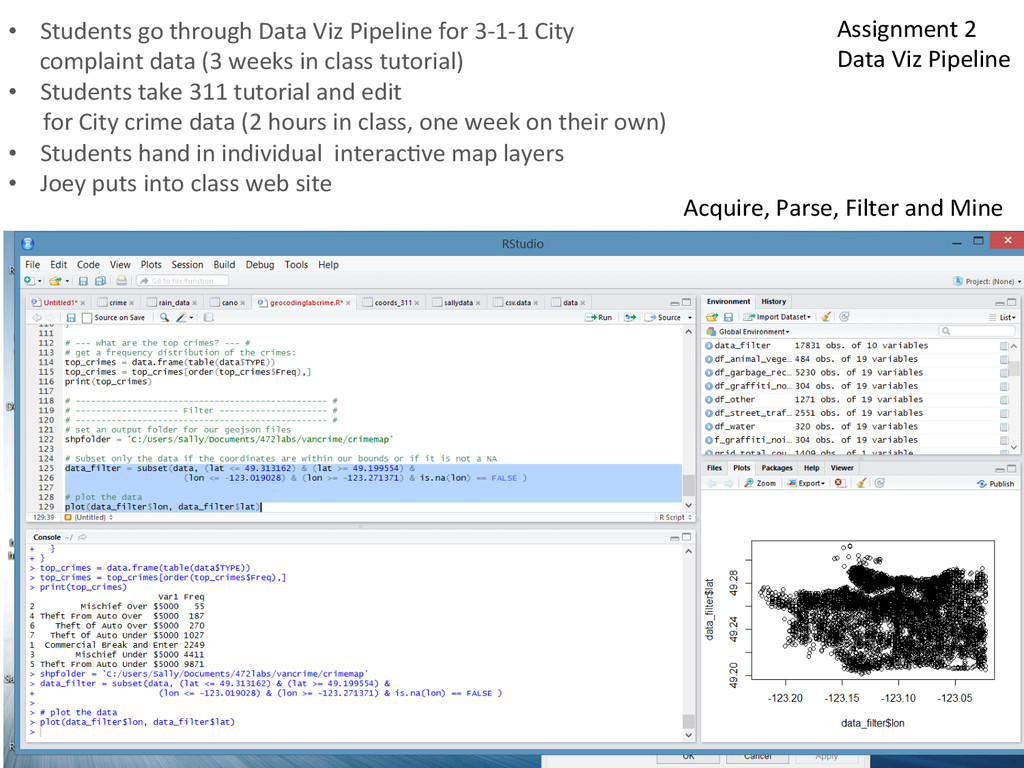
Filter and Mine • Students go through Data Viz Pipeline for 3-‐1-‐1 City complaint data (3 weeks in class tutorial) • Students take 311 tutorial and edit for City crime data (2 hours in class, one week on their own) • Students hand in individual interac@ve map layers • Joey puts into class web site
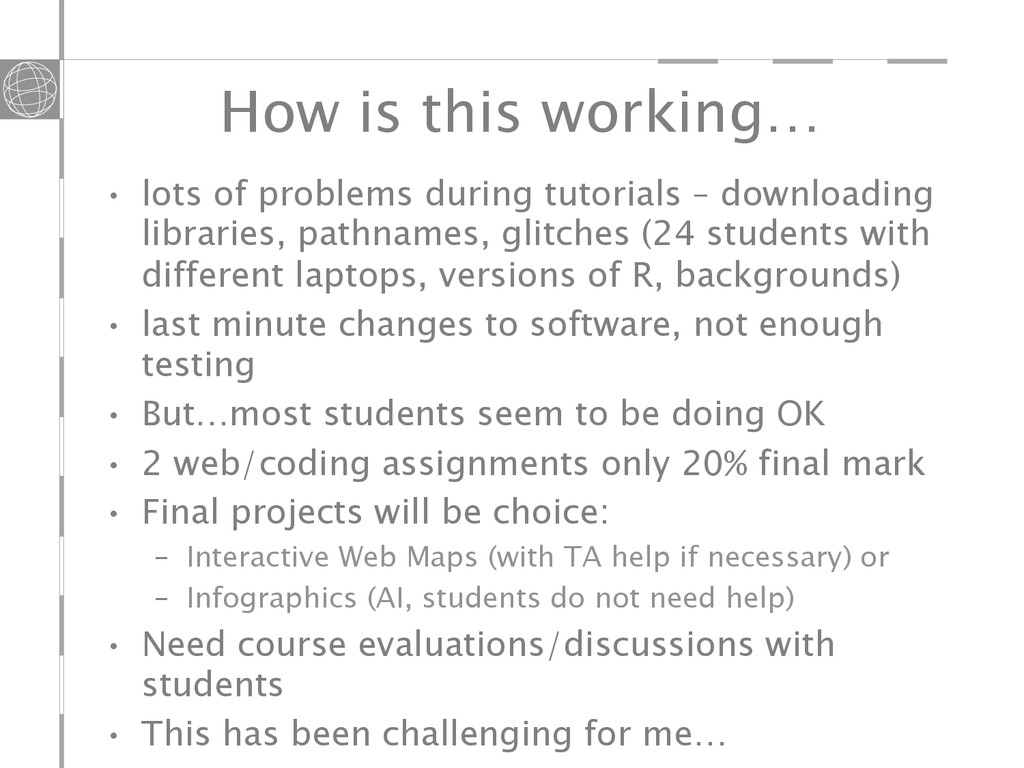
– downloading libraries, pathnames, glitches (24 students with different laptops, versions of R, backgrounds) • last minute changes to software, not enough testing • But…most students seem to be doing OK • 2 web/coding assignments only 20% final mark • Final projects will be choice: – Interactive Web Maps (with TA help if necessary) or – Infographics (AI, students do not need help) • Need course evaluations/discussions with students • This has been challenging for me…
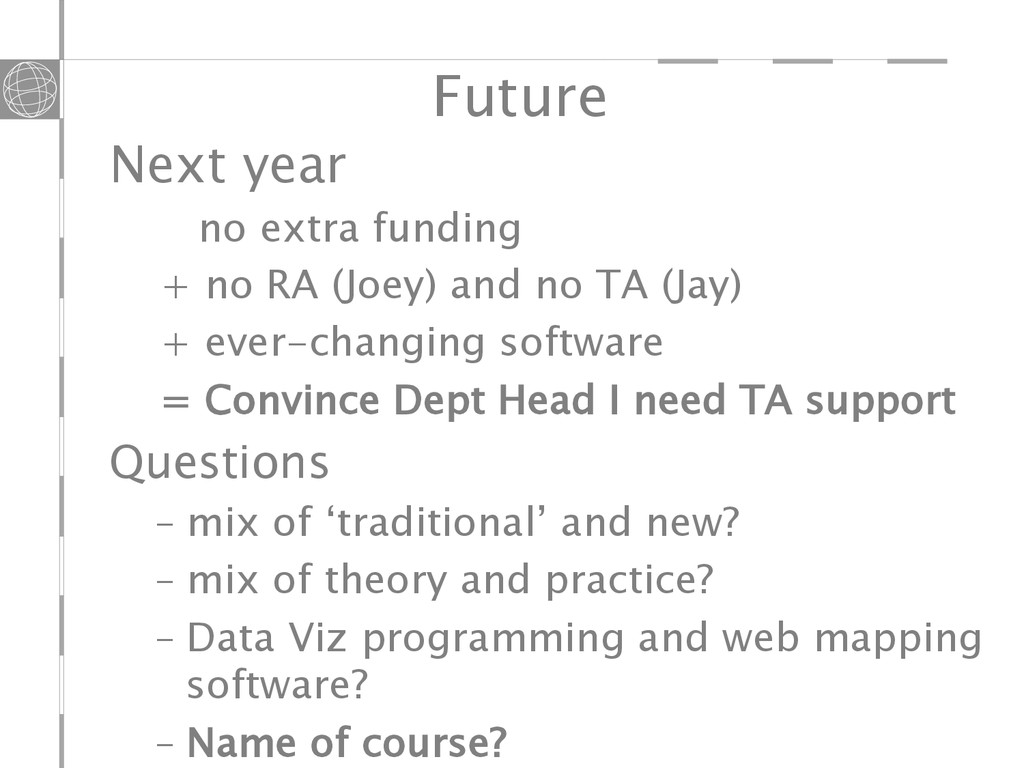
and no TA (Jay) + ever-changing software = Convince Dept Head I need TA support Questions – mix of ‘traditional’ and new? – mix of theory and practice? – Data Viz programming and web mapping software? – Name of course?