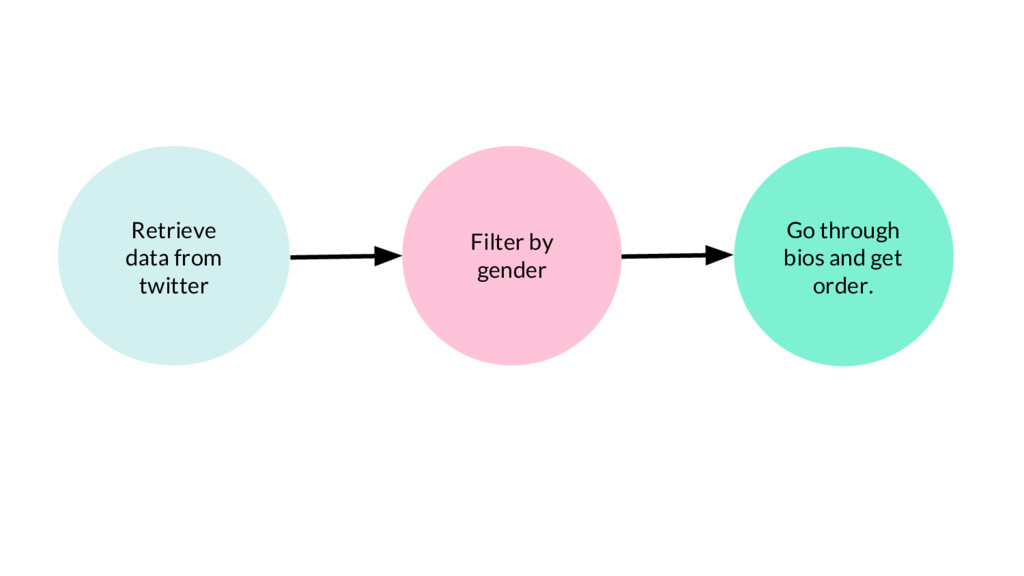
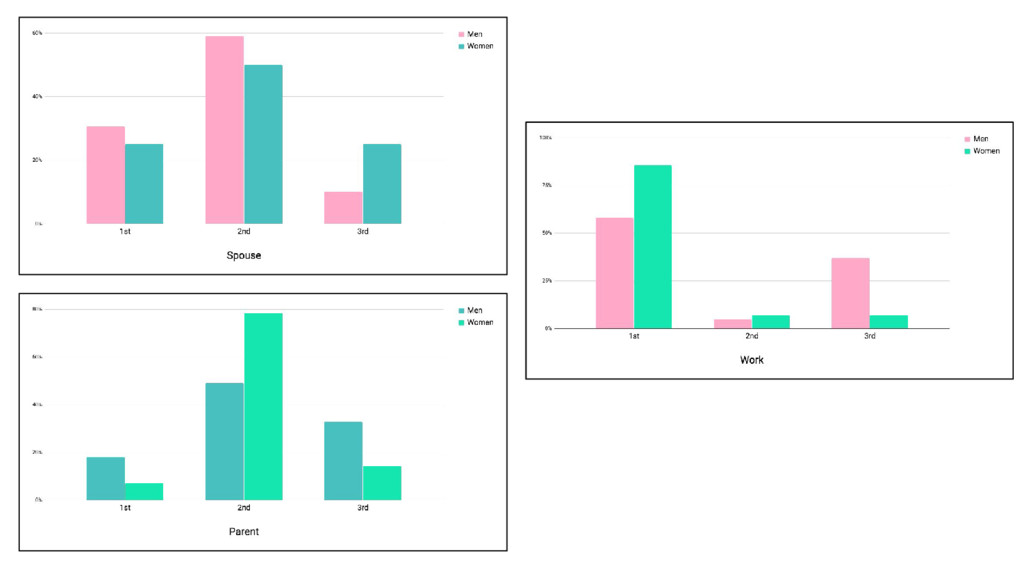
In my talk, I’m going to explore how we can answer our own questions through data exploration and how to foster curiosity. By taking the audience through one of my experiments, I will give them an overview of how to obtain and analyze data to reach a conclusion.