Upgrade to Pro — share decks privately, control downloads, hide ads and more …

MapD & H20.ai: GPU-powered Visualization and Machine Learning

OmniSci
October 05, 2017

MapD & H20.ai: GPU-powered Visualization and Machine Learning

GPU-powered Visualization and
Machine Learning with Ashish Sahu & Mateusz Dymczyk
Oct 5, 2017

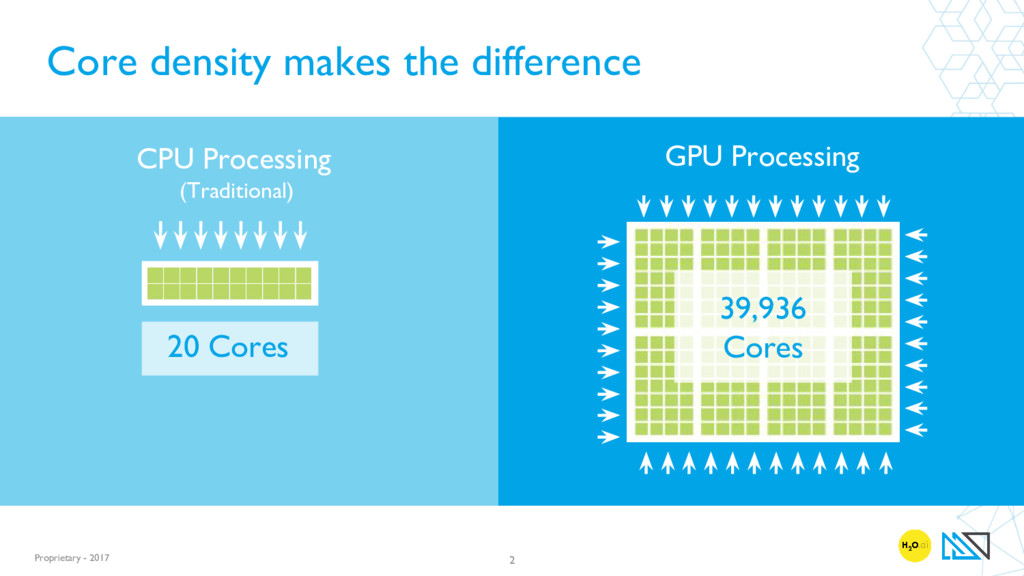
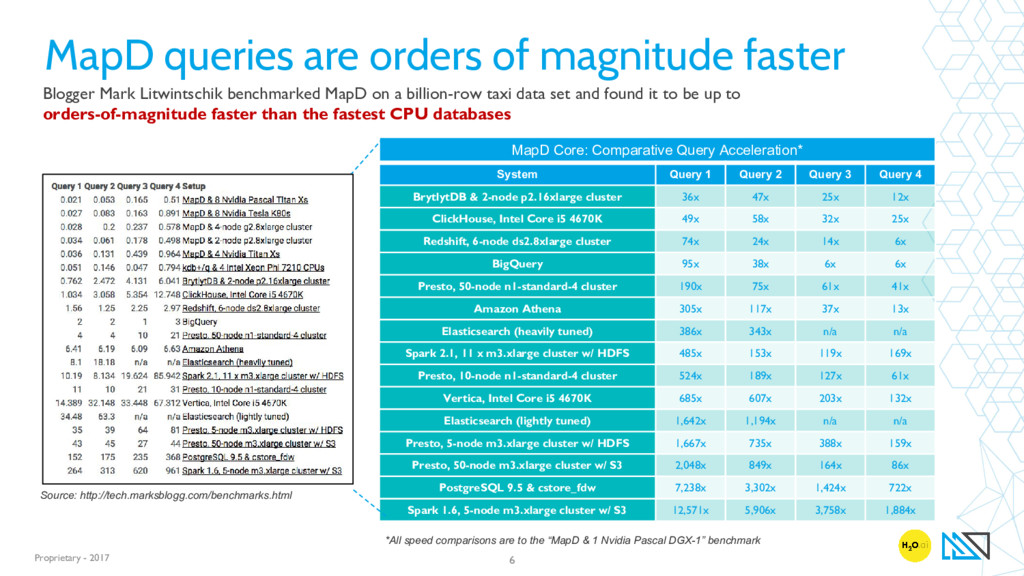
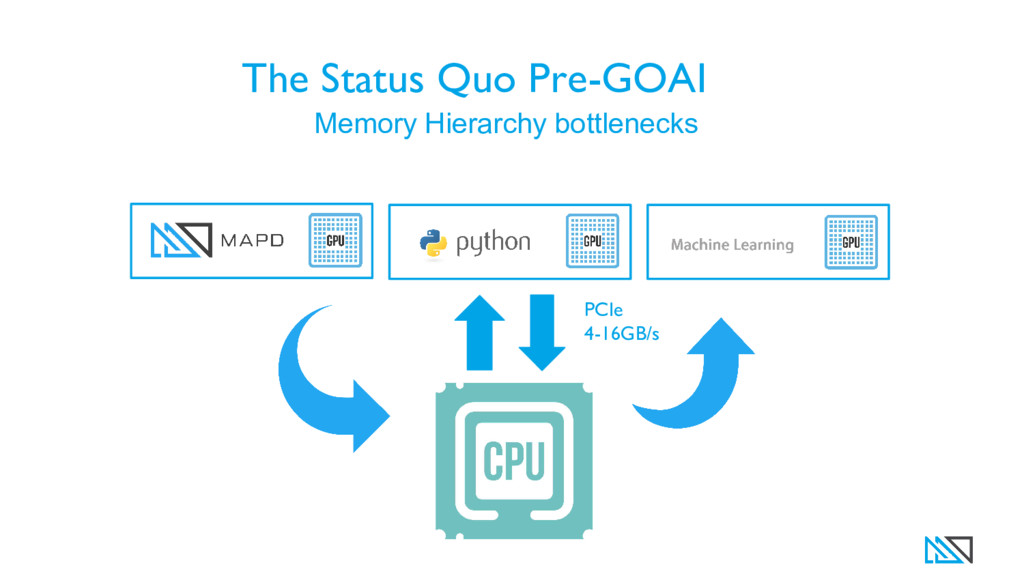
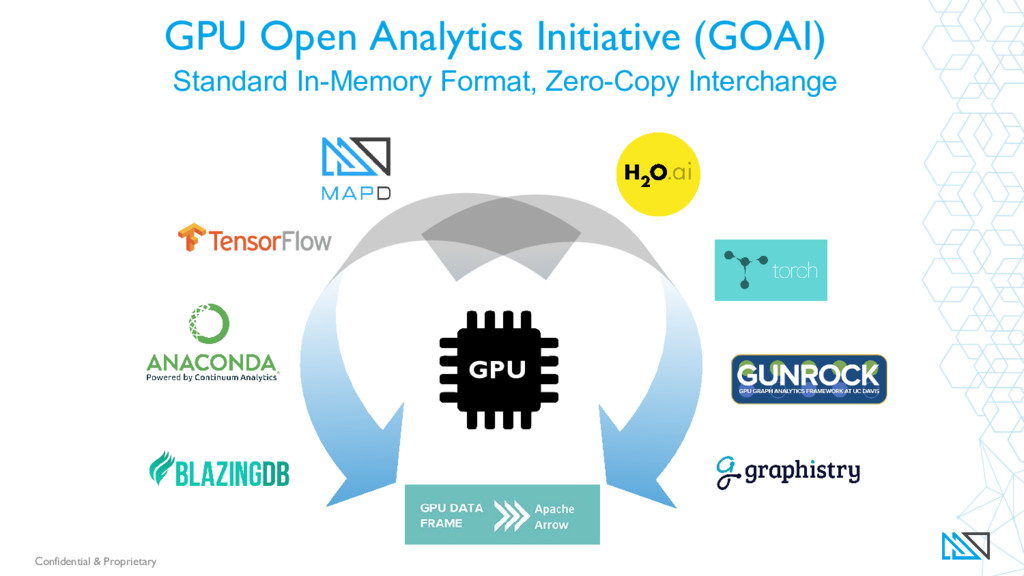
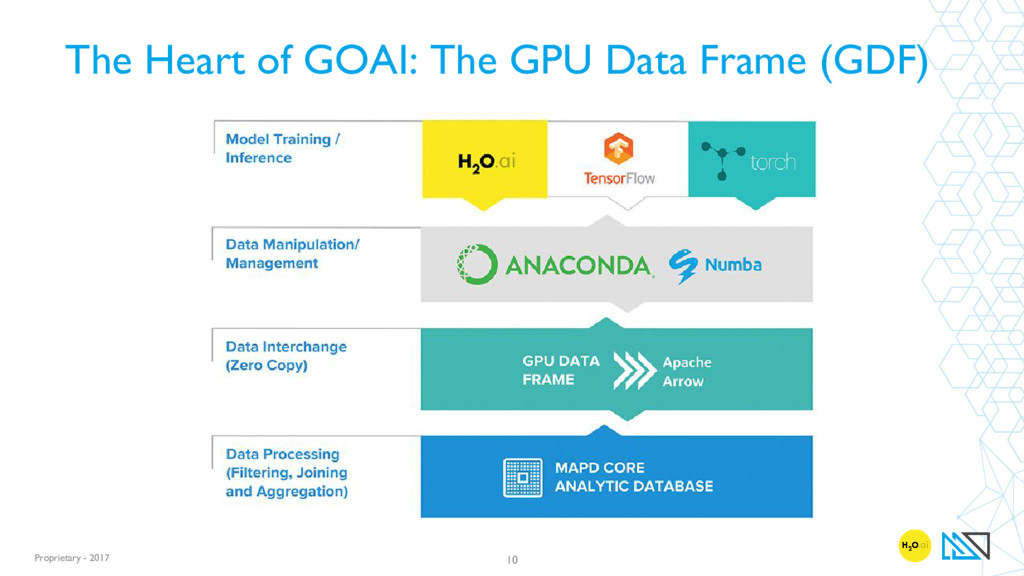
A revolution is taking place in the GPU software stack in the fields of analytics, machine learning and deep learning, driven by NVIDIA’s hardware innovation, that provides 100x more processing cores and 20x greater memory bandwidth than CPUs. However, systems and platforms are unable to harness these disruptive performance gains because they remain isolated from each other. The GPU Open Analytics Initiative (GOAI) and its first project, the GPU Data Frame (GDF) was created to allow seamless passing of data between processes.

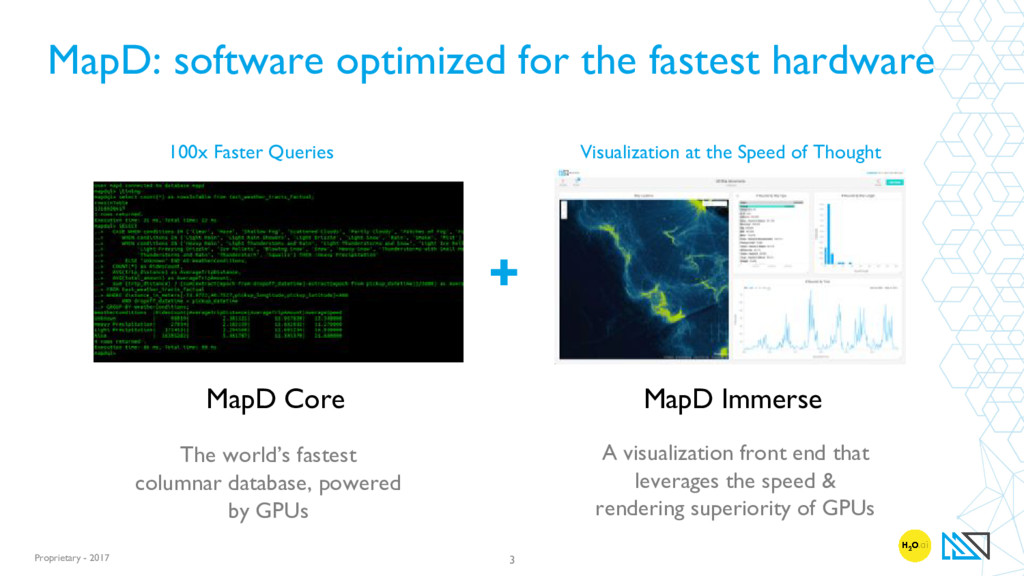
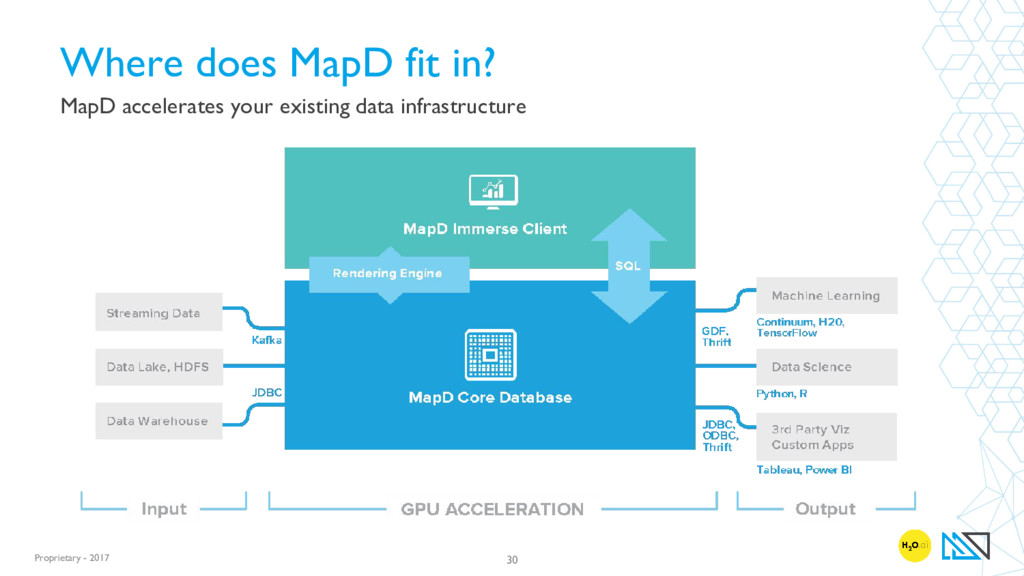
This Meetup explained how we have implemented an end-to-end machine learning powered by GOAI. We will show how GDFs break down the silos to enable interactive data exploration, model training, and model scoring, that is lightning-fast by virtue of avoiding any serialization overhead. We will demo how data scientists may use MapD to visualize billions of rows, and use it to select features interactively. We show the integration with H2O.ai to seamlessly train models and predict outcomes.

Mateusz Dymczyk, Software Engineer, H20.ai
Ashish Sahu, VP of Product, MapD

OmniSci

October 05, 2017
Tweet

More Decks by OmniSci

Other Decks in Technology

Transcript

  1. Proprietary - 2017 2 GPU Processing CPU Processing (Traditional) 39,936

    Cores Core density makes the difference 20 Cores
  2. Proprietary - 2017 3 MapD: software optimized for the fastest

    hardware + 100x Faster Queries Visualization at the Speed of Thought MapD Core MapD Immerse The world’s fastest columnar database, powered by GPUs A visualization front end that leverages the speed & rendering superiority of GPUs
  3. Proprietary - 2017 4 Confidential & Proprietary 10111010101001010110101101010101 00110101101101010101010101011101 Query

    Compilation with LLVM Traditional DBs can be highly inefficient • each operator in SQL treated as a separate function • incurs tremendous overhead and prevents vectorization MapD compiles queries w/LLVM to create one custom function • Queries run at speeds approaching hand-written functions • LLVM enables generic targeting of different architectures (GPUs, X86, ARM, etc). • Code can be generated to run query on CPU and GPU simultaneously
  4. Proprietary - 2017 Confidential & Proprietary 5 Basic charts are

    frontend rendered using D3 and other related toolkits Scatterplots, pointmaps + polygons are backend rendered using the Iris Rendering Engine on GPUs Geo-Viz is composited over a frontend rendered basemap MapD Immerse: our hybrid approach
  5. Proprietary - 2017 Blogger Mark Litwintschik benchmarked MapD on a

    billion-row taxi data set and found it to be up to orders-of-magnitude faster than the fastest CPU databases 6 Source: http://tech.marksblogg.com/benchmarks.html MapD Core: Comparative Query Acceleration* System Query 1 Query 2 Query 3 Query 4 BrytlytDB & 2-node p2.16xlarge cluster 36x 47x 25x 12x ClickHouse, Intel Core i5 4670K 49x 58x 32x 25x Redshift, 6-node ds2.8xlarge cluster 74x 24x 14x 6x BigQuery 95x 38x 6x 6x Presto, 50-node n1-standard-4 cluster 190x 75x 61x 41x Amazon Athena 305x 117x 37x 13x Elasticsearch (heavily tuned) 386x 343x n/a n/a Spark 2.1, 11 x m3.xlarge cluster w/ HDFS 485x 153x 119x 169x Presto, 10-node n1-standard-4 cluster 524x 189x 127x 61x Vertica, Intel Core i5 4670K 685x 607x 203x 132x Elasticsearch (lightly tuned) 1,642x 1,194x n/a n/a Presto, 5-node m3.xlarge cluster w/ HDFS 1,667x 735x 388x 159x Presto, 50-node m3.xlarge cluster w/ S3 2,048x 849x 164x 86x PostgreSQL 9.5 & cstore_fdw 7,238x 3,302x 1,424x 722x Spark 1.6, 5-node m3.xlarge cluster w/ S3 12,571x 5,906x 3,758x 1,884x *All speed comparisons are to the “MapD & 1 Nvidia Pascal DGX-1” benchmark MapD queries are orders of magnitude faster
  6. Proprietary - 2017 7 *All speed comparisons are to the

    “MapD & 1 Nvidia Pascal DGX-1” benchmark
  7. Proprietary - 2017 11 H2O4GPU - ML on GPUs •

    GPU acceleration to achieve up to 40x speedups vs CPU • Multi GPU - XGBoost, GLM, K-Means and more • Achieve best performance in shortest time
  8. Proprietary - 2017 12 H2O4GPU - Why ML on GPU

    *fictitious example Latency Throughput CPU 1 ns per task (1 task/ns) x (6 cores) = 6 tasks/ns GPU 10 ns per task (0.1 task per ns) x (2000 cores) = 200 task per ns Latency: Time to do a task. | Throughput: Number of tasks per unit time.
  9. Proprietary - 2017 13 H2O4GPU - Why ML on GPU

    • Matrix operations = many small operations • Highly parallelizable • Perfect for GPUs • Machine Learning algorithms heavily rely on vector/matrix operations
  10. Proprietary - 2017 15 H2O4GPU - GBM Time to Train

    and Evaluate 16 H2O XGBoost Models
  11. Proprietary - 2017 16 H2O4GPU - K-Means Time to run

    1000 Lloyds iterations for k=1000
  12. Proprietary - 2017 GPUs Interactive Machine Learning Tailored Environments &

    Personas in Data Science Lifecycle MapD Personas in Analytics Lifecycle (Illustrative) Business Analyst Data Scientist Data Engineer IT Systems Admin Data Scientist / Business Analyst H20.ai Data Preparation Data Discovery & Feature Engineering Model & Validate Predict Operationalize Monitoring & Refinement Evaluate & Decide MapD
  13. Proprietary - 2017 20 Confidential & Proprietary TELECOMMUNICATIONS Predictive Network

    Performance Customer Churn ENERGY Dynamic Oil Well Management Common use cases Powering analytics applications beyond the limits of CPUs FEDERAL Geo-analytics Cyber-security TELEMATICS Real-time fleet management Incentive-based insurance ADTECH Segmentation analytics FINANCIAL SERVICES Trading model generation Real-time Risk Fraud Anomaly Detection
  14. Proprietary - 2017 21 How is MapD being used? Verizon

    Wireless - Valuing speed and visualization How does interactive analysis with MapD Immerse allow Verizon to improve System Health? Ease & Speed of Interactivity allowed analysts to see patterns of previously unknown issues using visual data Macro view: Bird’s eye view of patterns – can see both data over 1 month vs. 1 day Individual device events: Amongst billions of events, see patterns of events and drill down to single event Note: Example MapD Immerse dashboard pictured. This is NOT representative of an actual Verizon dashboard.
  15. Proprietary - 2017 22 How is MapD being used? Simulmedia

    – Exploring Target Audience Segmentation & Ad Delivery Performance How does MapD solve Simulmedia’s analytics challenge of slow query times & ability to explore data freely? Democratizing real-time data discovery: Sales & clients team able to analyze data with their prospects & customers without the help of the engineering team Speed-of-thought interactivity: Able to zoom into different audience segments by media market without waiting for queries to run Note: Example MapD Immerse dashboard pictured. This is NOT representative of an actual Simulmedia dashboard. Running complex queries on American TV behavior & demographic data in real-time for customers to drive insights & ad-buys
  16. Proprietary - 2017 26 How is H2O.ai being used? Financial

    services Wholesale / Commercial Banking • Know Your Customers (KYC) • Anti-Money Laundering (AML) Retail Banking • Deposit Fraud • Customer Churn Prediction • Auto-Loan IT Infrastructure • Security Cyberlake • DoS Detection and Protection • Master Data Management Card/Payments Business • Transaction Frauds • Real-time Targeting • Credit Risk Scoring • In-Context Promotion
  17. Proprietary - 2017 How is MapD being used? Hedge funds

    – building trading models in real-time 31 Mining credit card transactions with MapD Core and real-time integration with research tools. A global hedge fund uses the MapD Core database to mine incoming credit card transaction data to speed the construction of trading models Performance Drives Value: More up-to-date models means more profitable trades CPUs could not scale: Redshift hit performance scaling wall