Upgrade to Pro — share decks privately, control downloads, hide ads and more …

Webinar/Oldcastle_12.05.13_Enabling Sales Throu...

Sponsored · Your Podcast. Everywhere. Effortlessly. Share. Educate. Inspire. Entertain. You do you. We'll handle the rest.
Avatar for Orchestro Orchestro
December 05, 2013

Webinar/Oldcastle_12.05.13_Enabling Sales Through Better Data... Faster

Avatar for Orchestro

Orchestro

December 05, 2013
Tweet

More Decks by Orchestro

Other Decks in Technology

Transcript

  1. Enabling Sales Through Better Data … Faster John Faeth, Vice

    President-Customer Relations/Electronic Business Process File name.pptx
  2. About Oldcastle • North America’s largest manufacturer of building products

    and materials • Largest manufacturing footprint with greatest breadth of products in all categories • Number 1 in all categories in which we compete • Retail group includes Home Depot, Lowes, Walmart • Publically traded NYSE: CRH 2 File name.pptx
  3. Oldcastle Sales Force • 150-person sales team organized regionally with

    10-12 names stores and regional leadership • Sales team is out on retail sites meeting with store managers developing relationships and promoting products and therefore have limited connectivity 3
  4. The Challenge • Internally built and maintained system was employee-dependent

    • Sales needed more agile data to share with retailers • Oldcastle has a manufacturing culture so tech resources are limited 4
  5. Selection Process • Cross-functional team included business, finance and sales

    to determine requirements and narrow to five potential vendors • High on the list of requirements were flexibility and willingness to customize reports • Needed quick integration and deployment with low impact to the organization 5
  6. Sales Enablement • POS + internal shipment data • Weekly

    reports available to sales – Download with option to do some modeling of the data (sales force has different levels of tech savvy) • Data visualization through dashboards • Create a data story for why retailers should increase orders; enable the stores to push up the chain 6
  7. POS Data $0 $100,000 $200,000 $300,000 $400,000 $500,000 $600,000 $700,000

    Calendar Week 01 Calendar Week 03 Calendar Week 05 Calendar Week 07 Calendar Week 09 Calendar Week 11 Calendar Week 13 Calendar Week 15 Calendar Week 17 Calendar Week 19 Calendar Week 21 Calendar Week 23 Calendar Week 25 Calendar Week 27 Calendar Week 29 Calendar Week 31 Calendar Week 33 Calendar Week 35 Calendar Week 37 Calendar Week 39 Calendar Week 41 Calendar Week 43 Calendar Week 45 Calendar Week 47 Calendar Week 49 Calendar Week 51 POS Sales Calendar Year 2011 POS Sales Calendar Year 2012 POS Sales Calendar Year 2013 0 200,000 400,000 600,000 800,000 1,000,000 1,200,000 Calendar Week 01 Calendar Week 03 Calendar Week 05 Calendar Week 07 Calendar Week 09 Calendar Week 11 Calendar Week 13 Calendar Week 15 Calendar Week 17 Calendar Week 19 Calendar Week 21 Calendar Week 23 Calendar Week 25 Calendar Week 27 Calendar Week 29 Calendar Week 31 Calendar Week 33 Calendar Week 35 Calendar Week 37 Calendar Week 39 Calendar Week 41 Calendar Week 43 Calendar Week 45 Calendar Week 47 Calendar Week 49 Calendar Week 51 Store OH Ea Calendar Year 2011 Store OH Ea Calendar Year 2012 Store OH Ea Calendar Year 2013 POS Qty Calendar Year 2011 POS Qty Calendar Year 2012 POS Qty Calendar Year 2013 OH Eaches vs POS QTY Last 3 Years Trending for WASHINGTON DC Market POS Sales Last 3 Years Trending for WASHINGTON DC Market 8
  8. SKU Performance 9 Top 10 SKUs YAGO Ranking vs. TY

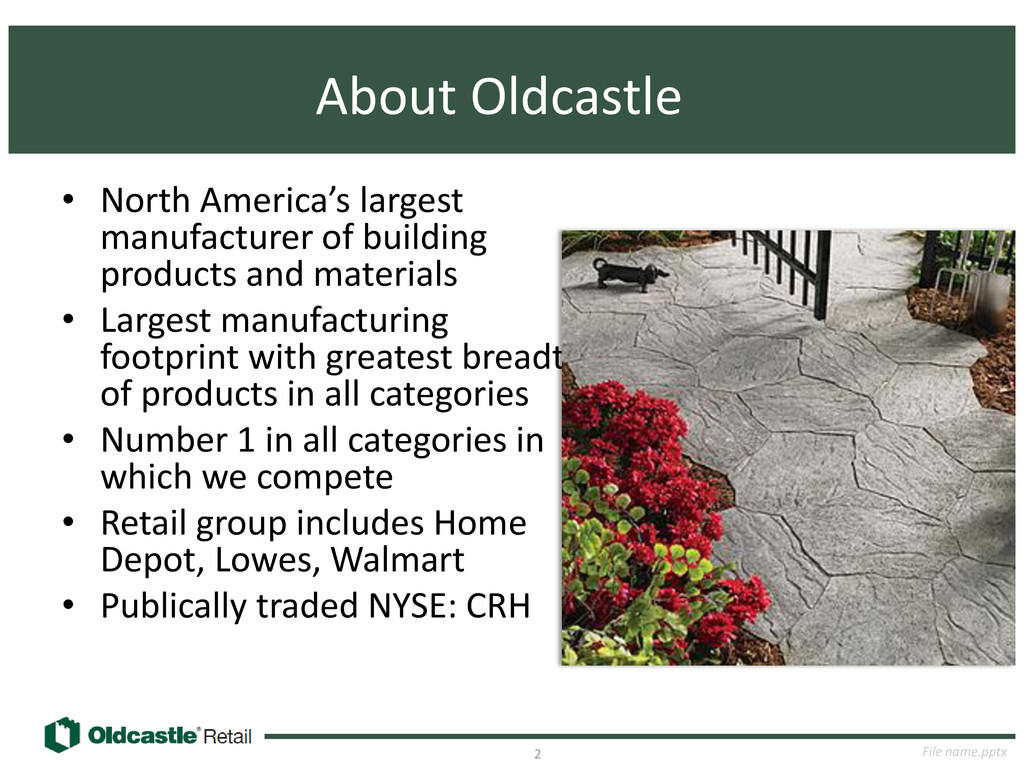
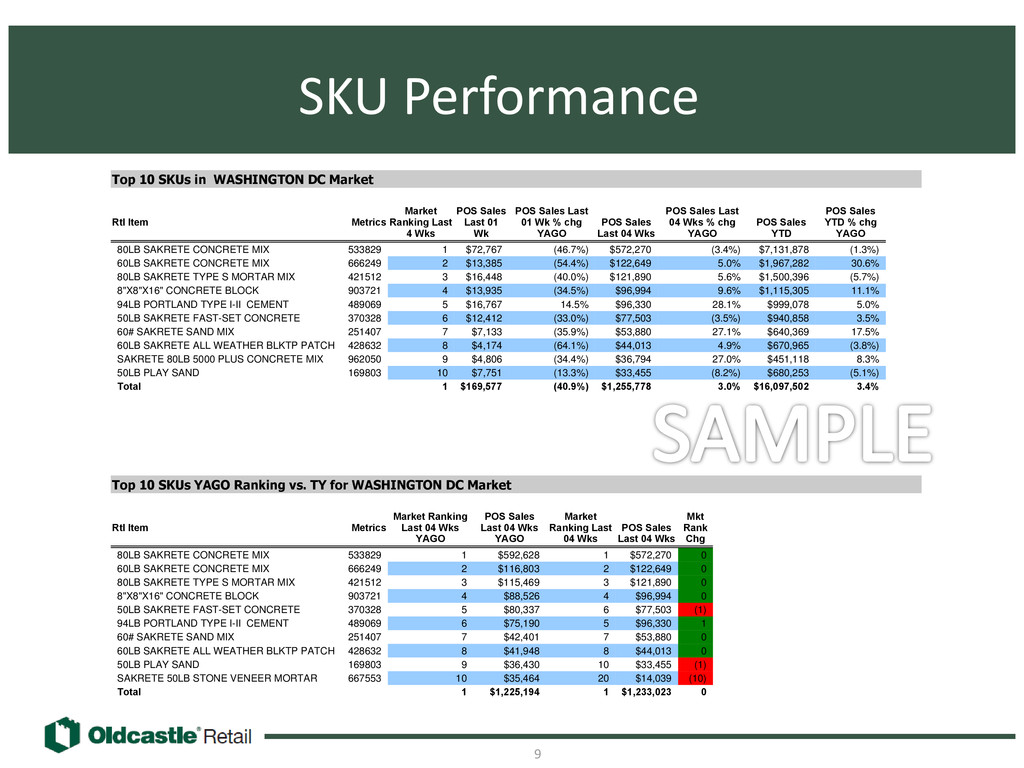
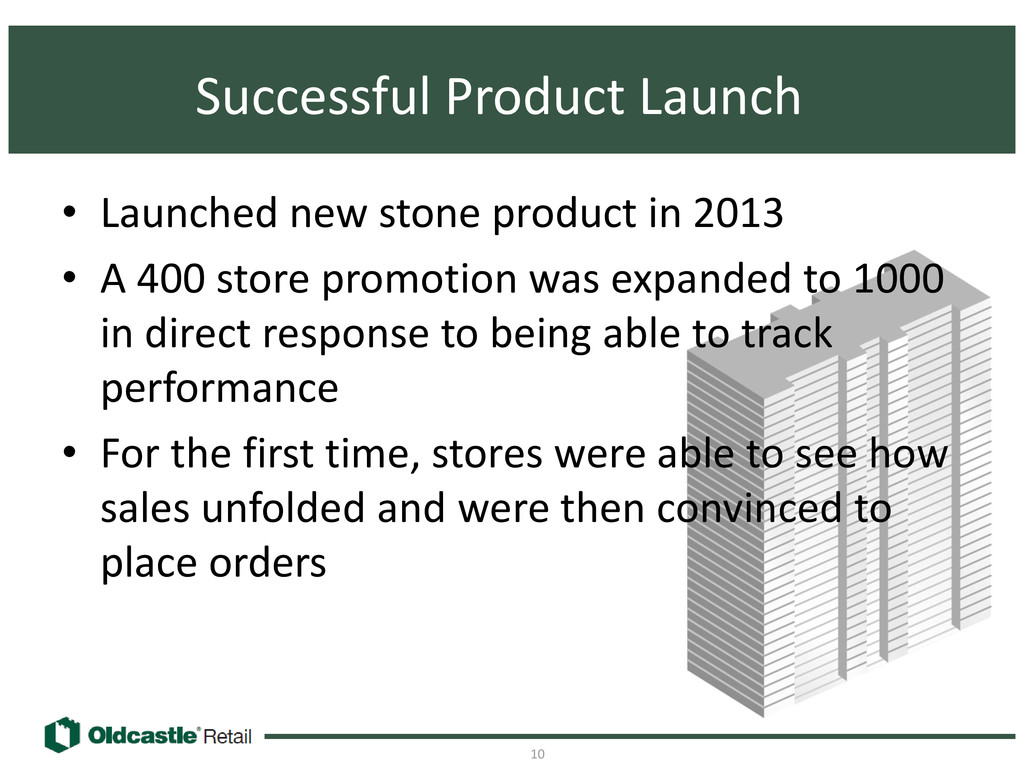
    for WASHINGTON DC Market Rtl Item Metrics Market Ranking Last 4 Wks POS Sales Last 01 Wk POS Sales Last 01 Wk % chg YAGO POS Sales Last 04 Wks POS Sales Last 04 Wks % chg YAGO POS Sales YTD POS Sales YTD % chg YAGO 80LB SAKRETE CONCRETE MIX 60LB SAKRETE CONCRETE MIX 80LB SAKRETE TYPE S MORTAR MIX 8"X8"X16" CONCRETE BLOCK 94LB PORTLAND TYPE I-II CEMENT 50LB SAKRETE FAST-SET CONCRETE 60# SAKRETE SAND MIX 60LB SAKRETE ALL WEATHER BLKTP PATCH SAKRETE 80LB 5000 PLUS CONCRETE MIX 50LB PLAY SAND Total 533829 666249 421512 903721 489069 370328 251407 428632 962050 169803 1 $72,767 (46.7%) $572,270 (3.4%) $7,131,878 (1.3%) 2 $13,385 (54.4%) $122,649 5.0% $1,967,282 30.6% 3 $16,448 (40.0%) $121,890 5.6% $1,500,396 (5.7%) 4 $13,935 (34.5%) $96,994 9.6% $1,115,305 11.1% 5 $16,767 14.5% $96,330 28.1% $999,078 5.0% 6 $12,412 (33.0%) $77,503 (3.5%) $940,858 3.5% 7 $7,133 (35.9%) $53,880 27.1% $640,369 17.5% 8 $4,174 (64.1%) $44,013 4.9% $670,965 (3.8%) 9 $4,806 (34.4%) $36,794 27.0% $451,118 8.3% 10 $7,751 (13.3%) $33,455 (8.2%) $680,253 (5.1%) 1 $169,577 (40.9%) $1,255,778 3.0% $16,097,502 3.4% Top 10 SKUs in WASHINGTON DC Market Rtl Item Metrics Market Ranking Last 04 Wks YAGO POS Sales Last 04 Wks YAGO Market Ranking Last 04 Wks POS Sales Last 04 Wks Mkt Rank Chg 80LB SAKRETE CONCRETE MIX 60LB SAKRETE CONCRETE MIX 80LB SAKRETE TYPE S MORTAR MIX 8"X8"X16" CONCRETE BLOCK 50LB SAKRETE FAST-SET CONCRETE 94LB PORTLAND TYPE I-II CEMENT 60# SAKRETE SAND MIX 60LB SAKRETE ALL WEATHER BLKTP PATCH 50LB PLAY SAND SAKRETE 50LB STONE VENEER MORTAR Total 533829 666249 421512 903721 370328 489069 251407 428632 169803 667553 1 $592,628 1 $572,270 0 2 $116,803 2 $122,649 0 3 $115,469 3 $121,890 0 4 $88,526 4 $96,994 0 5 $80,337 6 $77,503 (1) 6 $75,190 5 $96,330 1 7 $42,401 7 $53,880 0 8 $41,948 8 $44,013 0 9 $36,430 10 $33,455 (1) 10 $35,464 20 $14,039 (10) 1 $1,225,194 1 $1,233,023 0
  9. Successful Product Launch • Launched new stone product in 2013

    • A 400 store promotion was expanded to 1000 in direct response to being able to track performance • For the first time, stores were able to see how sales unfolded and were then convinced to place orders 10
  10. Measurable Results • Pushing harder on sales teams with results

    • Suggesting promotions and likely outcomes to retailers • Improved retailer relationships, more proactive partnerships • Evolved commission plans and SPIFFS 11
  11. Keys to Success • Regional Managers act on the trends

    uncovered and push sales force resulting in greater success and creativity • Communication! – Regional Managers share success stories down to teams, sideways to peers and up to management – Senior Managers are made aware of where the data comes from and the impact • Senior Management has access to interactive dashboards so they can be hands on 13
  12. Looking Forward • Deploy additional reports that will enable even

    more action in the field • Distill the feedback received on existing reports and evolve as appropriate • Review mobile app and its use by sales on location at retailers • Build and share reports internally to continue buy- in from senior management • Push to bring new ideas to the table from all sides 14