Upgrade to Pro — share decks privately, control downloads, hide ads and more …

Analysis of Websites as Graphs for SEO

Analysis of Websites as Graphs for SEO

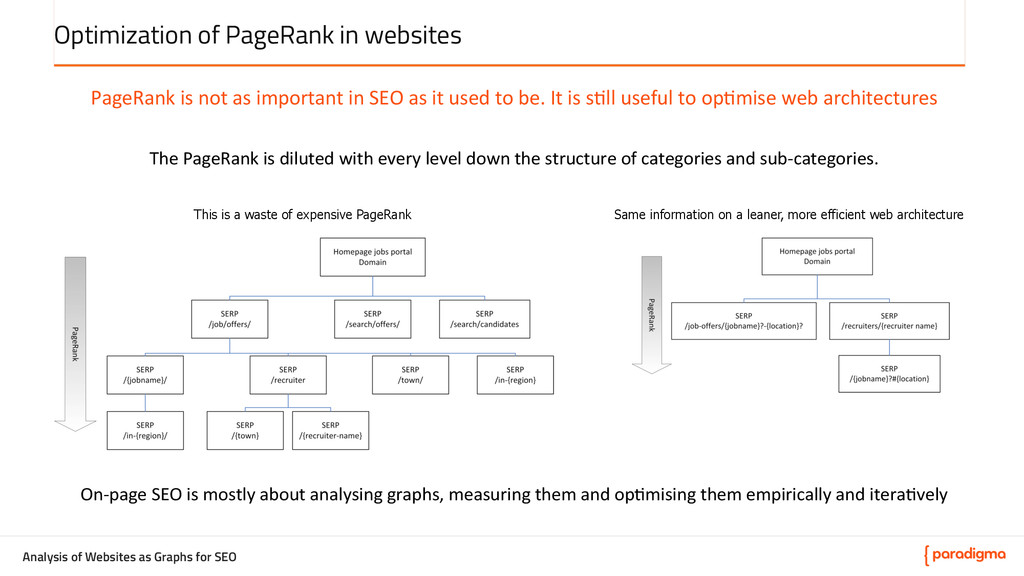
How can we use open source tools to understand complex site graphs?

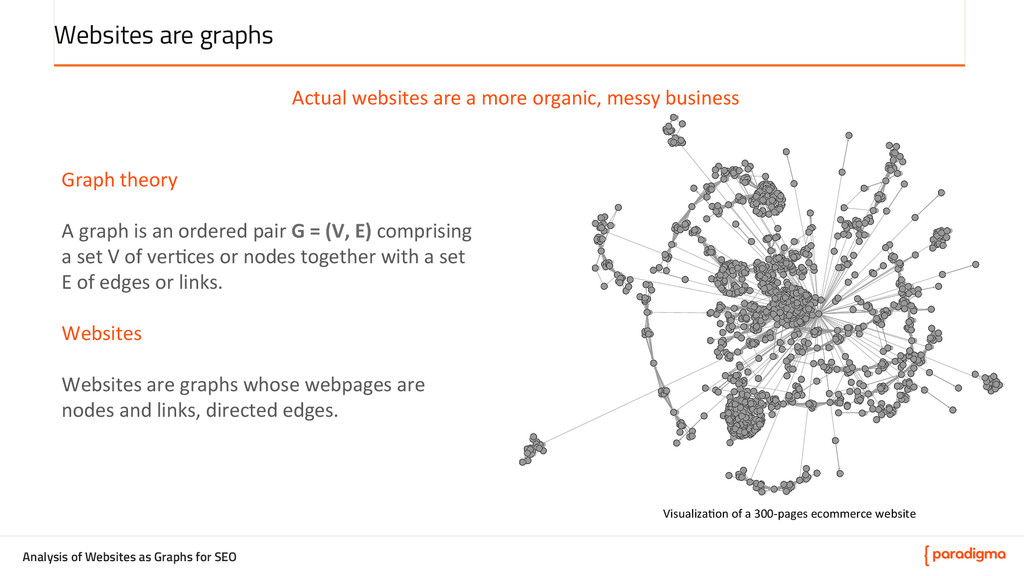
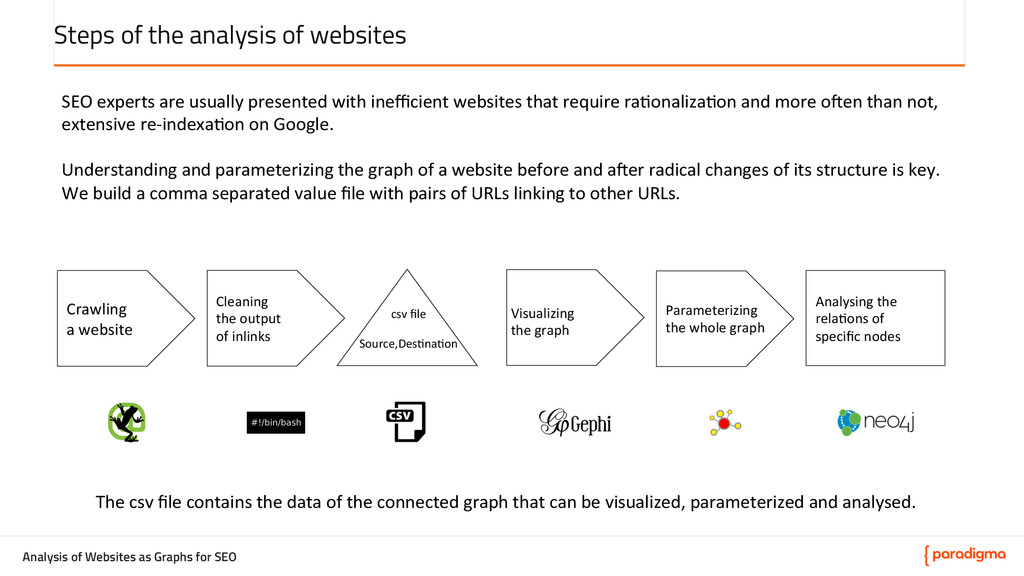
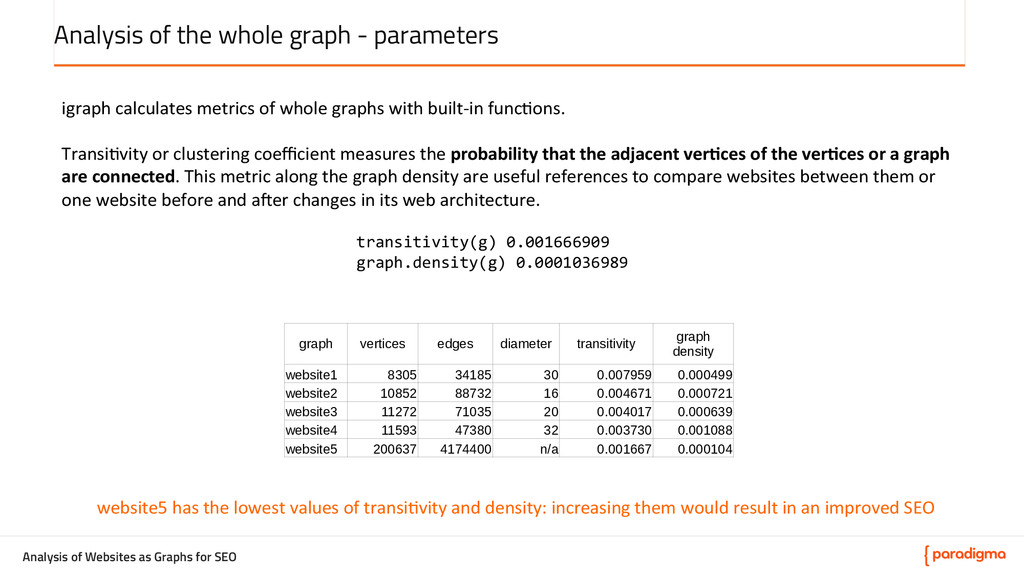
Web crawlers needs websites well connected. Large ecommerce/news websites and feed readers are graphs with hundreds of thousands of vertices (web pages) and edges (links between them). Understanding these graphs has a direct effect in usability and SEO.

Paradigma

July 10, 2015
Tweet

More Decks by Paradigma

Other Decks in Technology

Transcript

  1. Analysis of Websites as Graphs for SEO
    Analysis of Websites as Graphs for SEO
    Rubén Martínez – Junio 2015 – Open Analytics Madrid

    View Slide

  2. Analysis of Websites as Graphs for SEO
    Items  (books,  music,  etc)  used  to  be  arranged  in  5ght  silos  by  categories  

    View Slide

  3. Analysis of Websites as Graphs for SEO
    There is more to websites than meets the eye
    Has  a  website  ever  been  this  boring?  
    We  tend  to  think  of  websites  as  a  homepage  on  the  top  followed  by  a  second  layer  of  children  webpages  (categories),    
    a  third  level  below  (sub-­‐categories)  and  pages  of  items  (products,  ar5cles,  etc)  at  the  [email protected]  
    Happily,  reality  is  not  so  simple!  

    View Slide

  4. Analysis of Websites as Graphs for SEO
    First-ever website - 1990
    Source:  Tim  Berners-­‐Lee's  web  catalog  at  CERN.  
    A  copy  is  available  at  [email protected]://www.w3.org/History/19921103-­‐hypertext/hypertext/WWW/TheProject.html  
    Not  even  the  1st  ever  website  was  a  simple  hierarchical  tree  of  categories  and  sub-­‐categories  

    View Slide

  5. Analysis of Websites as Graphs for SEO
    Websites are graphs
    Graph  theory  
     
    A  graph  is  an  ordered  pair  G  =  (V,  E)  comprising  
    a  set  V  of  ver5ces  or  nodes  together  with  a  set  
    E  of  edges  or  links.  
     
    Websites  
     
    Websites  are  graphs  whose  webpages  are  
    nodes  and  links,  directed  edges.  

    Actual  websites  are  a  more  organic,  messy  business  
    Visualiza5on  of  a  300-­‐pages  ecommerce  website  

    View Slide

  6. Analysis of Websites as Graphs for SEO
    Link analysis in graph theory
    PageRank  is  a  link  analysis  algorithm.  It  outputs  a  probability  distribu;on  that  represents  the  likelihood  that  a  
    person  clicking  on  links  will  arrive  at  any  par;cular  page.  
    Google’s  reasonable  surfer  model  of  weigh5ng  of  hyperlinks  by  their  posi5on  on  the  page  
    It  assigns  a  numerical  weigh5ng  to  each  element  of  a  hyperlinked  set  of  documents,  such  as  the  World  Wide  Web,  
    with  the  purpose  of  "measuring"  its  rela5ve  importance  within  the  set.    

    View Slide

  7. Analysis of Websites as Graphs for SEO
    Optimization of PageRank in websites
    The  PageRank  is  diluted  with  every  level  down  the  structure  of  categories  and  sub-­‐categories.    
    This is a waste of expensive PageRank Same information on a leaner, more efficient web architecture
    PageRank  is  not  as  important  in  SEO  as  it  used  to  be.  It  is  s5ll  useful  to  op5mise  web  architectures  
    On-­‐page  SEO  is  mostly  about  analysing  graphs,  measuring  them  and  op5mising  them  empirically  and  itera5vely  

    View Slide

  8. Analysis of Websites as Graphs for SEO
    Steps of the analysis of websites
    Crawling  
    a  website  
    Cleaning  
    the  output  
    of  inlinks  
    csv  file  
     
    Source,Des5na5on  
    Visualizing  
    the  graph  
    Analysing  the  
    rela5ons  of  
    specific  nodes  
    Parameterizing  
    the  whole  graph  
    SEO  experts  are  usually  presented  with  inefficient  websites  that  require  ra5onaliza5on  and  more  o_en  than  not,  
    extensive  re-­‐indexa5on  on  Google.  
     
    Understanding  and  parameterizing  the  graph  of  a  website  before  and  a_er  radical  changes  of  its  structure  is  key.  
    We  build  a  comma  separated  value  file  with  pairs  of  URLs  linking  to  other  URLs.    
    The  csv  file  contains  the  data  of  the  connected  graph  that  can  be  visualized,  parameterized  and  analysed.  

    View Slide

  9. Analysis of Websites as Graphs for SEO
    Crawling and exporting a csv file of inlinks
    1st    step  –  Crawl  a  significant  sample  of  the  webpages  of  a  website  
    Desktop  applica5ons  
    •  Screaming  Frog  (fee  per  licence,  all  OS)  
    •  Xenu  Link  Sleuth  (free,  Windows)  
     
    Bash  scripts  using  command  tools    -­‐  Beware  –  poorly  [email protected]  scripts  might  not  be  polite.  
    •  CURL  
    •  Wget  
     
     
    (2nd  step  -­‐  Scrape  if  you  have  to  get  specific  snippets  of  text  from  the  crawled  pages)  
    Scrapy  in  Python  
    $  pip  install  scrapy  
     
     
    (3rd  step  Extract  data  if  you  have  to  get  specific  URLs  linked  from  the  scraped  text)  
    Beau5ful  Soup  
    A  Python  library  for  pulling  data  out  of  HTML  and  XML  files.  
     

    View Slide

  10. Analysis of Websites as Graphs for SEO
    Cleansing & grooming of the output .csv file
    Output:  csv  files  with  the  crawled  inlinks  
     
    Origin,  Des5na5on  
    URL  1,  URL  2  
    URL  2,  URL  3  
    URL  1,  URL  3  
    …  
    URL  n,  URL  m  
     
    Clean  and  filter:  best  with  bash  one-­‐liners  
     
    #!/bin/bash  
     
    FILE=  
    DOMAIN=  
     
    cut  -­‐f2,3  $FILE  |  
    sed  -­‐e  "s/http\:\/\/$DOMAIN//g"  -­‐e    "s/http\:\/\/www\."$DOMAIN"//g"  -­‐e  's/\t/,/g'  |  
    grep  –vi  "\.jpg\|http\:\|\.css\|\.js\|\.gif\|\.png\|\@\|mailto\|xml\|http\|\?\|\=“  
    >  filtered.csv  

    View Slide

  11. Analysis of Websites as Graphs for SEO
    Visualization of a website or part of it
    Gephi  is  an  interac5ve  visualiza5on  and  explora5on  plahorm  for  all  kinds  of  networks  and  complex  systems,  
    dynamic  and  hierarchical  graphs.    
     
    It  performs  poorly  with  large  graphs  (tens  of  thousands  of  nodes  and  hundreds  of  thousands  of  inlinks).  
     
     
    Other  tools?  –  promising  
     
    Key  Lines  [email protected]://keylines.com/neo4j  
     
    Tulip  [email protected]://tulip.labri.fr/TulipDrupal/  

    View Slide

  12. Analysis of Websites as Graphs for SEO
    Example 1 - Graph of the website of an annual conference
    The  home  (dark  green  node  in  the  center)  links  down  to  categories  (light  green  or  light  orange)  like  the  page  of  
    program  which  in  its  turn  links  down  to  item  pages  (dark  orange)  with  descrip5on  of  each  talk  with  bio  of  the  
    speaker,  etc.  
    This  web  architecture  seems  efficient  but  item  pages  might  be  [email protected]  connected  to  the  whole  graph  
    The  cluster  on  
    the  right  is  the  
    1st  edi5on  of  
    the  event  (few  
    talks).  
    The  cluster  on  
    the  le_  is  the  
    2nd  edi5on  of  
    the  event  
    (more  talks).  

    View Slide

  13. Analysis of Websites as Graphs for SEO
    Example 2 - Graph of the website of a shopping website
    The  orange  dots  are  products  and  green  balls  categories.  Why  do  they  ALL  connect  to  each  other?  Aren’t  there  
    products  more  relevant  to  users  and  to  the  business  than  others?  
    Some  products  get  more  
    traffic  but  yield  less  margin.  
     
    The  op5mal  web  
    architecture  overweighs  the  
    internal  linking  to  the  most  
    popular  products  with  the  
    highest  revenue  or  margin.  
    This  looks  like  a  
    programma5c  linking  
    scheme.  
     
    Ecommerce  is  usually  more  
    complex  than  it  is  
    represented  here.  


    View Slide

  14. Analysis of Websites as Graphs for SEO
    Example 3 - Graphs of 2 directly competing websites
    This  looks  like  an  organic  network  of  clusters  connec5ng  
    other  clusters  and  distant  nodes  with  thin  links.    
    This  is  a  dense  pack  of  many  webpages  connec5ng  to  many  
    other  webpages  without  discernible  [email protected]  or  clusters.  
    These  graphs  are  small  samples  of  2  large  websites  compe5ng  for  the  same  keywords  on  Google  
    Both  websites  are  successful  SEO  proposi5ons  with  radically  different  approaches.  Why?  

    View Slide

  15. Analysis of Websites as Graphs for SEO
    Thin  connec5ons  tend  to  link  the  clusters,  allowing  informa5on  to  move  between  them.    
    Source: Giles, Jim. Making the links. Nature - Aug 23rd 2012
     
     
    The power of weak links
    These  networks  are  usually  efficient  enough  in  terms  of  SEO.  

    View Slide

  16. Analysis of Websites as Graphs for SEO
    Analysis of the whole graph
    igraph  is  a  collec5on  of  network  analysis  tools  
     
    It  is  available  in  R  
     
     
    library(igraph)  
    dat=read.csv(file.choose(),header=TRUE)  #  choose  an  edgelist  in  .csv  file  
    format  
    summary(dat)  
    g=graph.data.frame(dat,directed=TRUE)  
    vcount(g)  200637  
    ecount(g)  4174400  
     
    centralization.degree(g)  0.4998589  

    View Slide

  17. Analysis of Websites as Graphs for SEO
    Analysis of the whole graph - parameters
    transitivity(g)  0.001666909  
    graph.density(g)  0.0001036989  
    igraph  calculates  metrics  of  whole  graphs  with  built-­‐in  func5ons.  
     
    Transi5vity  or  clustering  coefficient  measures  the  probability  that  the  adjacent  ver;ces  of  the  ver;ces  or  a  graph  
    are  connected.  This  metric  along  the  graph  density  are  useful  references  to  compare  websites  between  them  or  
    one  website  before  and  a_er  changes  in  its  web  architecture.    
    website5  has  the  lowest  values  of  transi5vity  and  density:  increasing  them  would  result  in  an  improved  SEO    
    Sheet1
    graph vertices edges diameter transitivity
    website1 8305 34185 30 0.007959 0.000499
    website2 10852 88732 16 0.004671 0.000721
    website3 11272 71035 20 0.004017 0.000639
    website4 11593 47380 32 0.003730 0.001088
    website5 200637 4174400 n/a 0.001667 0.000104
    graph
    density

    View Slide

  18. Analysis of Websites as Graphs for SEO
    Analysis of specific nodes
     
    [email protected]://console.neo4j.org/  
     
    MATCH  (n:Crew)-­‐[r:LOVES*]-­‐(m)  
    WHERE  n.name='Neo'  
    RETURN  n,m  


    n   m  
    (0:Crew  {name:"Neo"})   (2:Crew  {name:"Trinity"})  

    View Slide

  19. Analysis of Websites as Graphs for SEO
    Analysis of specific nodes
     
    Count  the  number  of  nodes  connected  to  one  node  
     
    MATCH  (n  {  name:  'Neo'  })-­‐-­‐>(x)  
    RETURN  n,  count(*)  


    MATCH  (n  {  name:  'Neo'  })-­‐-­‐>(x)  
    RETURN  x  
     
    (2:Crew  {name:"Trinity"})  
    (1:Crew  {name:"Morpheus"})  
    n   count(*)    
    (0:Crew  {name:"Neo"})   2

    View Slide

  20. Analysis of Websites as Graphs for SEO
    Analysis of specific nodes
    MATCH  (n:Crew)-­‐[r:KNOWS*]-­‐(m:Matrix)  WHERE  n.name='Neo'  RETURN  m  
     
    (3:Crew:Matrix  {name:"Cypher"})  
    (4:Matrix  {name:"Agent  Smith"})  
     
     
    Find  the  shortest  path  between  n  and  m  of  type  :LOVES  
     
    MATCH  p  =  shortestPath((n:Crew)-­‐[:LOVES]-­‐>(m:Matrix))  
    WHERE  n.name='Neo’  
    RETURN  p  AS  Neo,m  

    View Slide

  21. Analysis of Websites as Graphs for SEO
    That’s all Folks!
    Thank you.
    Rubén  Marqnez  
    @ruben_at_it  
    [email protected]  

    View Slide