Upgrade to Pro — share decks privately, control downloads, hide ads and more …

SETCON'19 - Kirill Sultanov - Modern BigData

SETCON'19 - Kirill Sultanov - Modern BigData

Avatar for Maksim

Maksim

May 10, 2019

More Decks by Maksim

Other Decks in Technology

Transcript

  1. Kiryl Sultanau Big Data Technical Lead at EPAM Systems ABOUT

    SPEAKERS ABOUT SPEAKERS Mr. Sultanov is a Big Data Competency Center member with 10+ years of professional experience in software development with Java and other frameworks. Near 8 years he specializes on BigData. Last couple of years he specializes on modern and complicated systems build on Azure cloud solutions. Kiryl is a person who can disassemble anything from this crazy stack and assemble it back, better than it was before. Trainer/mentor within Epam's Big Data Trainings and Architecture Excellence Initiatives.
  2. UNIFIED DATA PLATFORM SOLUTION We are confident that the combination

    of our Big Data and Data Analytics expertise, alignment with agile methodologies – including Lean Startup principles – and customer’s core corporate values makes us an ideal partner to complete this effort successfully. The main focus of the Data Platform is to provide foundation for multiple data product projects. G O A L S • Ingestion Pipelines – capture incoming messages and ingest into data lake • Data Storage – analytical persistent storage for all datasets • Operational Storage – low latency persistent layer optimized for near real time support • Exploratory Environment – elastic environment for advanced users to run advanced analyses and prototyping • Self Service for Supplier – provides scalable execution environment for various micro-services that provides access to data NUMBERS • Data Exploratory Environment (done) • Energy Star Certification (done) • Device Utilization Mailing (done) • Unified platform (done, MVP) • 3 000 000 users’ devices • 80TB in total in Data Lake • 2 parallel environments DEV & PROD • Daily changing requirements and priorities • Dozen of input sources hundreds of types and formats • Near 220 of different instances types and services
  3. UNIFIED DATA PLATFORM: TECHNOLOGY STACK Data Ingesti on Layer Data

    Storage Layer Analytics Production Layer Management Layer Exploratory Environment Azure DataLake Azure Storage Blob Job API Data API Blob Storage Cosmos DB
  4. Spark 1 • 2.3.0 on Kubernetes, Migration: 2.4.1 on Kubernetes

    3 Elassandra • Elassandra 6.2.3.13 = Elasticsearch 6.2.3 + Cassandra 3.11.3 4 Kafka • Confluent 4.1.2 (patched Kafka to 1.1.1 & zookeeper 3.4.11): Kafka + Schema registry + Kafka Connect + Kafka REST + Kafka Streams (Confluent 5.2.1 evaluation, waiting Real Kafka Operator) 2 Kubernete s • AKS (Kubernetes 1.12.7) + Virtual Kubelet + Cluster Autoscaler • ACR • ACI Hadoop • Hadoop 3.2.0 5 STACK VERSIONS: PART1
  5. Kibana 6 • Kibana 6.2.3 (Search Guard Integration) 8 Grafana

    & Prometheus • Prometheus 2.8.1 • Grafana 6.1.3 9 Livy • Livy 0.6.0-incubating (customized for Kubernetes) 7 Jupyter • Jupyter 5.7.8 (Kernels: Toree 0.3.0-incubating, Migration on: SparkMagic 0.12.7) STACK VERSIONS: PART2
  6. AKS Azure Container Service (AKS) manages your hosted Kubernetes environment,

    making it quick and easy to deploy and manage containerized applications without container orchestration expertise. It also eliminates the burden of ongoing operations and maintenance by provisioning, upgrading, and scaling resources on demand, without taking your applications offline. More info here: Azure Container Service (AKS) API Example
  7. AKS + ACI Virtual Kubelet To rapidly scale application workloads

    in an Azure Kubernetes Service (AKS) cluster, you can use virtual nodes. With virtual nodes, you have quick provisioning of pods, and only pay per second for their execution time. You don't need to wait for Kubernetes cluster autoscaler to deploy VM compute nodes to run the additional pods. Cluster Autoscaler AKS now has built-in support for scheduling containers on ACI, called virtual nodes. These virtual nodes currently support Linux container instances. Сluster luster autoscaler (CA) does this by scaling your agent nodes based on pending pods. It scans the cluster periodically to check for pending pods or empty nodes and increases the size if possible. Work Example
  8. SPARK Spark on Kubernetes Apache Spark is a fast and

    general-purpose cluster computing system. It provides high-level APIs in Java, Scala, Python and an optimized engine that supports general execution graphs. It also supports a rich set of higher-level tools including Spark SQL for SQL and structured data processing, MLlib for machine learning and Spark Streaming. More info here: Spark Overview Spark submit can be directly used to submit a Spark application to a Kubernetes cluster. The submission mechanism works as follows: • Spark creates a Spark driver running within a Kubernetes pod. • The driver creates executors which are also running within Kubernetes pods and connects to it, to execute the code. • When the application completes, the executor pods terminate and are cleanup, but the driver pod persists logs and remains in “completed” state in the Kubernetes API until it’s eventually garbage collected or manually cleaned up.
  9. SPARK ON KUBERNETES Spark Submit The entry point to trigger

    and run a Spark application on K8S is spark-submit which currently supports only cluster mode on K8S. The client mode is not supported yet, see PR-456 In-cluster client mode. Spark components on K8S: Spark Driver - this is the component where the execution of Spark application starts. It’s responsible for creating actionable tasks from the Spark application it executes; manages and coordinates the executors. Executor - the component responsible for executing tasks External Shuffle Service - used only when dynamic executor scaling is enabled. The external shuffle service is responsible for persisting shuffle files beyond the lifetime of the executors, allowing the number of executors to scale up and down without losing computation. Resource Staging Server(RSS) - only used when the compiled code of the Spark application is hosted locally on the machine where the spark-submit is issued. Spark Driver ./bin/spark-submit \ --class <main-class> \ --master k8s://https://<k8s-apiserver-host>:<k8s-apiserver-port> \ --deploy-mode cluster \ --conf <key>=<value> \ <application-jar> \ [application-arguments] If dynamic executor scaling is enabled through --conf spark.dynamicAllocation.enabled=true than external shuffle services are required too. The external shuffle services must be deployed to K8S cluster in advance in this case. Refer to Spark-on-K8S for details on how to deploy external shuffle service to K8S. This will require also the following arguments to be passed to spark- submit: --conf spark.shuffle.service.enabled=true \ --conf spark.kubernetes.shuffle.namespace=default \ --conf spark.kubernetes.shuffle.labels="<shuffle selector labels>" \ Spark Executors Executors as part of their initialization connect to the driver and pull the current config also the address of the external shuffle service that runs on the same node as the executor. As tasks drain the backend scheduler org.apache.spark.scheduler.cluster.k8s.KubernetesClusterSchedulerBacken d the driver’s backend scheduler will scale down unused executors by instructing K8S API to delete them.
  10. Features Apache Livy is a service that enables easy interaction

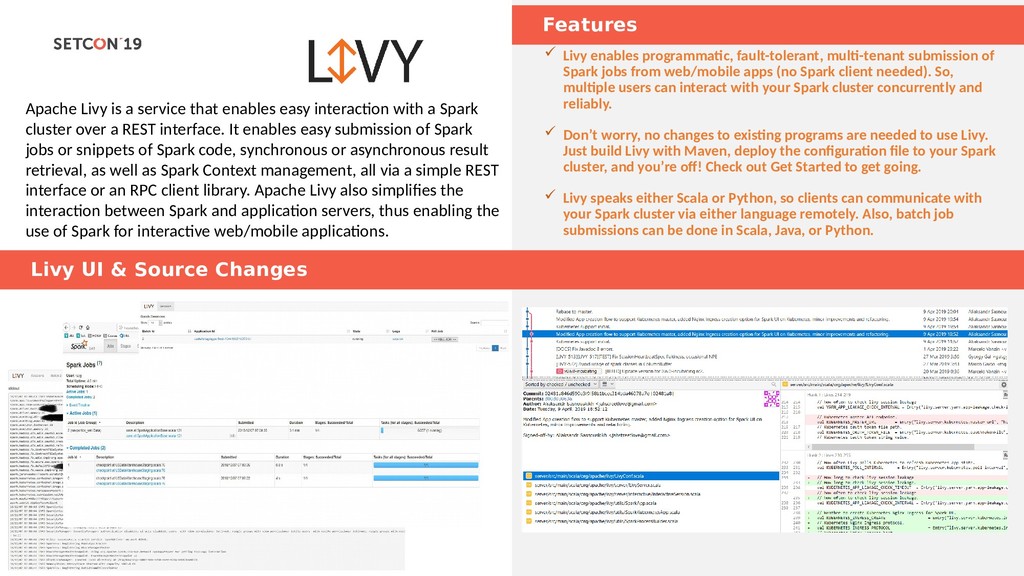
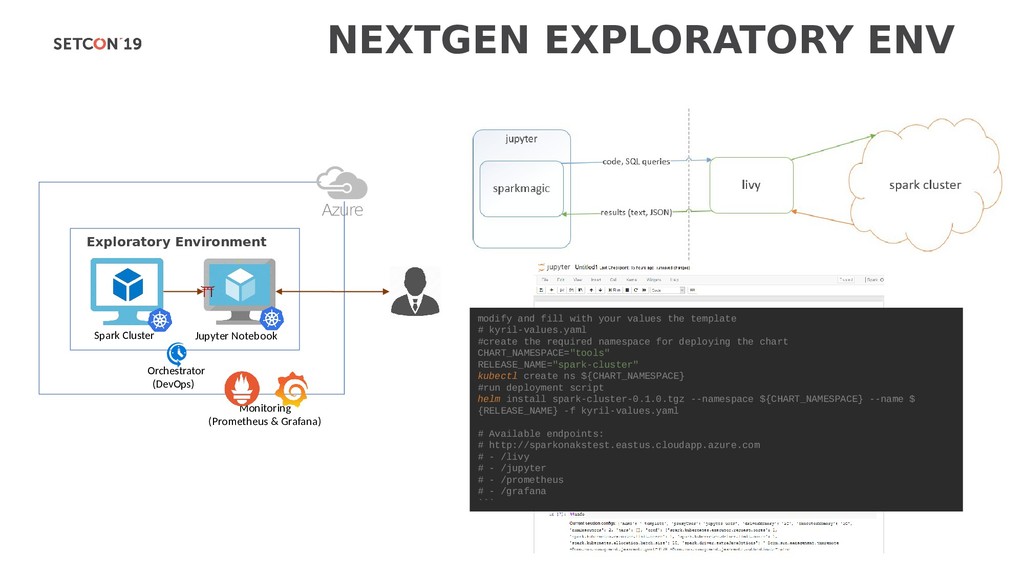
    with a Spark cluster over a REST interface. It enables easy submission of Spark jobs or snippets of Spark code, synchronous or asynchronous result retrieval, as well as Spark Context management, all via a simple REST interface or an RPC client library. Apache Livy also simplifies the interaction between Spark and application servers, thus enabling the use of Spark for interactive web/mobile applications.  Livy enables programmatic, fault-tolerant, multi-tenant submission of Spark jobs from web/mobile apps (no Spark client needed). So, multiple users can interact with your Spark cluster concurrently and reliably.  Don’t worry, no changes to existing programs are needed to use Livy. Just build Livy with Maven, deploy the configuration file to your Spark cluster, and you’re off! Check out Get Started to get going.  Livy speaks either Scala or Python, so clients can communicate with your Spark cluster via either language remotely. Also, batch job submissions can be done in Scala, Java, or Python. Livy UI & Source Changes
  11. SPARK INTERESTING PROPERTIES  .config("spark.driver.memory", “16g")  .config("spark.executor.memory", “4g") 

    .config("spark.driver.maxResultSize", “8g")  .config("spark.speculation", "true")  .config("spark.speculation.multiplier", "7.0")  .config("spark.speculation.quantile", "0.60")  .config("spark.sql.shuffle.partitions", "2080")  .config("spark.serializer", "org.apache.spark.serializer.KryoSerializer")  .config("spark.kryo.unsafe", "false")  .config("spark.kryo.registrationRequired", "false")  .config("spark.network.timeout", "800")  .config("spark.sql.warehouse.dir", "/opt/spark/spark/spark-warehouse")  .config("spark.sql.parquet.mergeSchema", false)  spark.read.schema(schema).parquet(s"$rootPath/ PartitionDateKey=$d"))  coalesce and repartition (repartition algorithm does a full shuffle of the data and creates equal sized partitions of data. coalesce combines existing partitions to avoid a full shuffle)
  12. KAFKA Our Confluent Platform Release 4.1.2 Kafka® is used for

    building real-time data pipelines and streaming apps. It is horizontally scalable, fault-tolerant, wicked fast, and runs in production in world wide. More info here: Kafka Introduction This is a major release of the Confluent Platform that provides Confluent users with Apache Kafka 1.1.1, the stable version of Kafka. Confluent Platform Architecture confluentinc/cp- kafka:4.1.2 confluentinc/cp- kafka-stream:4.1.2 confluentinc/cp- kafka-connect:4.1.2 confluentinc/cp- kafka-rest:4.1.2 confluentinc/cp- schema- registry:4.1.2 confluentinc/cp- zookeeper:4.1.2
  13. STORAGE FOR KAFKA  Unmanaged Disks (VHD legacy with Storage

    Account)  Premium Disks: SSD based, provisioned performance  Standard Disks: HDD based, cost effective  Managed Disks: highly available & manageable  Unmanaged Disks: VHD legacy with Storage Account Azure Storage Options From Kubernetes 1.9 release, SIG Storage made Kubernetes more pluggable and modular by introducing an alpha implementation of the Container Storage Interface (CSI). CSI will make installing new volume plugins as easy as deploying a pod.
  14. KAFKA OPERATOR SOLUTION Confluent Operator automates provisioning, management and operations

    of Confluent Platform using the Kubernetes Operator API. It operationalizes years of experience acquired by Confluent delivering Confluent Platform as a fully-managed service on the leading public clouds with Confluent Cloud. Automated Provisioning Configuration for Confluent Platform clusters to achieve zero-touch provisioning. Deployment of clusters across multiple racks or az. Integration with Persistent Volume Claims to store data either on local disk or network attached storage. Cluster Management and Operations Automated rolling update of the Confluent Platform clusters Elastic scaling of Kafka clusters up or down by updating cluster configuration. Automated data balancing to distribute replicas evenly across all brokers in a Kafka cluster. Resiliency Restoration of a Kafka node to a pod with the same broker id, when a Kafka pod dies Monitoring End-to-end data SLA monitoring with Control Center Exposes Prometheus metrics for and monitoring
  15. KAFKA BEST PRACTICES  Once the JVM size is determined

    leave rest of the RAM to OS for page caching. You need sufficient memory for page cache to buffer for the active writers and readers.  We recommend using multiple drives to get good throughput. Do not share the same drives with any other application or for kafka application logs.  We recommend EXT4 or XFS. Recent improvements to the XFS file system have shown it to have the better performance characteristics for Kafka’s workload without any compromise in stability.  Do not co-locate zookeeper on the same boxes as Kafka  If throughput is less than network capacity, try the following: Add more threads; Increase batch size; Add more producer instances; Add more partitions  To improve latency when acks =-1, increase your num.replica.fetches value.  For cross-AZ data transfer, tune your buffer settings for sockets and for OS TCP.  Make sure that num.io.threads is greater than the number of disks dedicated for Kafka.  Adjust num.network.threads based on the number of producers plus the number of consumers plus the replication factor.  Your message size affects your network bandwidth. To get higher performance from a Kafka cluster, select an instance type that offers best network performance.  Minimize GC pauses by using the Oracle JDK, which uses the new G1 garbage-first collector.  Try to keep the Kafka heap size below 4 GB.
  16. PERFORMANCE ANALYSIS: HTRACE-ZIPKIN Htrace-zipkin library uses scribe transport framework which

    requires zipkin hostname and port as configuration parameters. In addition to that, sampler class must be configured which defines how often the spans are outputted: Code Trace: Hadoop Configuration:
  17. PERFORMANCE ANALYSIS: GCEASY Industry's first machine learning guided Garbage collection

    log analysis tool. GCeasy has in-built intelligence to auto-detect problems in the JVM & Android GC logs and recommend solutions to it. Code Trace: Hadoop Configuration:
  18. PERFORMANCE ANALYSIS: FLAMEGRAPH Spark applications run on a cluster, and

    computation is split up into different executors (on different machines), each running their own processes, profiling such an application is trickier than profiling a simple application running on a single JVM. We need to capture stack traces on each executor’s process and collect them to a single place in order to compute Flame Graphs for our application. Profiling Architecture:
  19. UNIFIED DATA PLATFORM: SYSTEM EVOLUTION Data Lake Storage Processed Data

    Production Pipelines Operational Storage Rest API Spark Clusters Ingestion Pipelines Monitoring (Prometheus & Grafana) IoT API Device Service JSON / Binary Data Spark Cluster Jupyter Notebook Orchestrator (Jenkins) Exploratory Environment Kafka REST Proxy Ingesti on Topics (Kafka) Blob Storage RAW data Kibana Elassandra Kafka REST Proxy Kafka Connect Kafka Connect Prepar ed Topic (Kafka) Kafka Streams EventHub Azure Spark Clusters Job Pipelines Suppliers Self Service Blob Storage Jobs data Cosmos DB Meta info Orchestrator (Livy)
  20. NEXTGEN EXPLORATORY ENV Monitoring (Prometheus & Grafana) Spark Cluster Jupyter

    Notebook Orchestrator (DevOps) Exploratory Environment Azure modify and fill with your values the template # kyril-values.yaml #create the required namespace for deploying the chart CHART_NAMESPACE="tools" RELEASE_NAME="spark-cluster" kubectl create ns ${CHART_NAMESPACE} #run deployment script helm install spark-cluster-0.1.0.tgz --namespace ${CHART_NAMESPACE} --name $ {RELEASE_NAME} -f kyril-values.yaml # Available endpoints: # http://sparkonakstest.eastus.cloudapp.azure.com # - /livy # - /jupyter # - /prometheus # - /grafana ```
  21. NextGen HDInsight Startup/Tear-down time 5-9 min 30-45 min Up/Down scaling

    time 2-5 min (auto) 20-40 min (manual) Execution Time 85% 100% Costs per month 100 nodes (DS3v2) 19000 $ (60%) 32500 $ (100%) NEXTGEN vs HDInsight
  22. PROMETHEUS / GRAFANA / DROPWIZARD Operational Metrics This is a

    leading toolset for visualizing time series infrastructure and application metrics, but many use it in other domains including industrial sensors, home automation, weather, and process control. It provides a powerful and elegant way to create, explore, and share dashboards and data with your team and the world. • We collect operational metrics about all the components of solution and create dashboards from them. • This presentation details the components involved in collecting, storing and displaying the metrics.
  23. Prometheus is a Time series database (TSDB). It stores all

    data as streams of timestamped values. The metric name specifies the general feature of a system that is measured Prometheus uses pull model – it has list of targets services endpoints and constantly polls them for their current state, and records what it gets back. The targets are supposed to respond to these HTTP requests with data in the Prometheus format. Targets Node information The node_exporter exports information about each node we run - CPU usage, memory left, disk space, etc. It provides fairly detailed info, usually prefixed with node_. This is not kubernetes specific. Kubernetes information kube-state-metrics exposes information about the kubernetes cluster - such as number of pods and the states they are in, number of nodes, etc. These are usually prefixed with kube_. Services information Exports information about each streaming service like Spark Streaming Job or Kafka Streams
  24. Grafana is an open source, feature rich metrics dashboard and

    graph editor for Prometheus. A dashboard is a set of pre- defined graphs in a layout that provide an overview of a system. In our case, they provide an overview of the operational metrics of the cluster components.
  25. KAFKA BROKERS MONITORING We are using Apache Kafka for handling

    incoming data and building real-time data pipeline.  Retention: How much data can we store on disk for each topic partition?  Replication: How many copies of the data can we make?  Consumer Lag: How do we monitor how far behind our consumer applications are from the producers?  CPU/RAM consumption: Performance and resource planning  GC Metrics General Metrics: Kafka Metrics:
  26. KAFKA REST PROXY MONITORING  The average number of HTTP

    requests and responses per second.  The average number of requests per second that resulted in HTTP error responses  The average packet size in bytes These metrics help us to recognize the problems with incoming data and scale Kafka Rest properly Rest Metrics (JMX Exporter):
  27. KAFKA STREAMS MONITORING  The average execution time in ms,

    for the respective operation, across all running tasks of this thread.  The average number of respective operations per second across all tasks.  The average number of newly created tasks per second.  The average number of tasks closed per second.  The average number of skipped records per second. This metric helps monitor if the rate of record consumption and rate of record processing are equal or not. Streams Metrics (JMX Exporter):
  28. ALERTRING Consumer Lag tells us how far behind each Consumer

    (Group) is in each Partition. The smaller the lag the more real-time the data consumption. If lag increases Alertmanager will fire alert so operation team can handle that event before Kafka become completely overwhelmed. Alerting with Prometheus is separated into two parts. Alerting rules in Prometheus servers send alerts to an Alertmanager. The Alertmanager handles alerts sent by Prometheus. It takes care of deduplicating, grouping, and routing them to the correct receiver integration such as email. Slack Alerting Kakfa Consumer Lag
  29. SPARK STREAMING MONITORING  We want to control spark streaming

    jobs running inside Kubernetes cluster using existed Prometheus Operator.  Spark can't export metrics in Prometheus format. The workaround is to use graphite metrics and map these metrics with graphite_exporter.
  30. SPARK DATA LINEAGE Spline Lineage Spline should fill a big

    gap within Big Data ecosystem. Spark jobs shouldn't be treated only as magic black boxes and people should have a chance to understand what happens with their data. Spline focus is to solve such kind of problems. Spline Atlas Integration (restore from v0.3.6)