Upgrade to Pro — share decks privately, control downloads, hide ads and more …

Java’s neuer CPU-Time Profiler (JUG Karlsruhe)

Java’s neuer CPU-Time Profiler (JUG Karlsruhe)

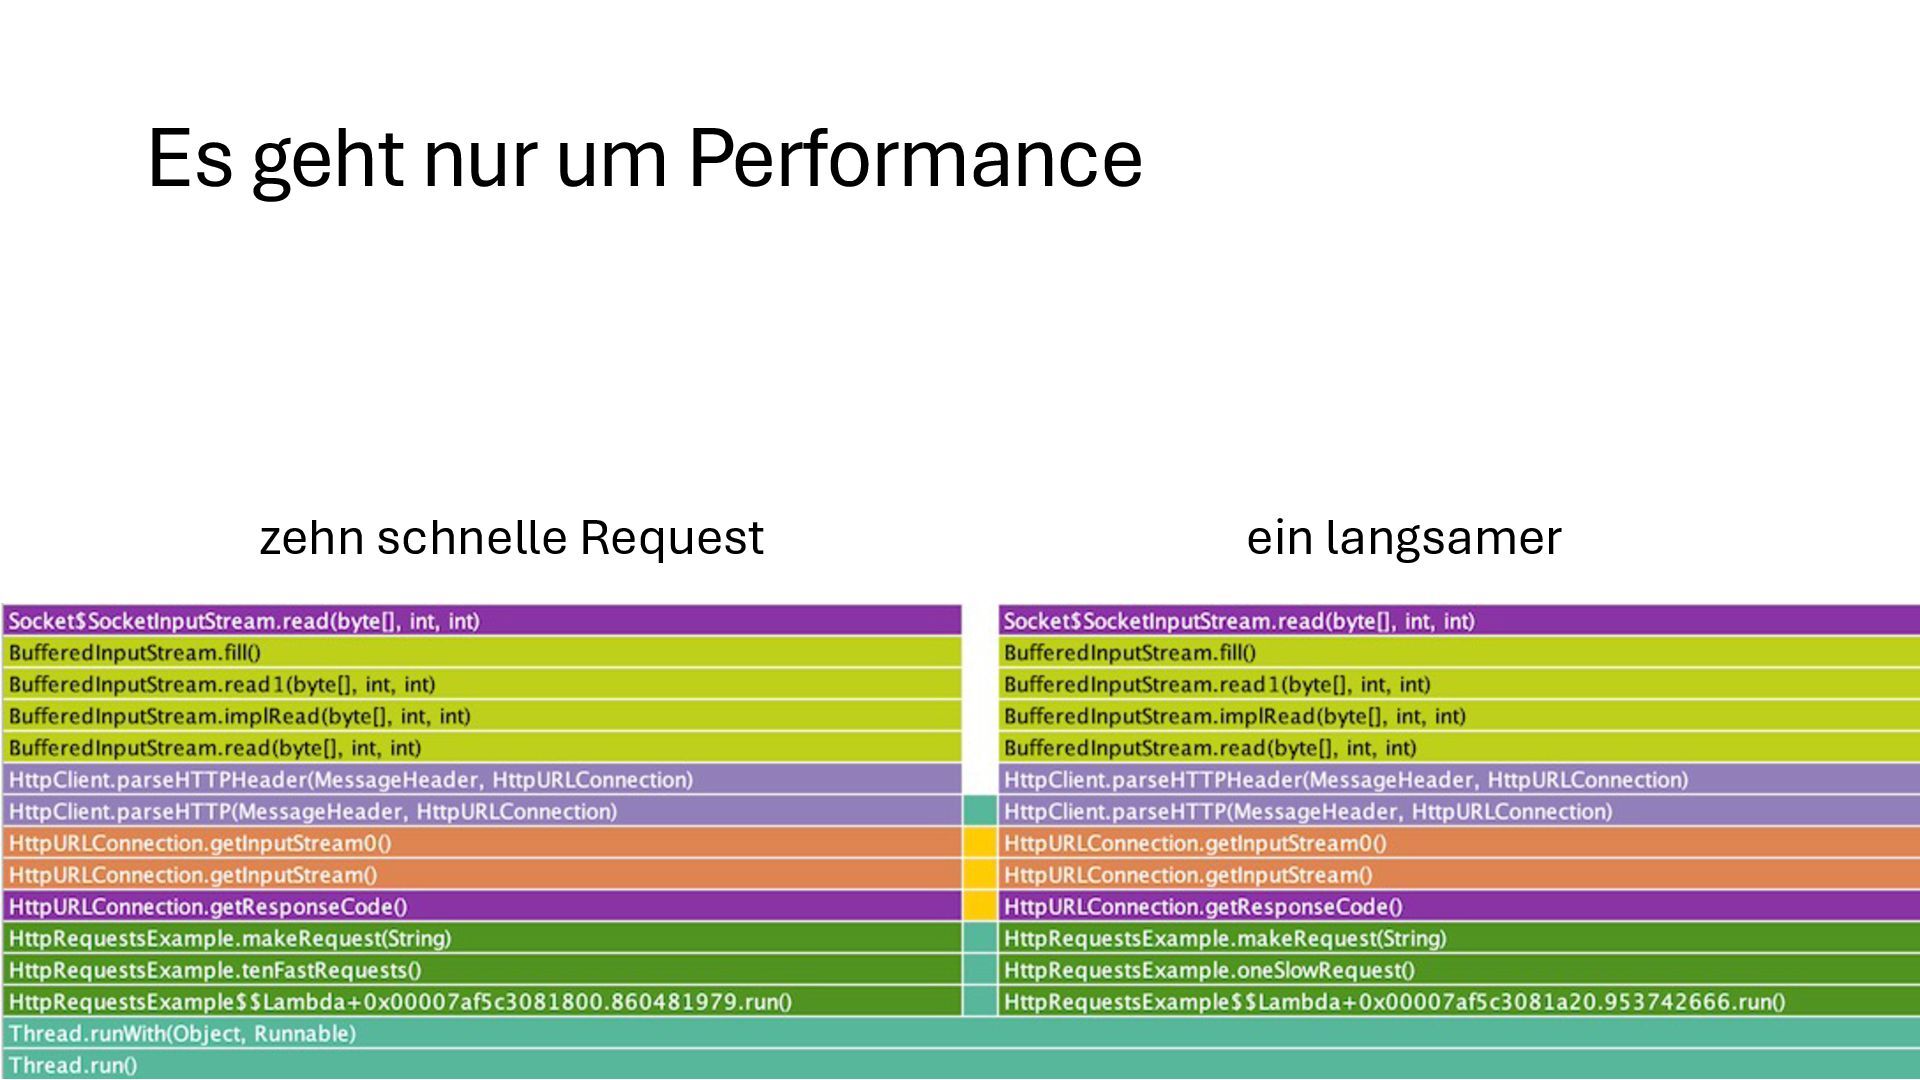
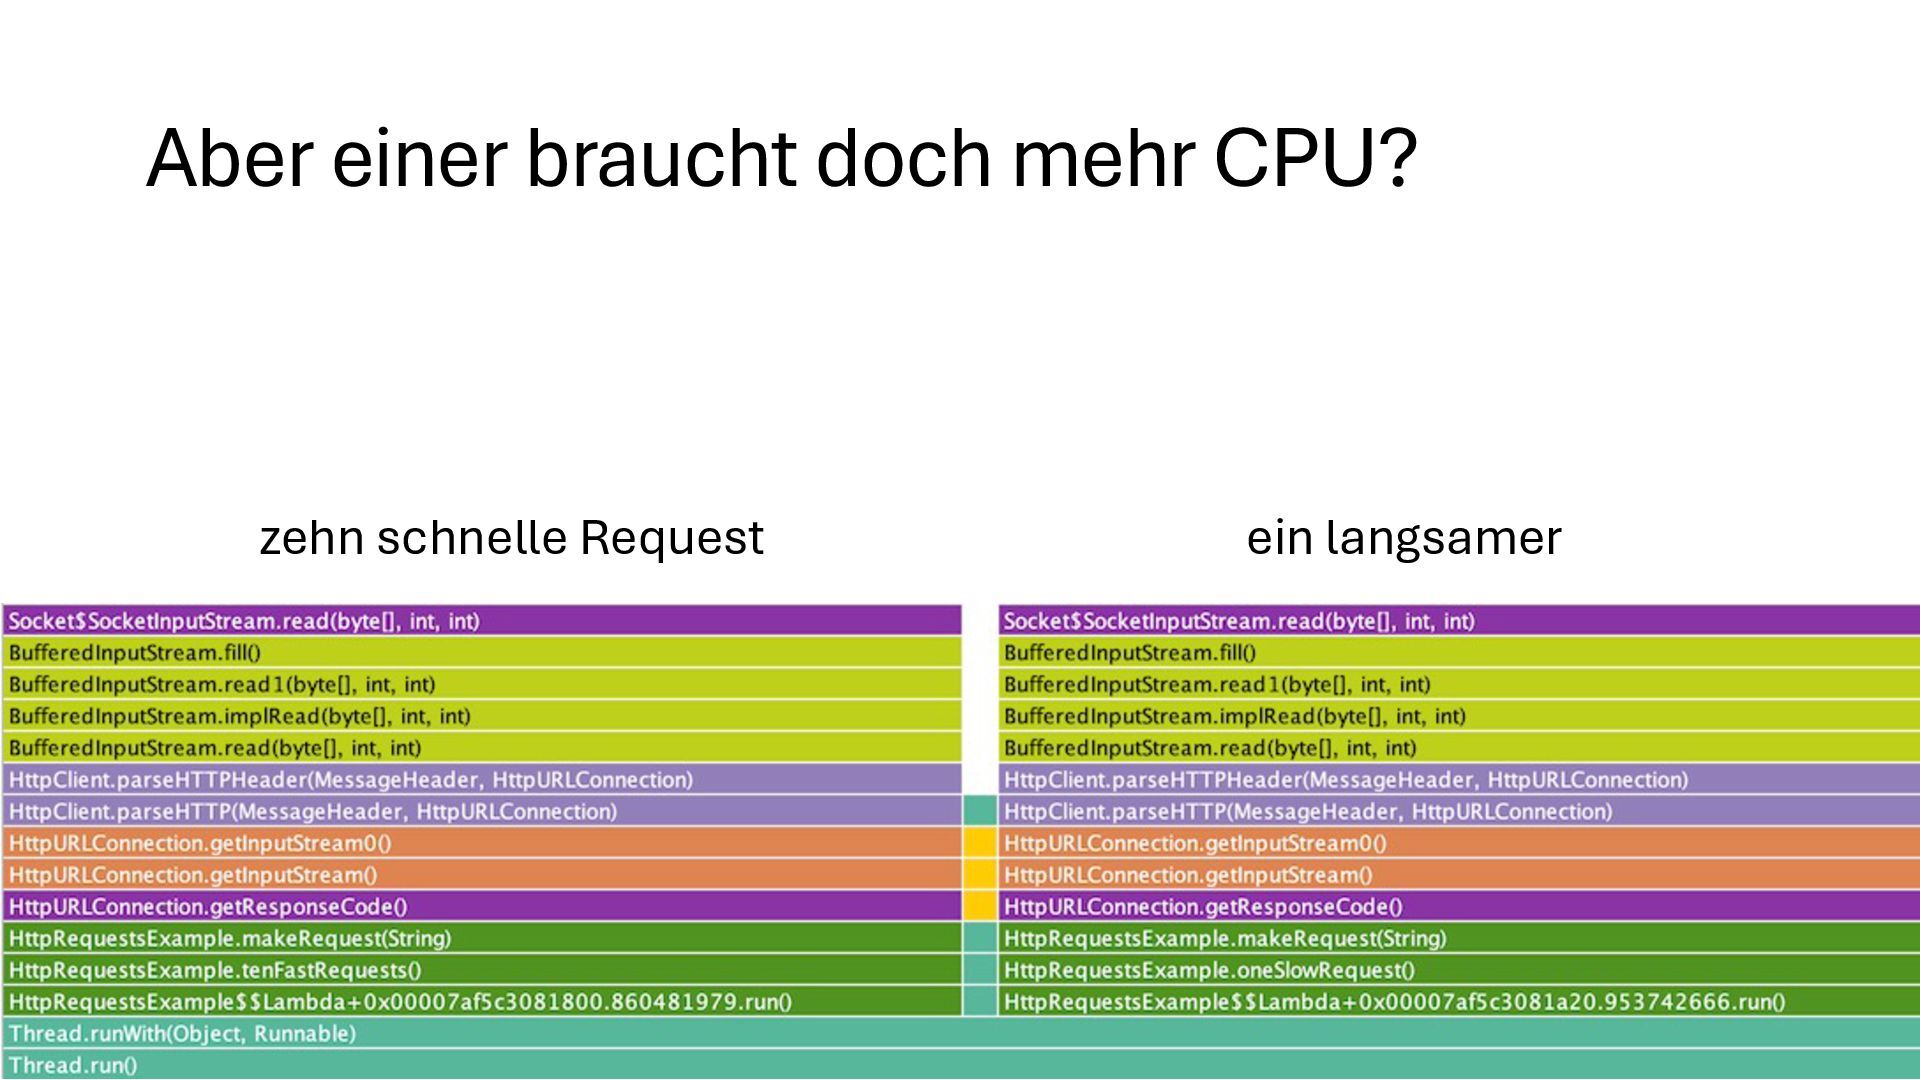
Wenn deine Java-Anwendung langsam ist, solltest du einen Java-Profiler einsetzen. Vor JDK 25 erlaubte der eingebaute Java-Profiler allerdings nur Profiling basierend auf der Ausführungszeit, nicht auf der CPU-Zeit, und das ist nicht dasselbe. Eine Methode, die auf I/O blockiert, und eine, die rechenintensiv arbeitet, können gleich aussehen … es sei denn, du nutzt CPU-time profiling, das dir zeigt, was deine CPU wirklich auslastet.

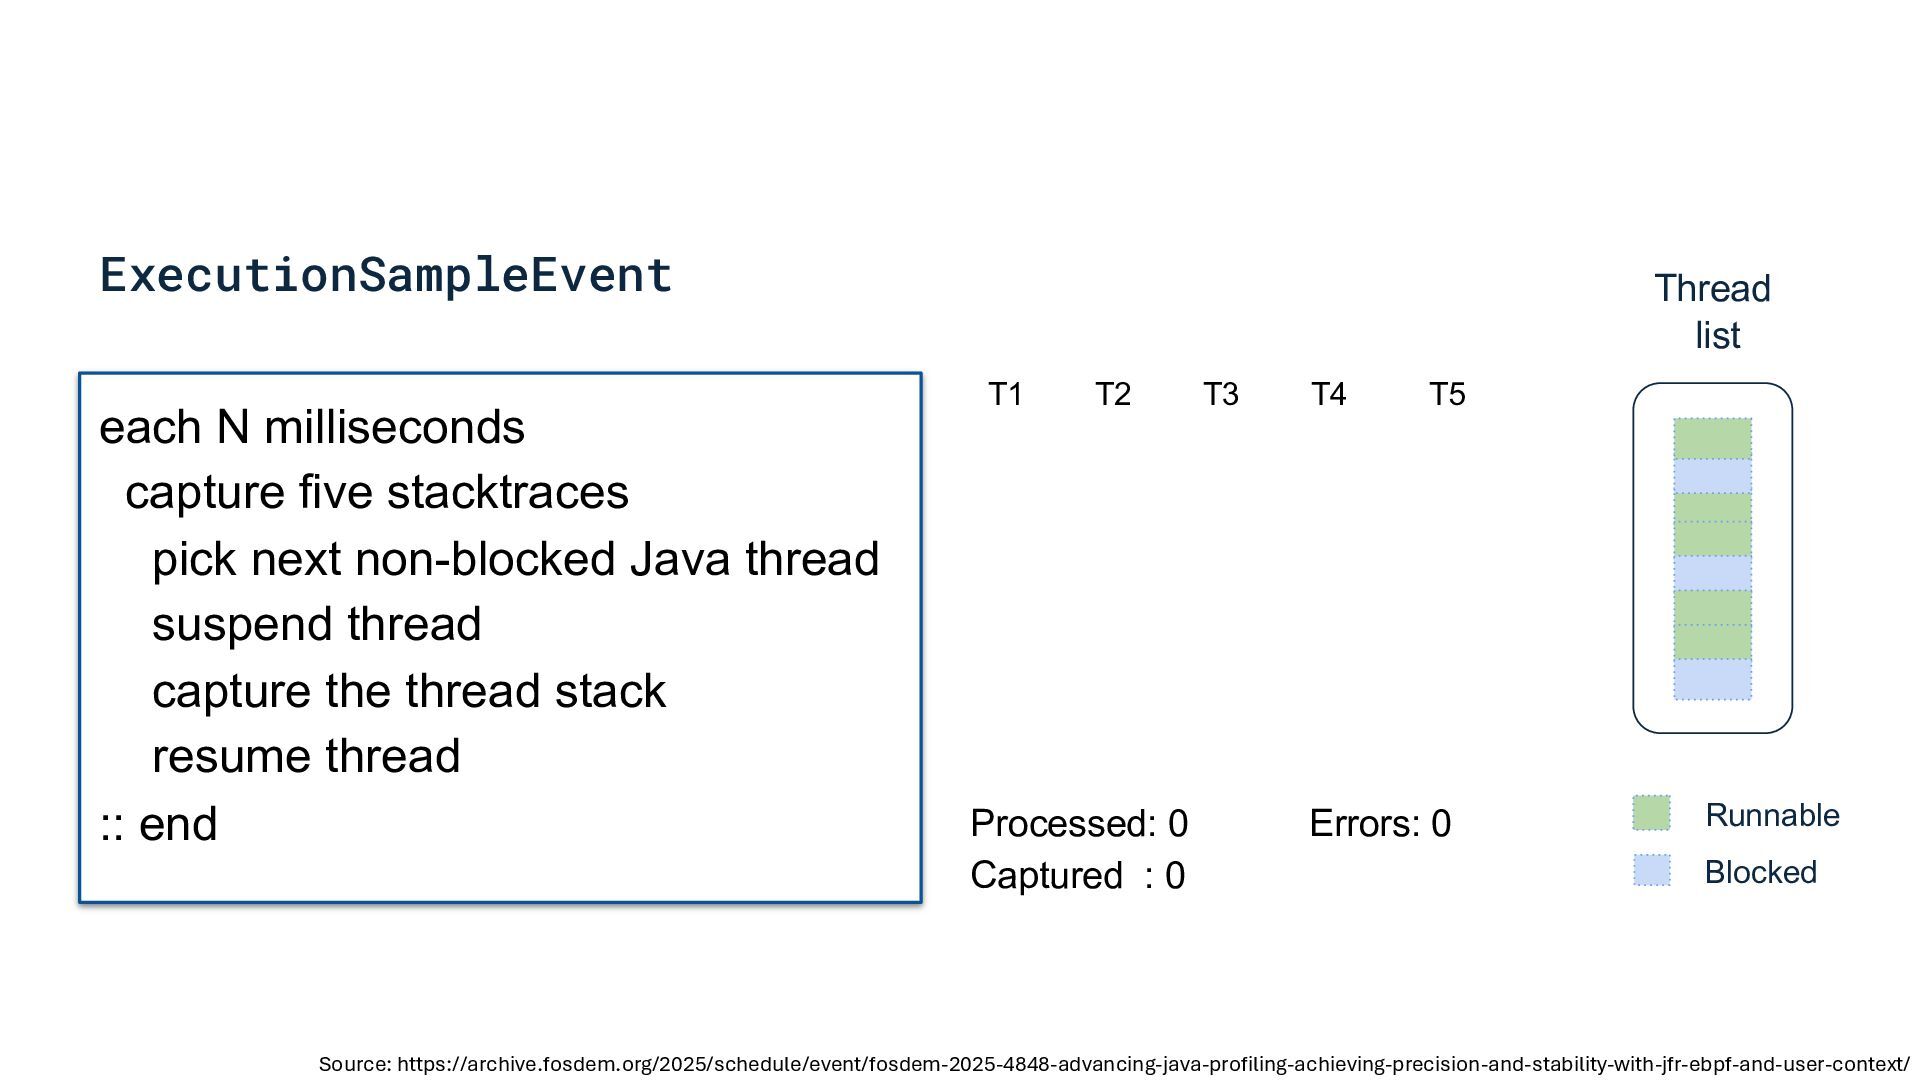
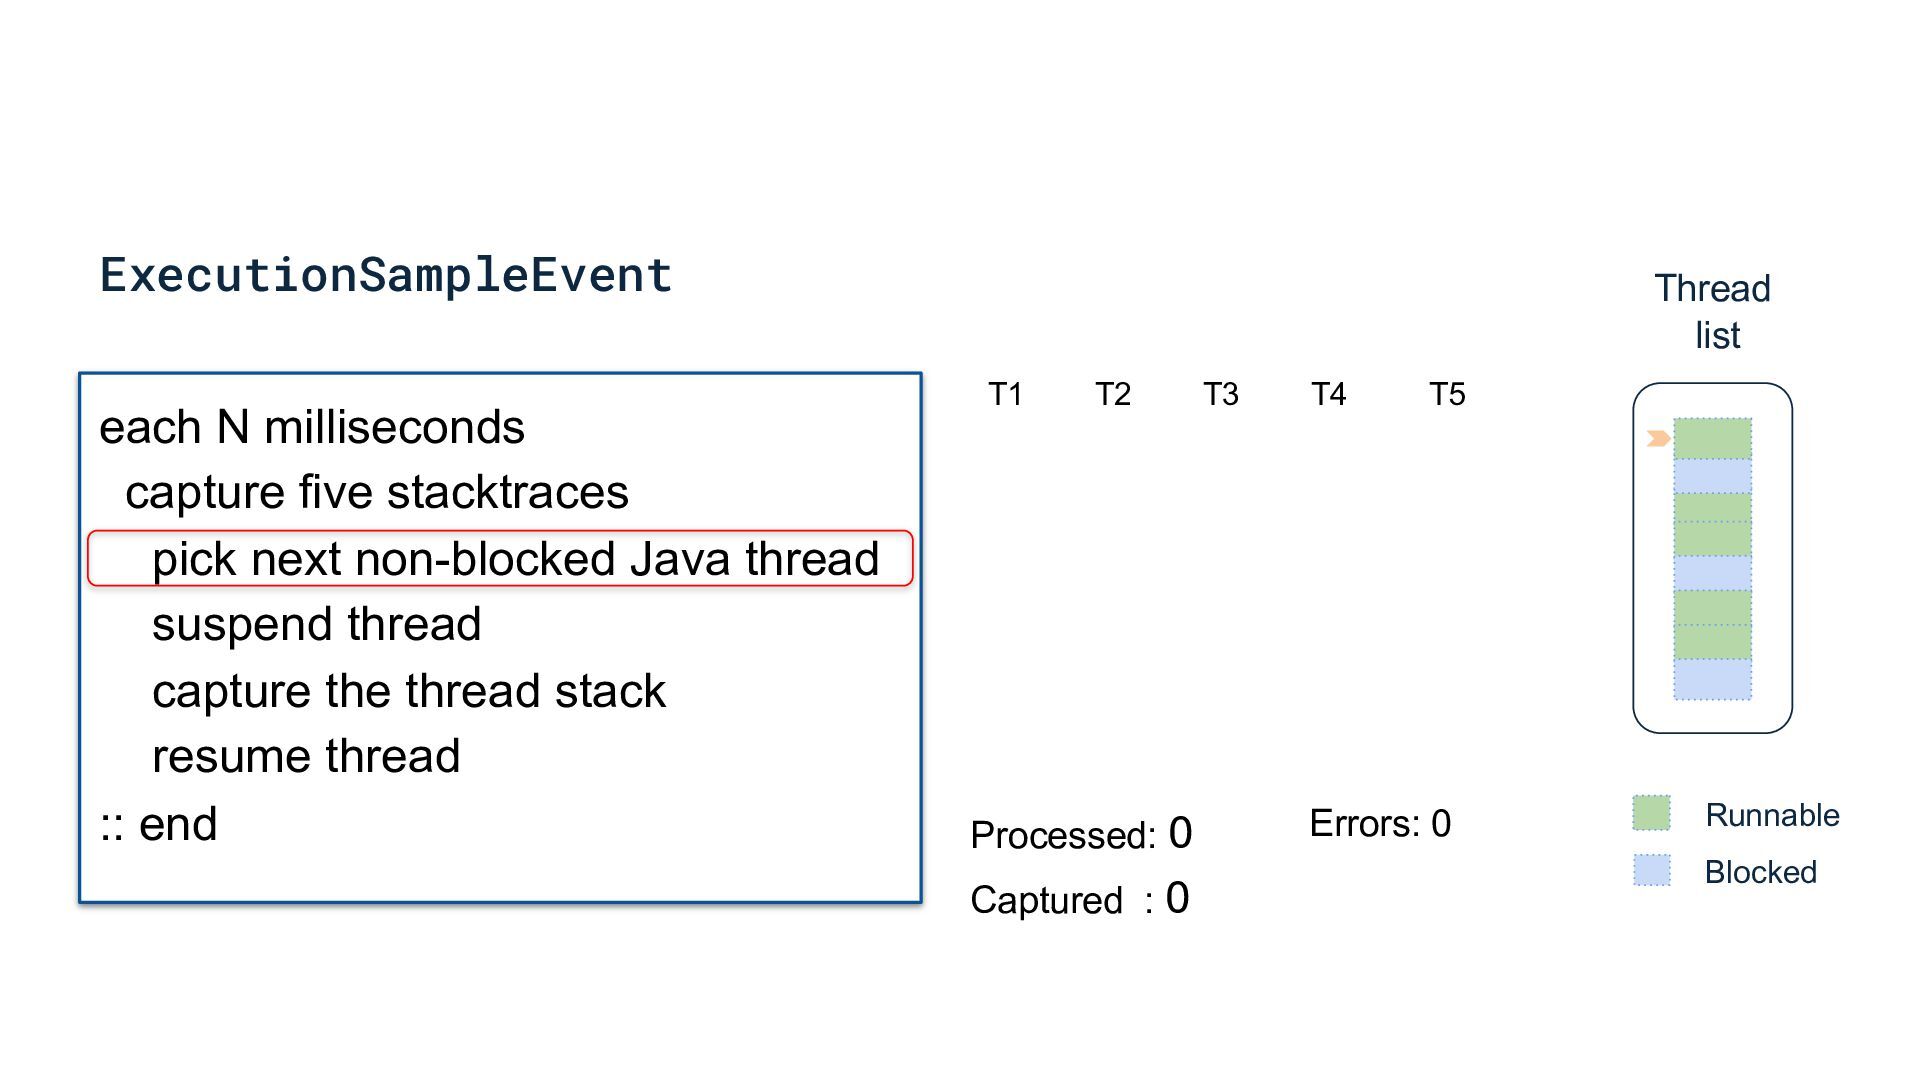
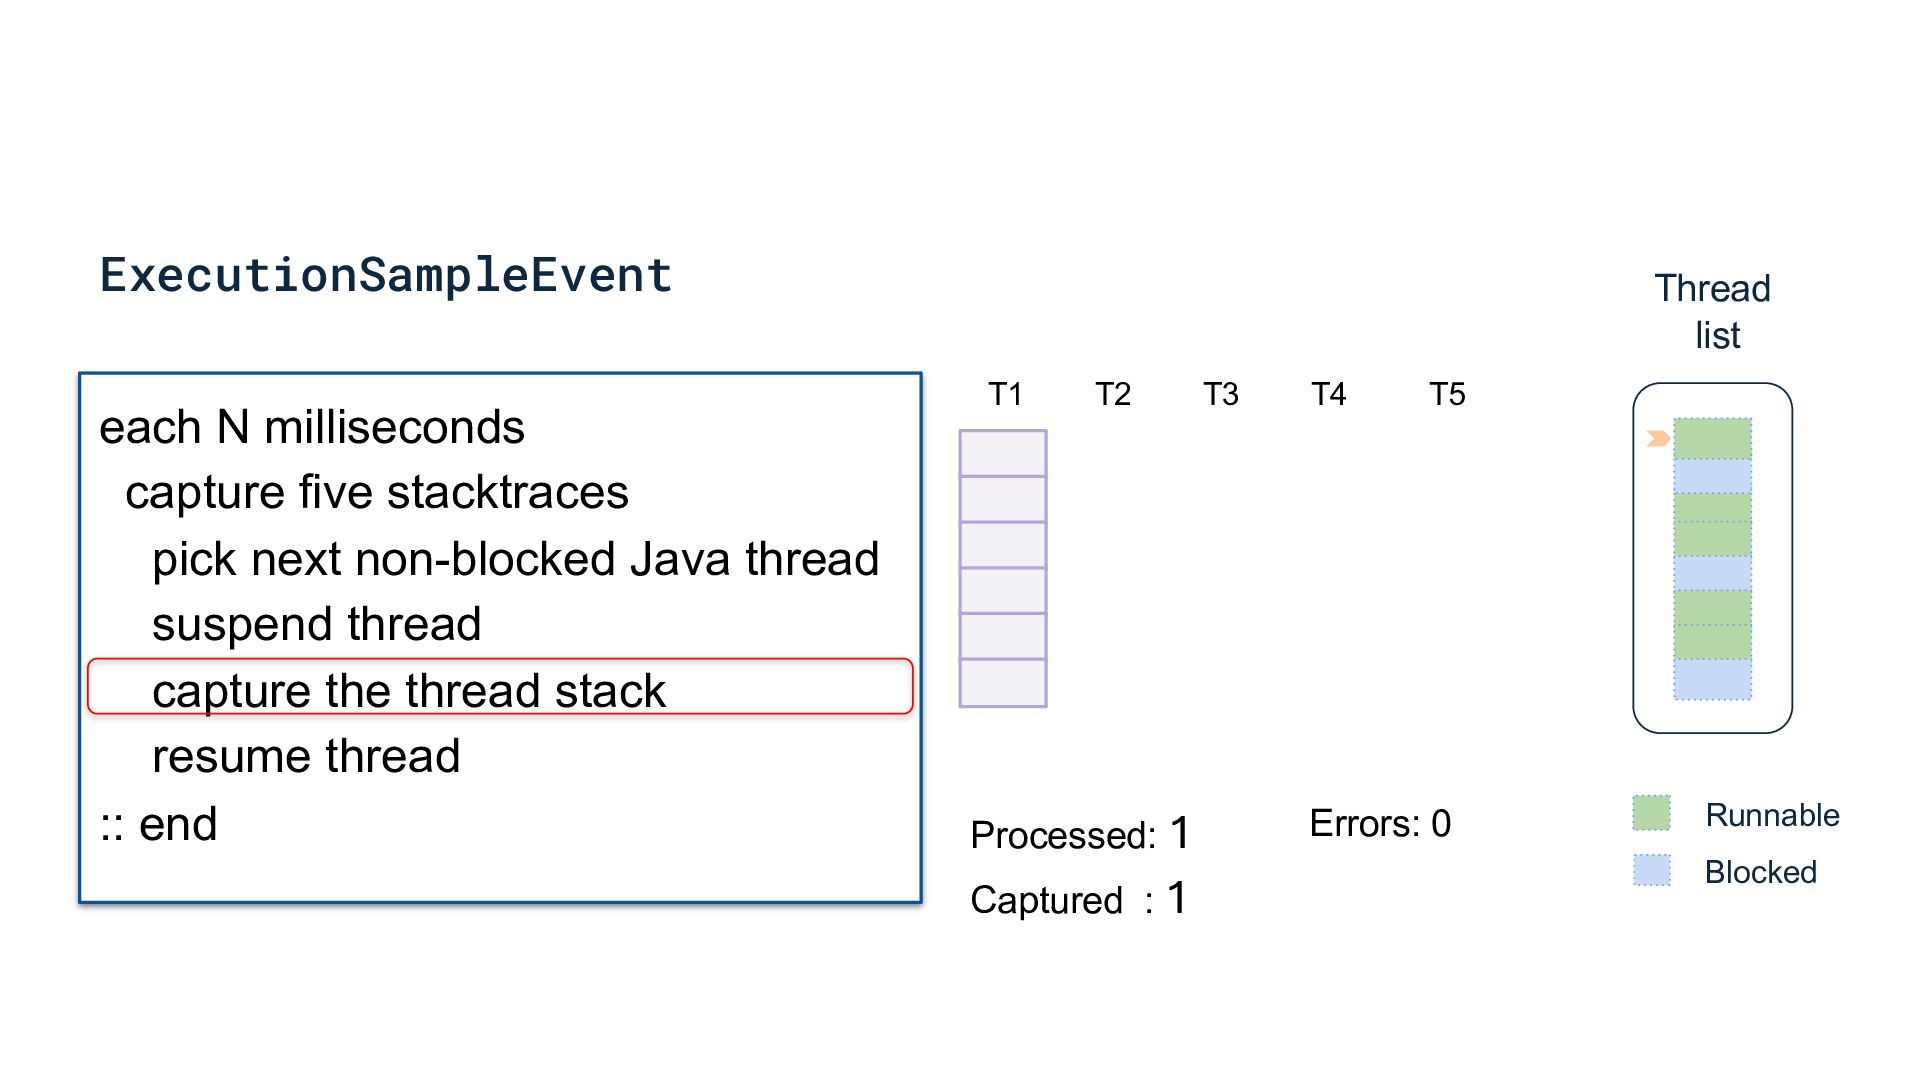
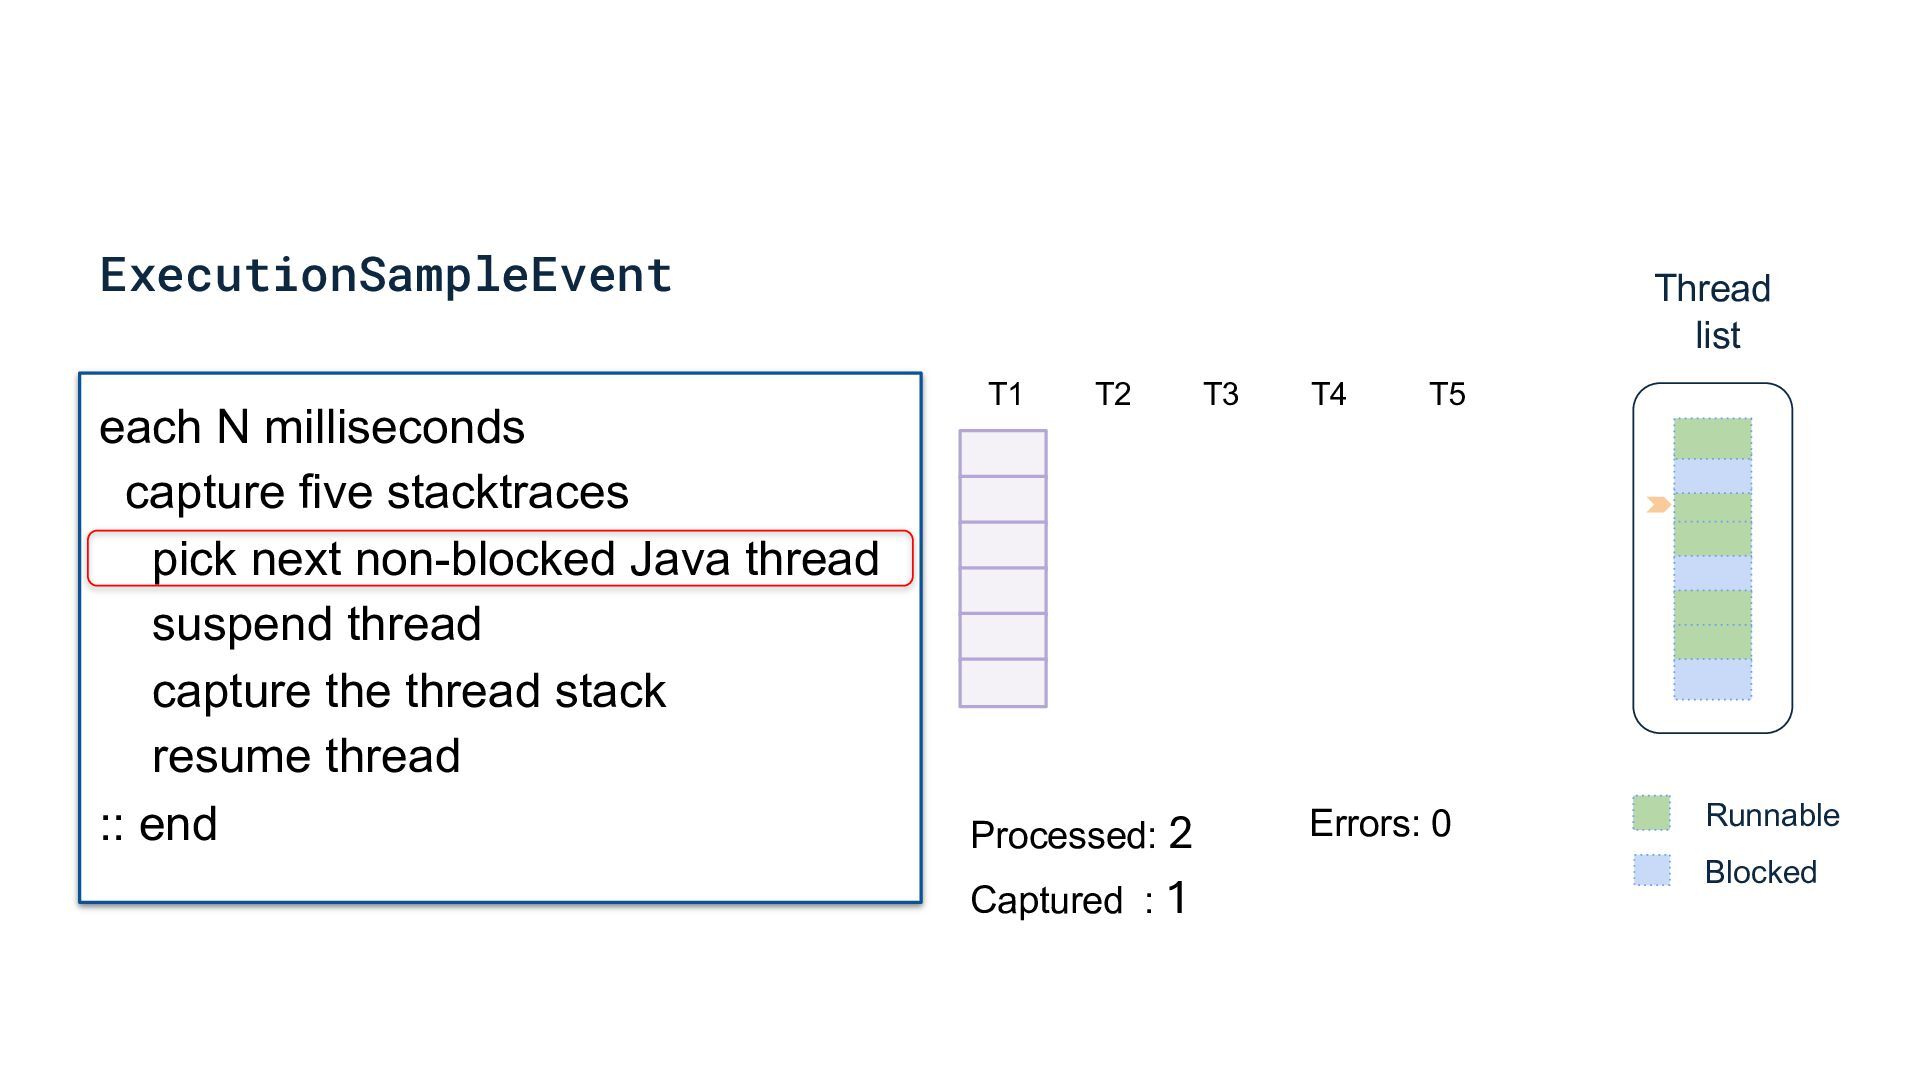
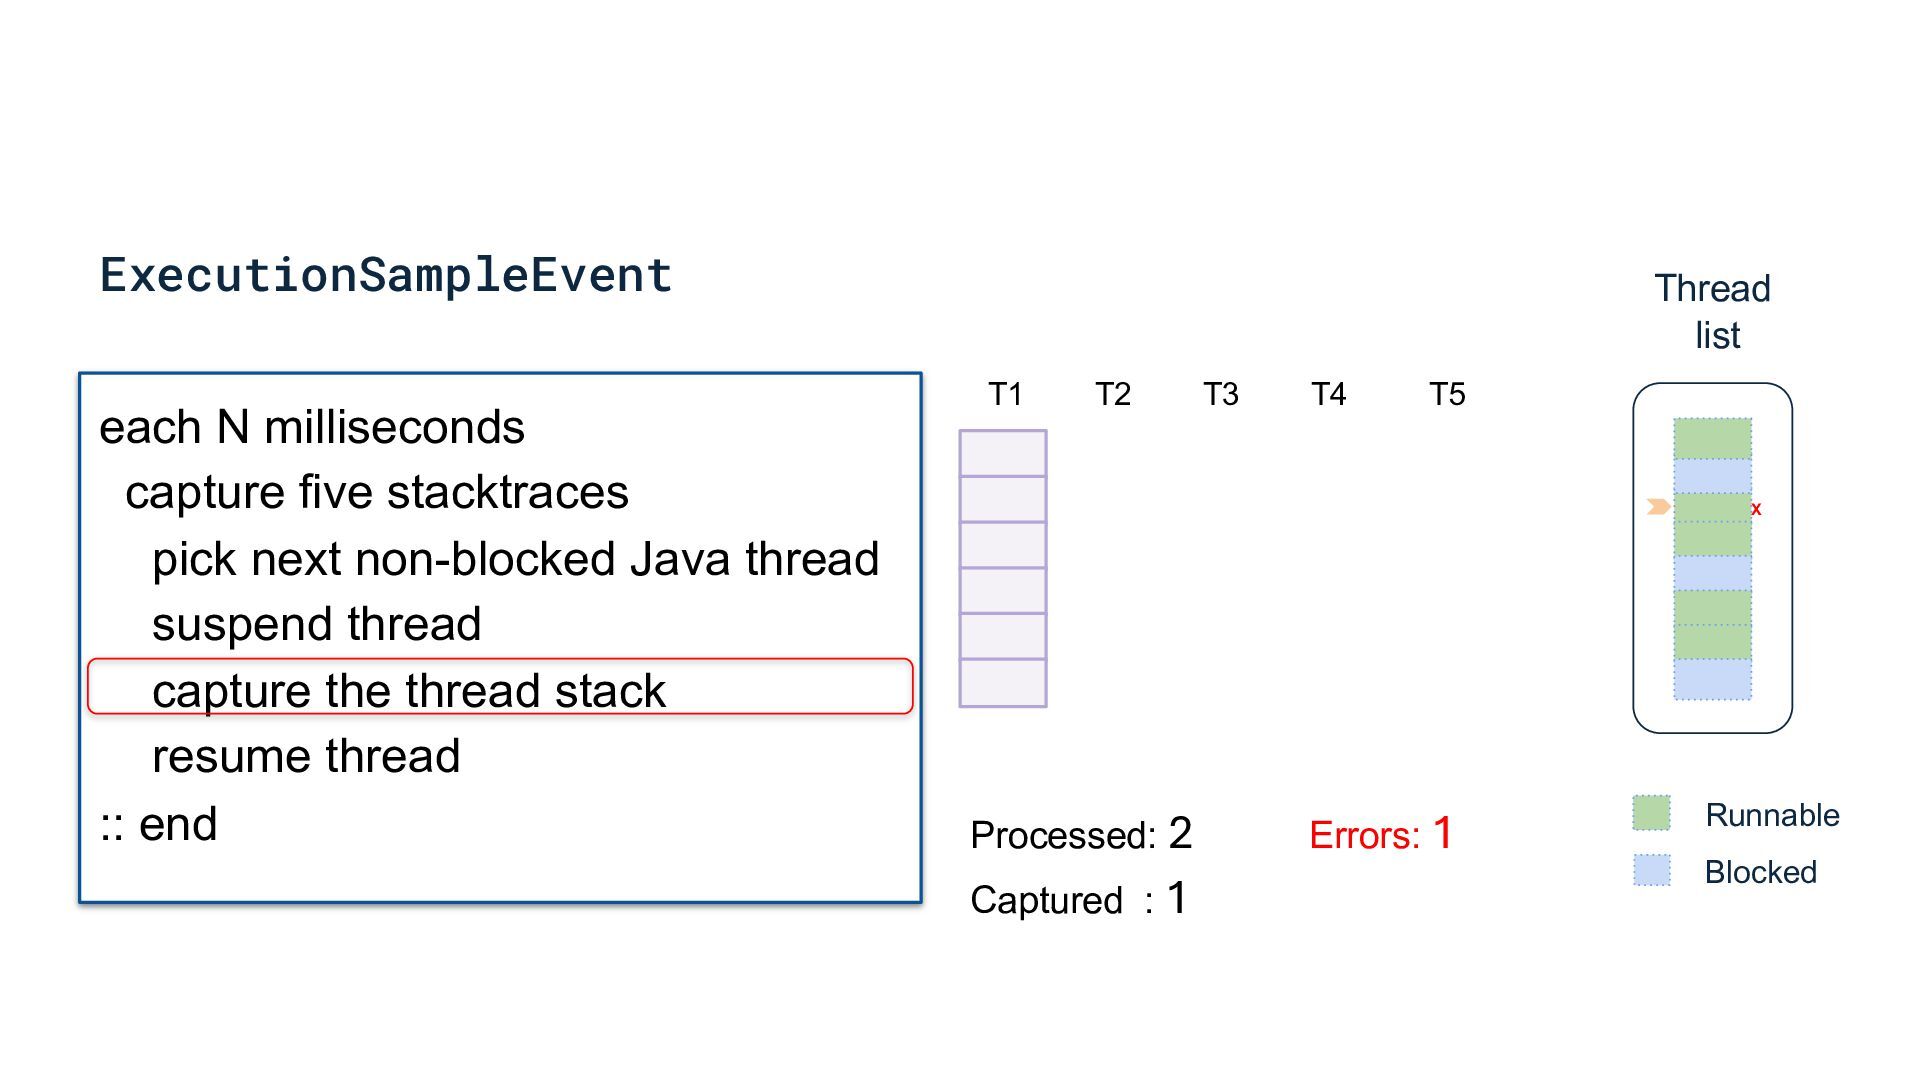
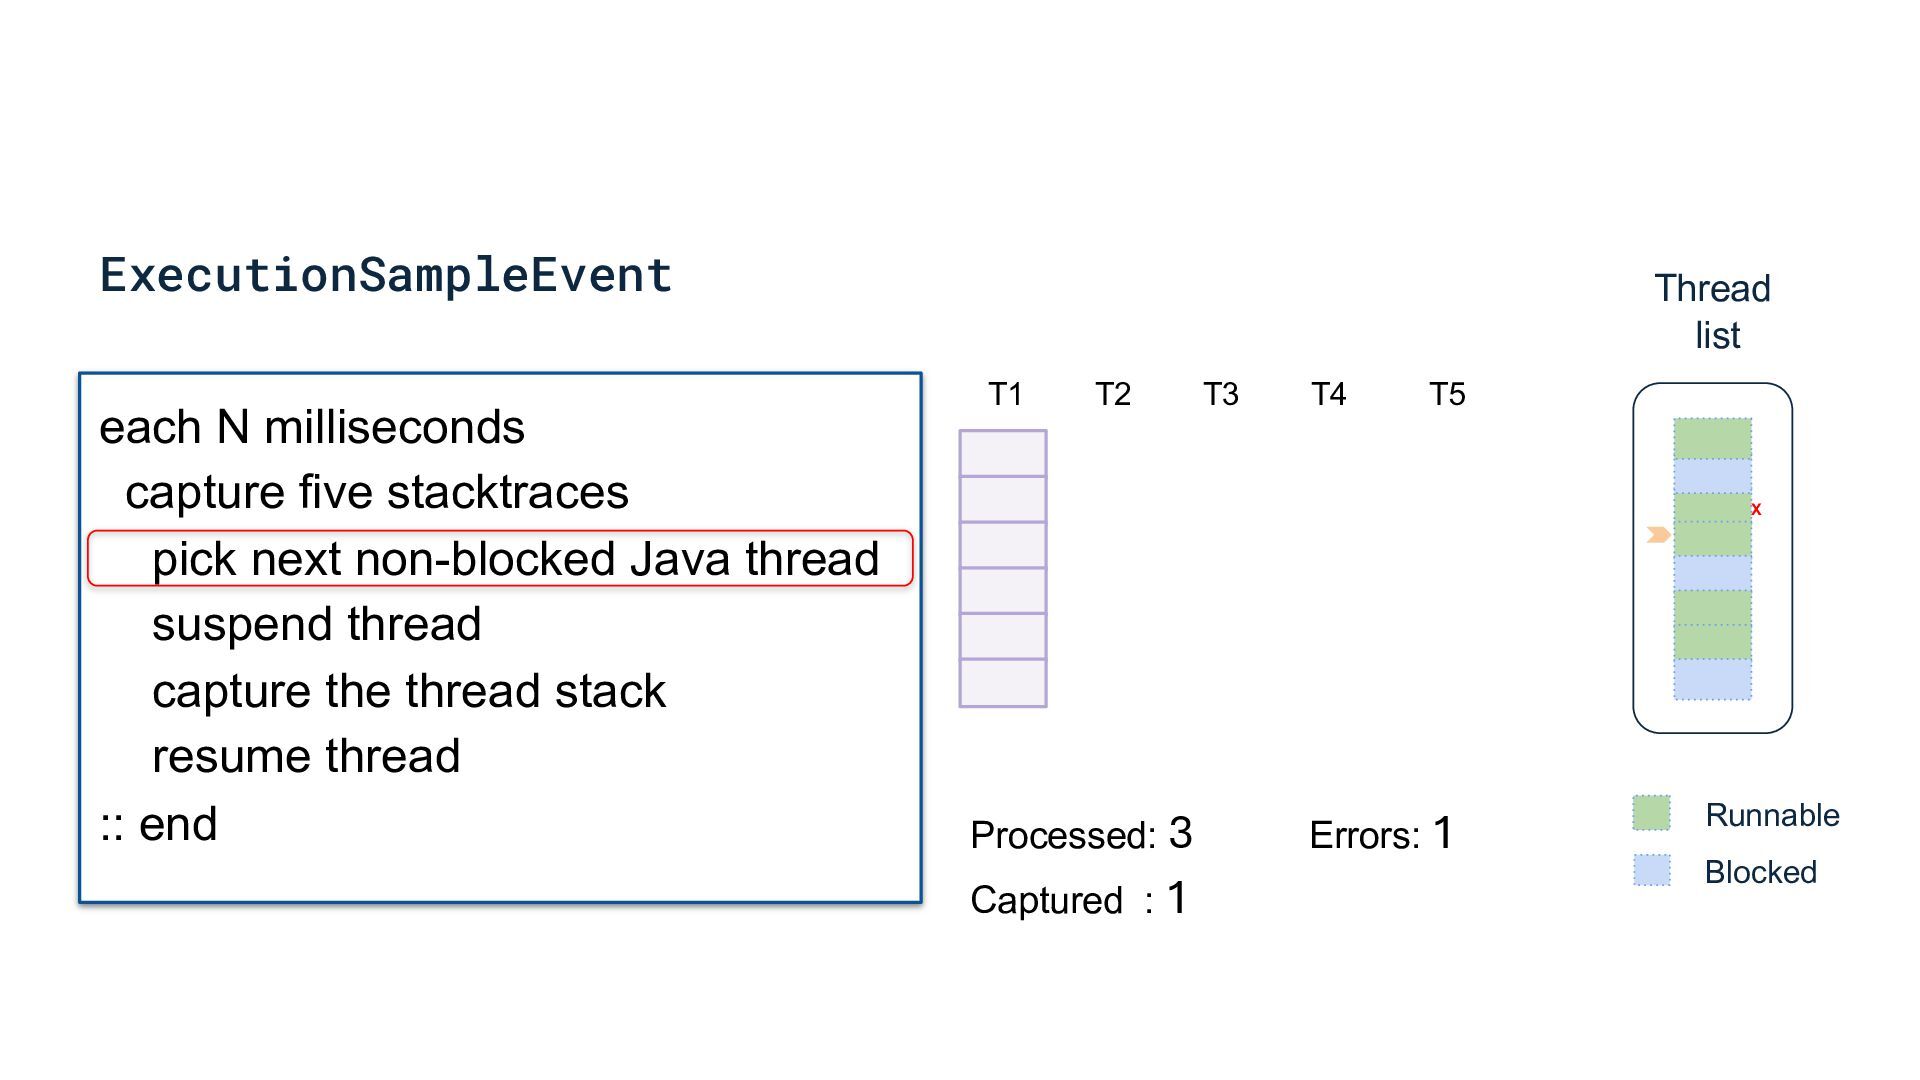
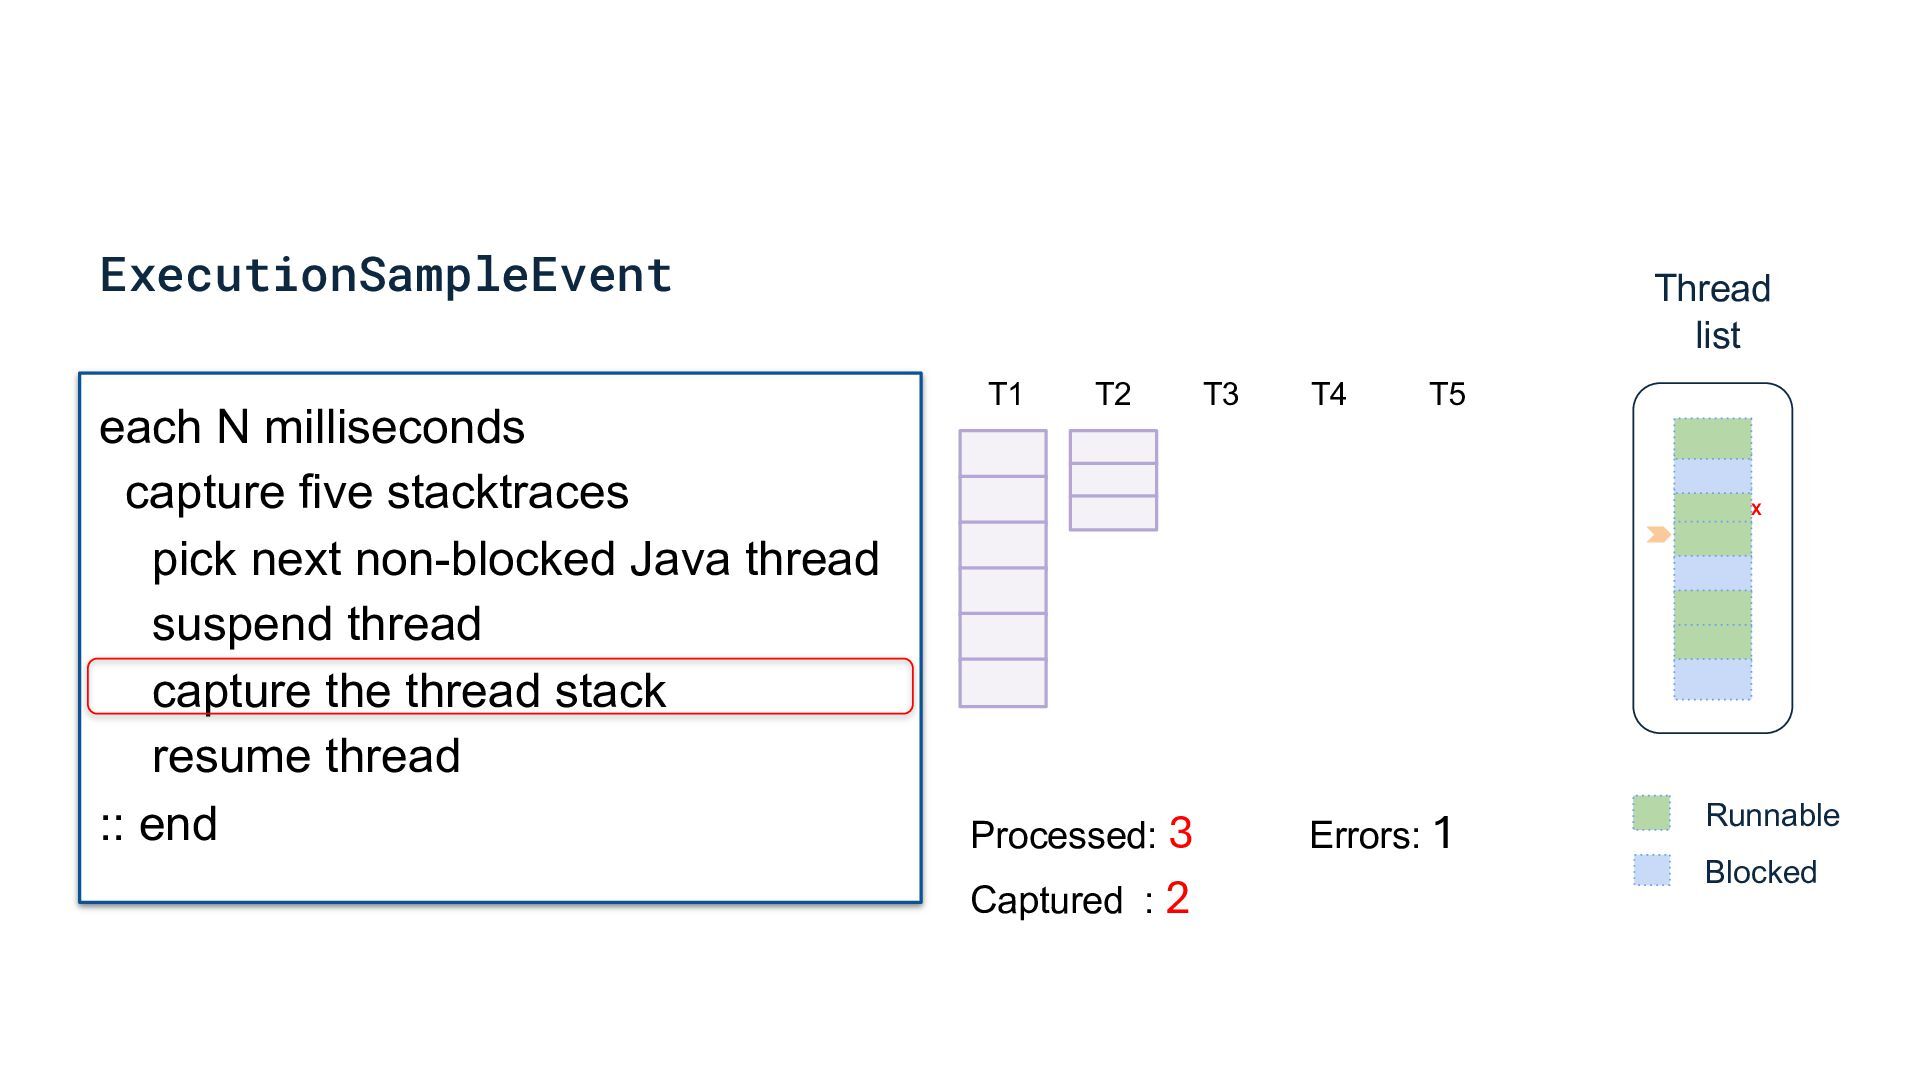
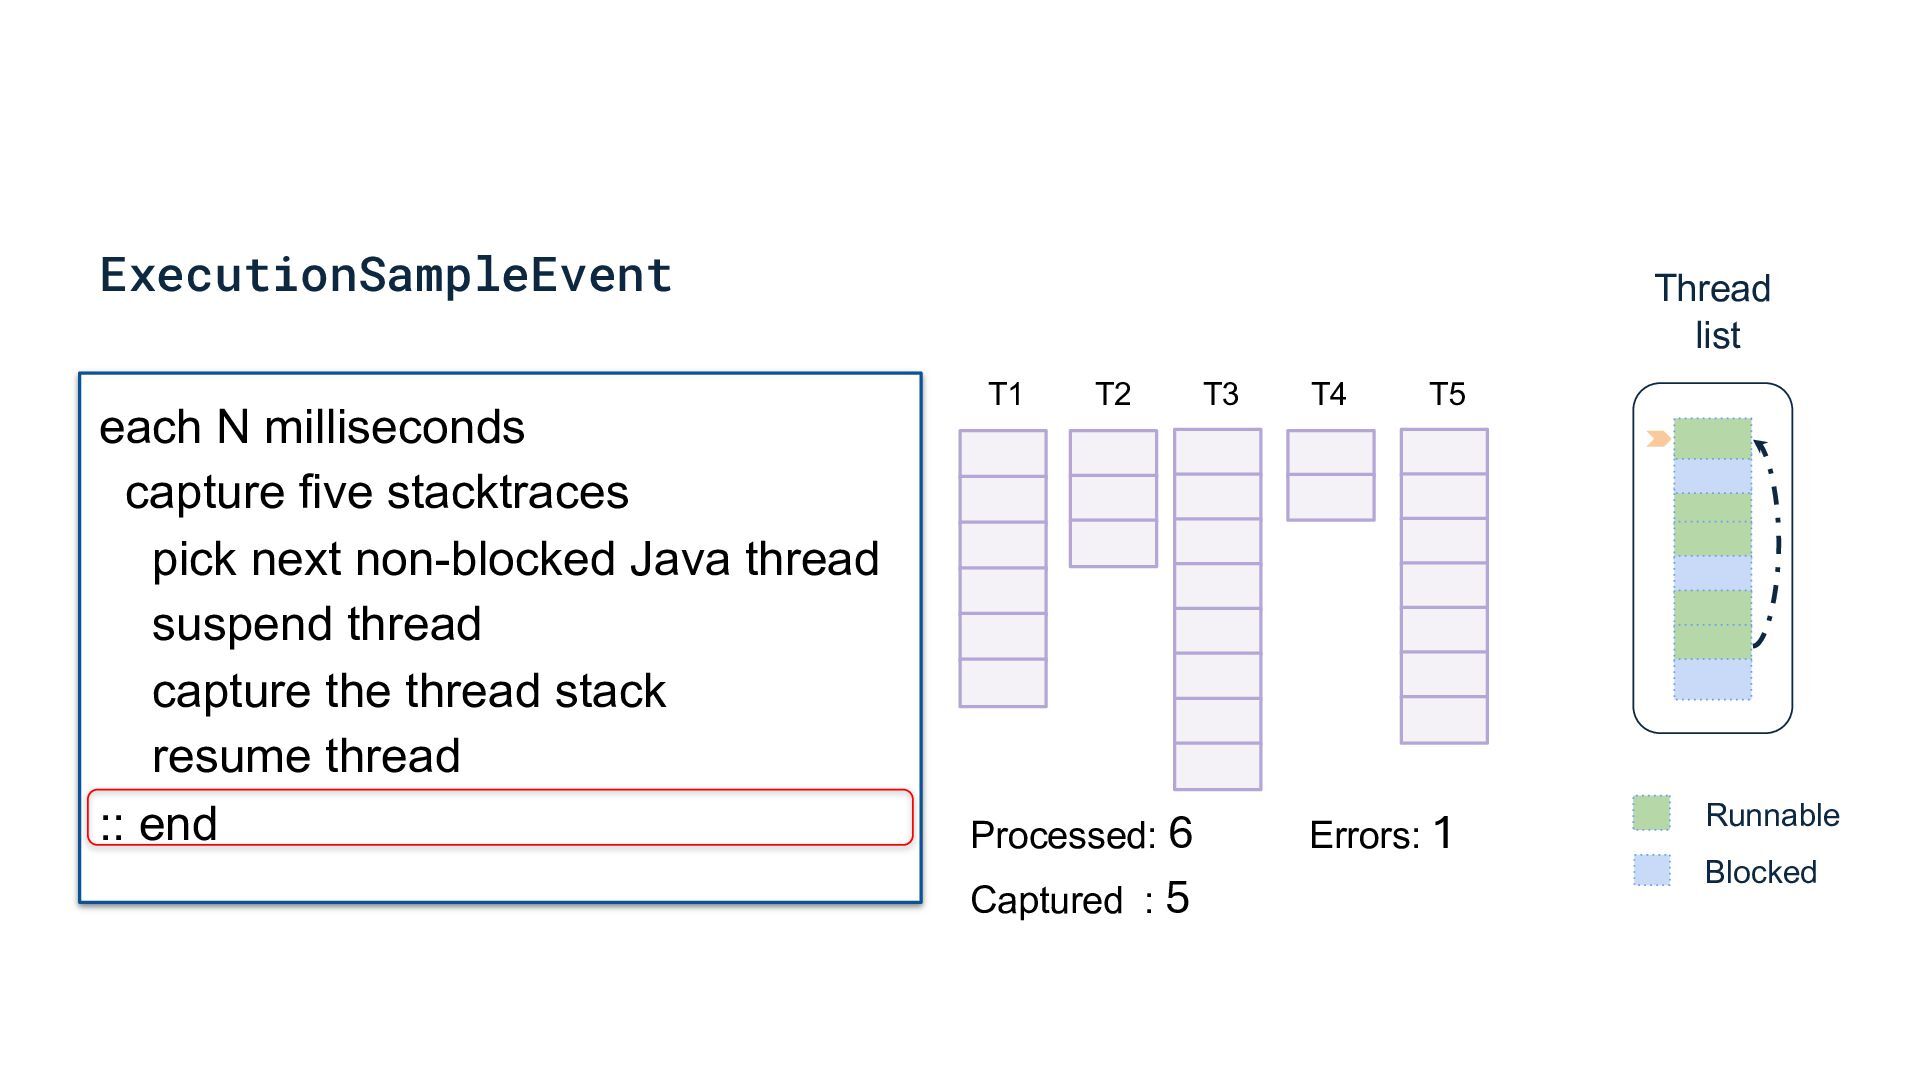
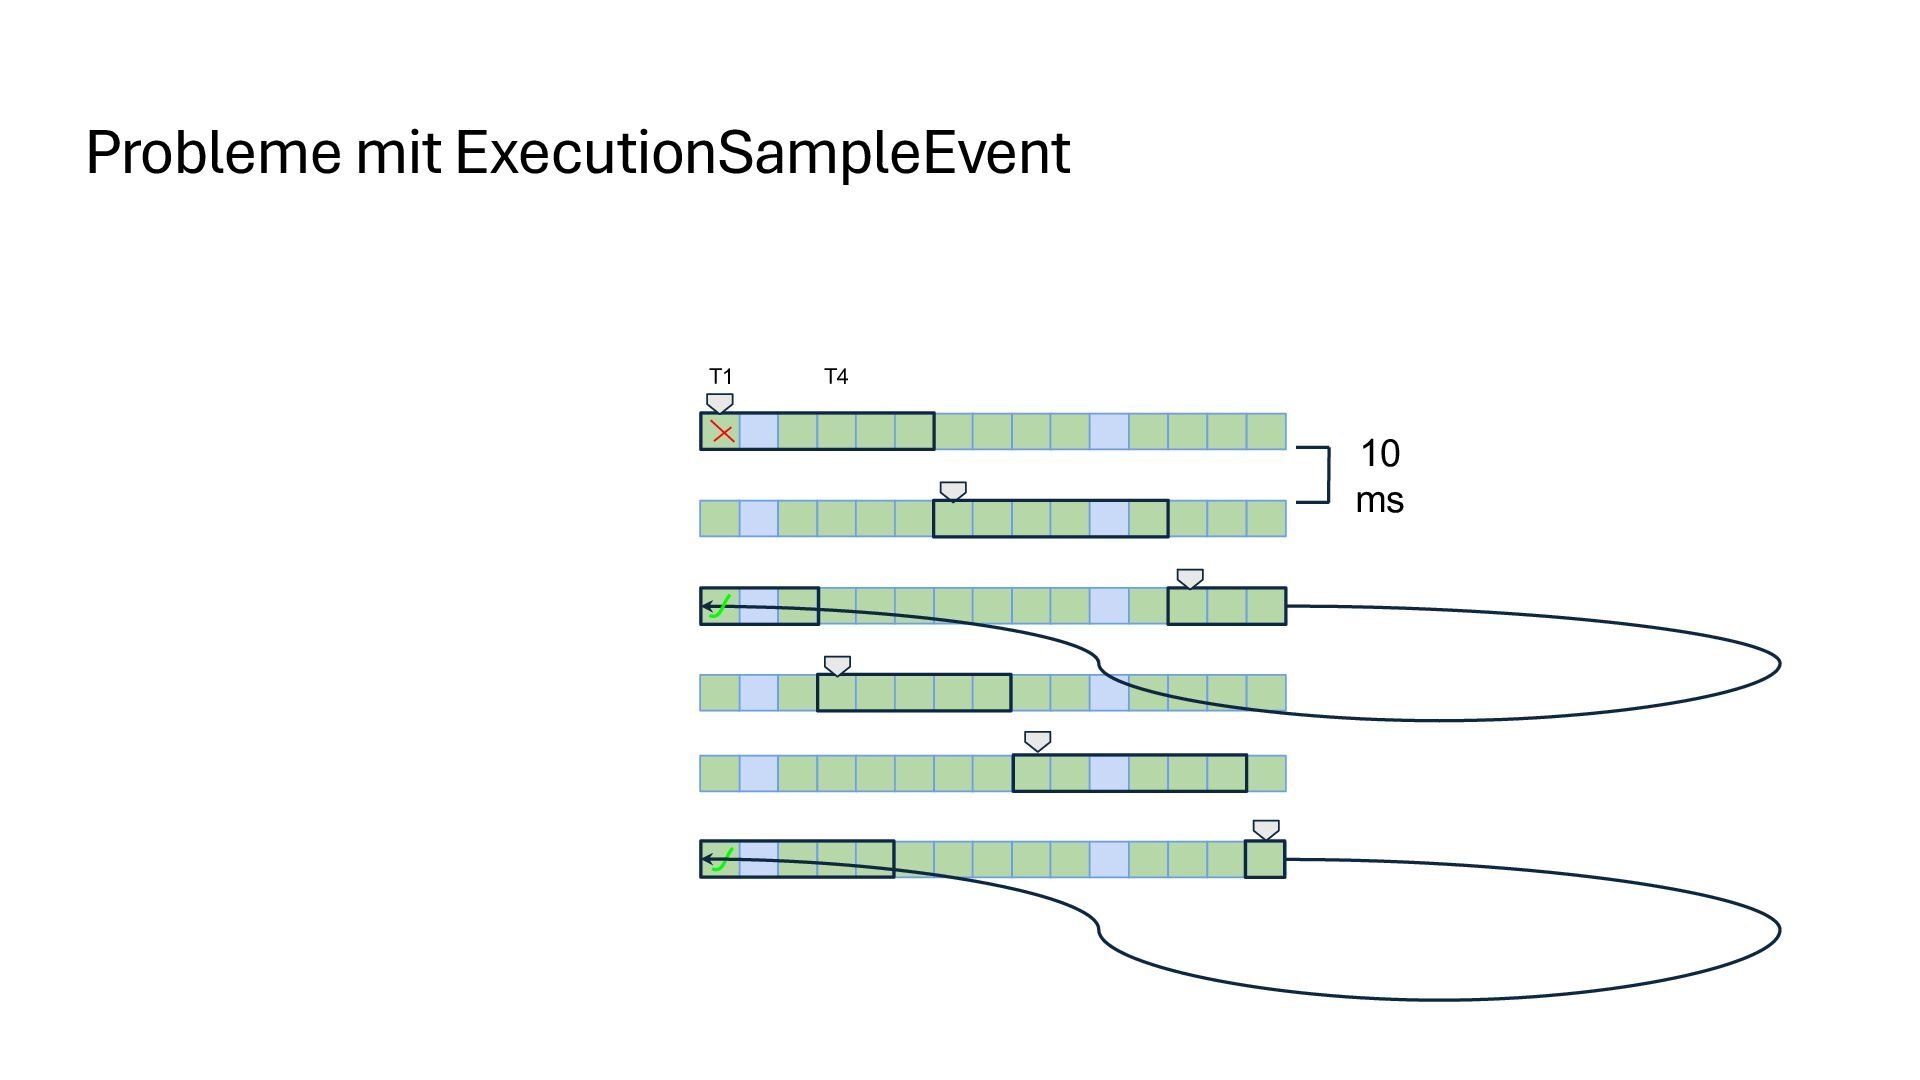
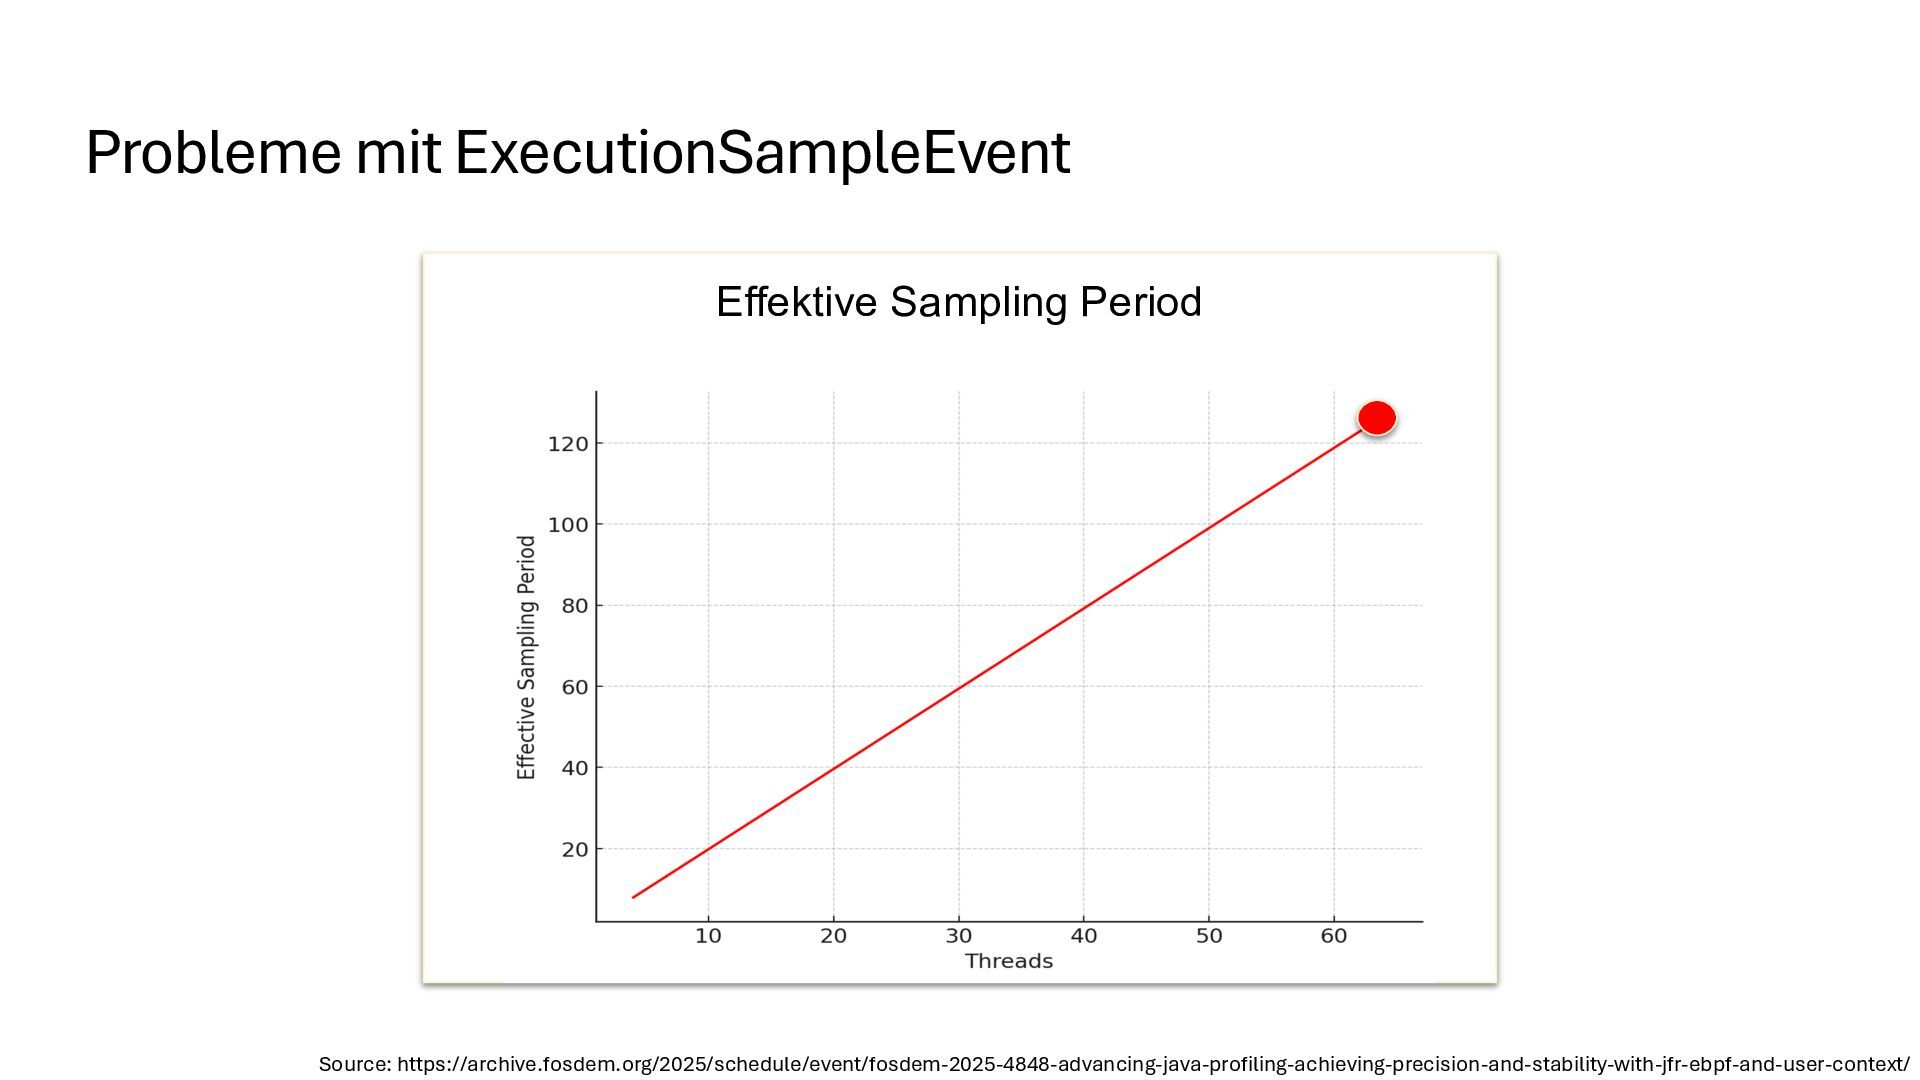
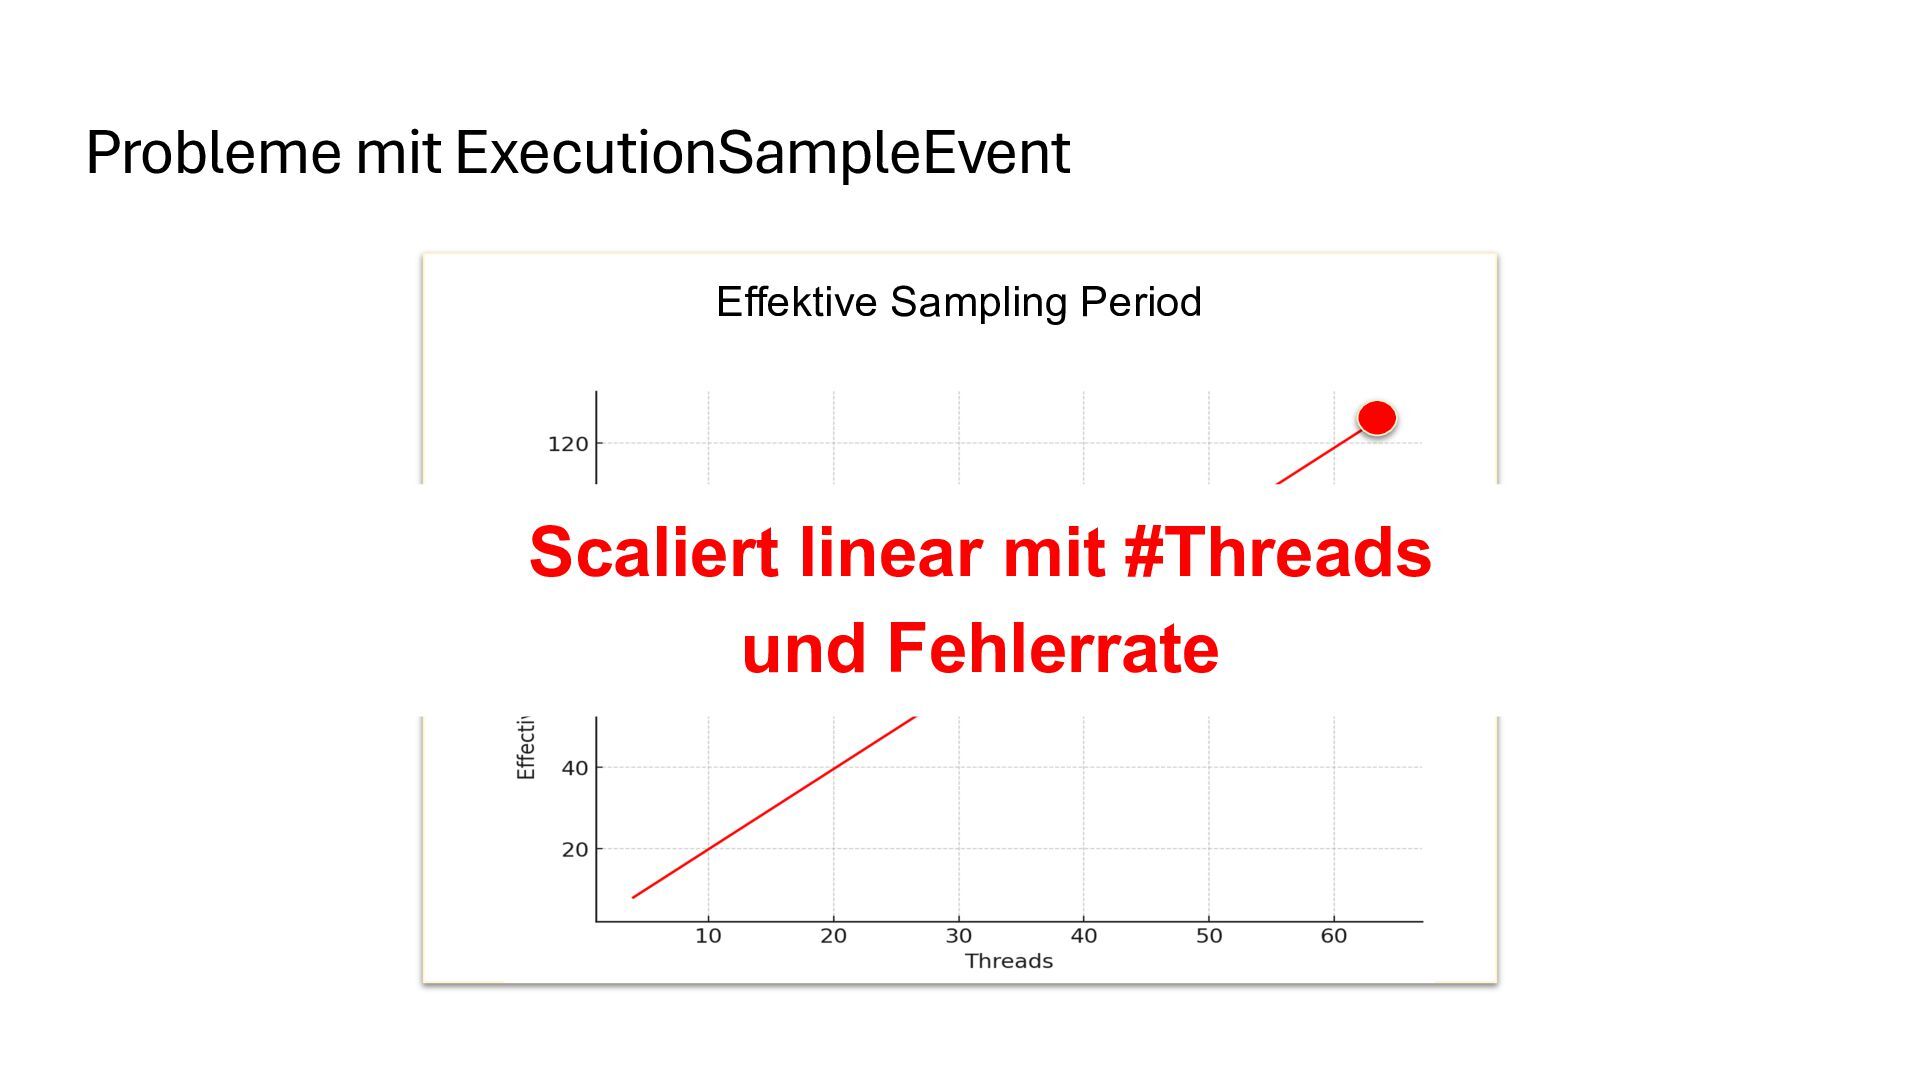
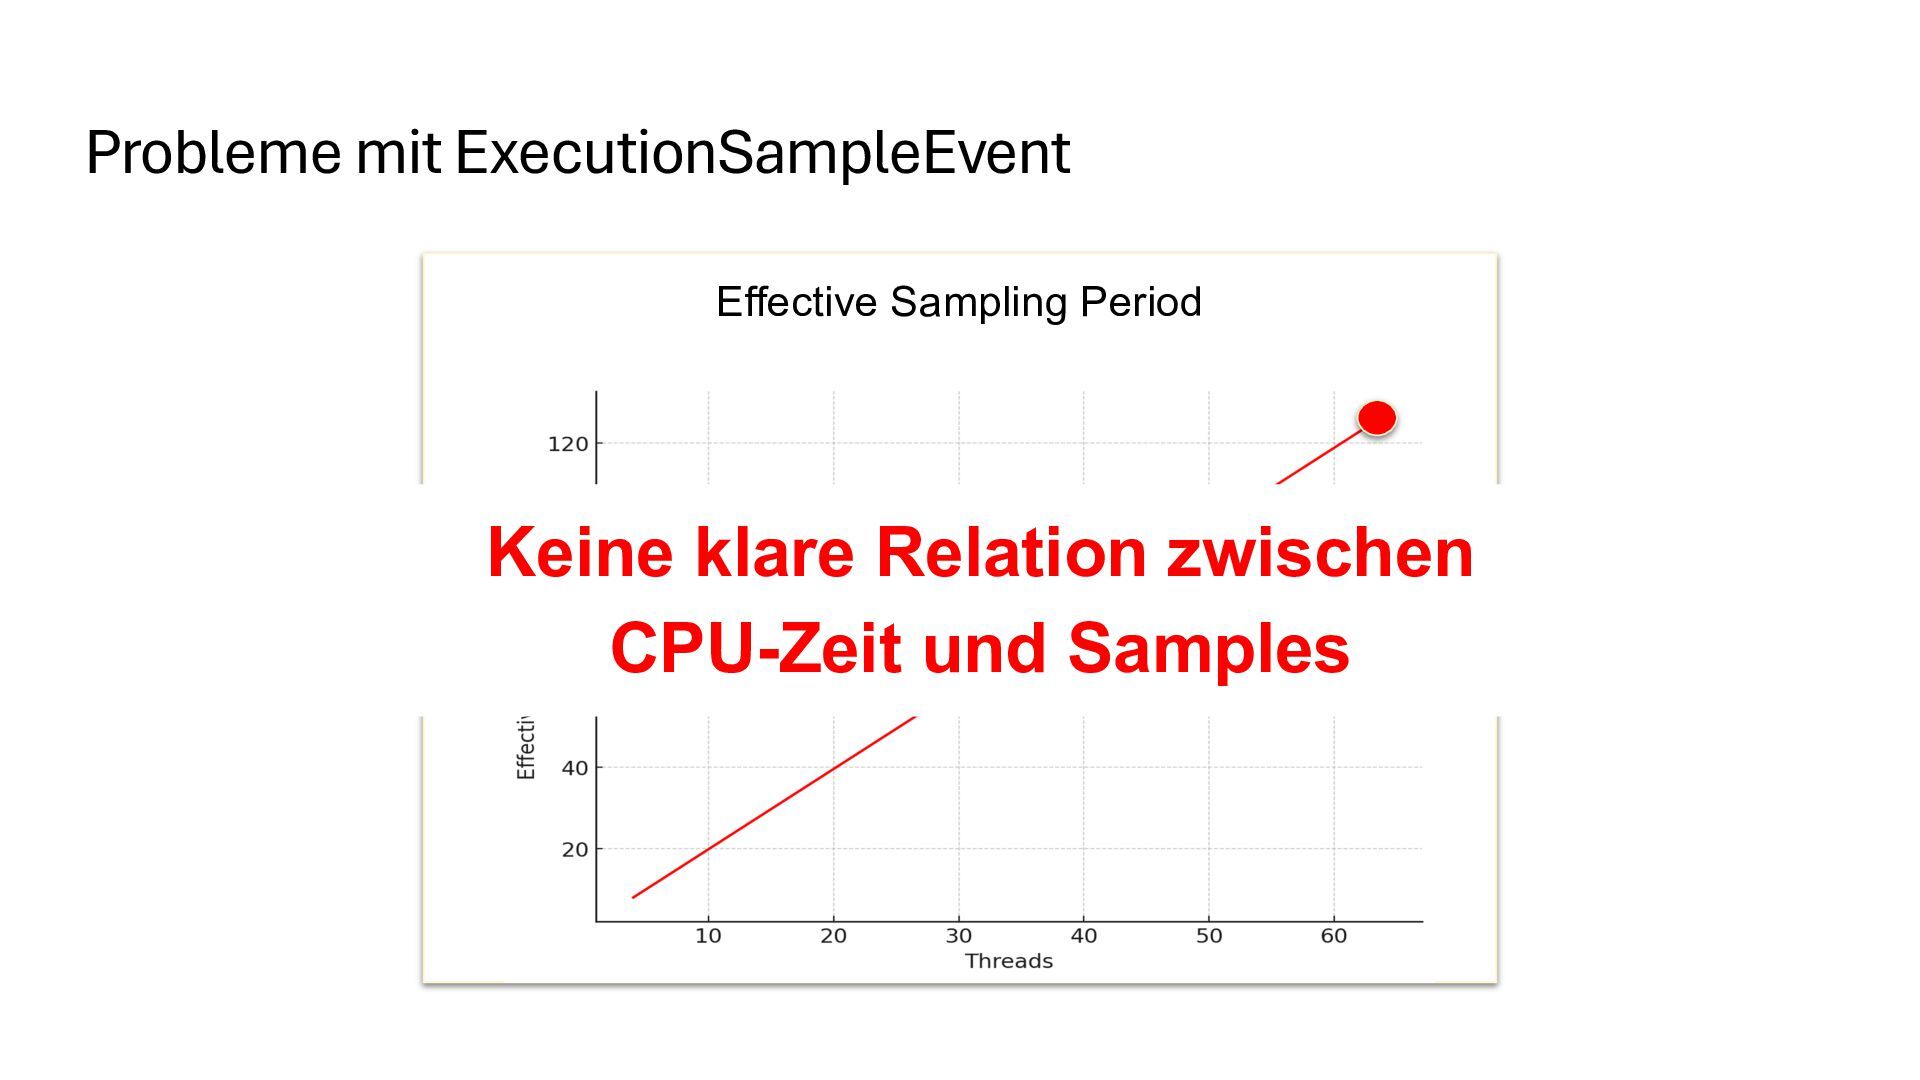
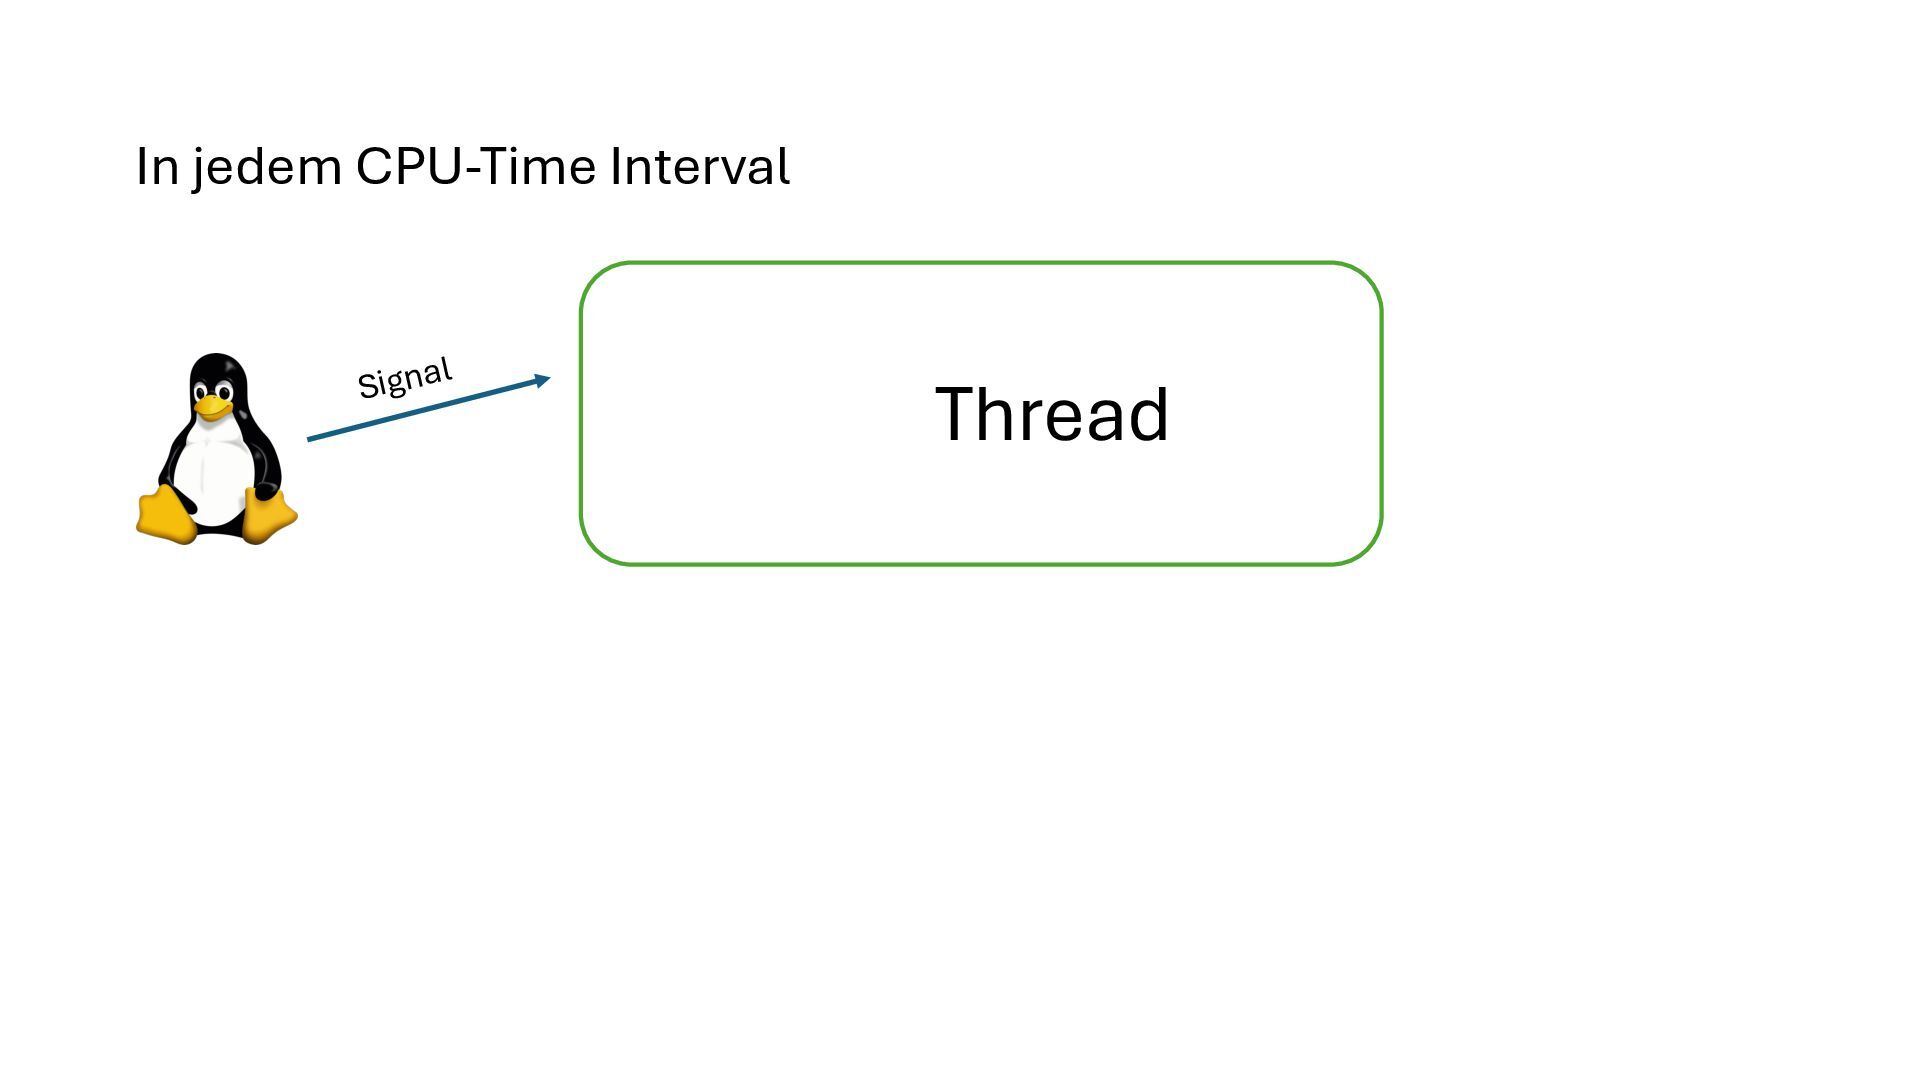
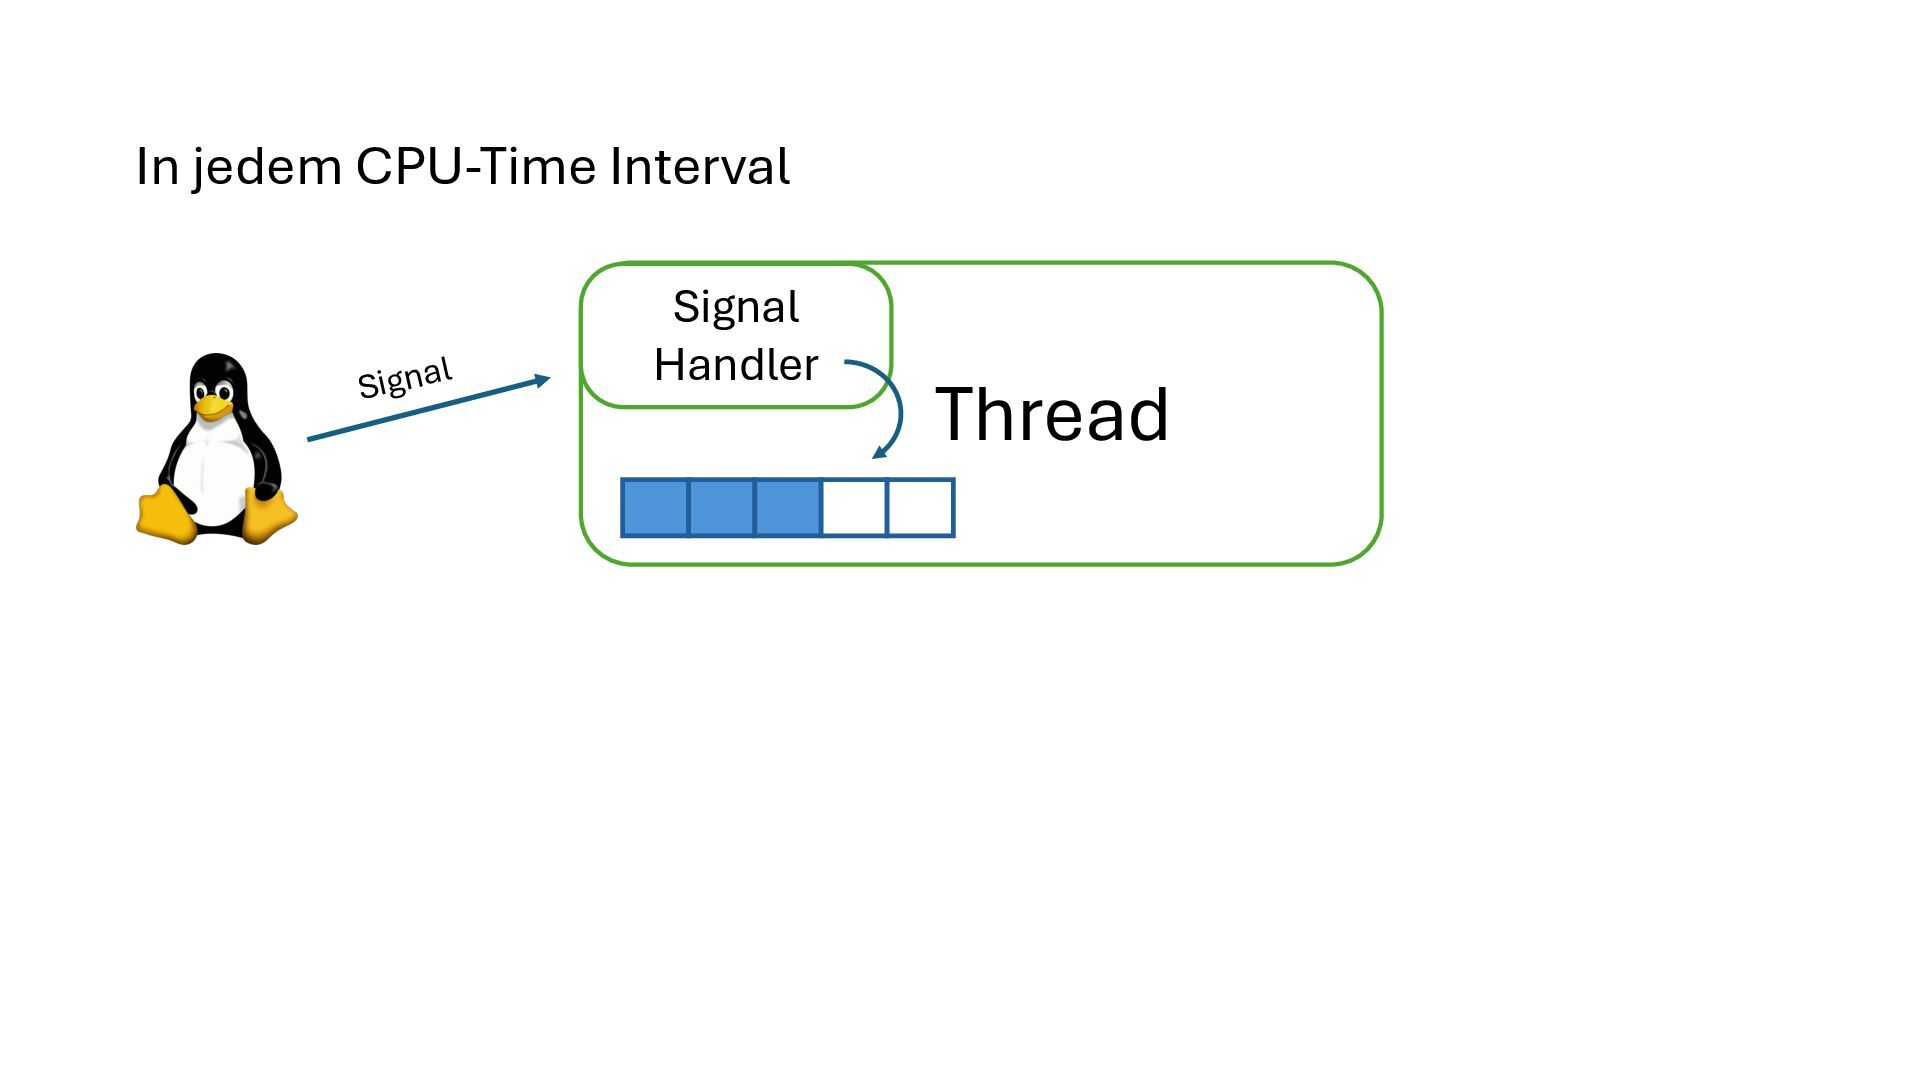
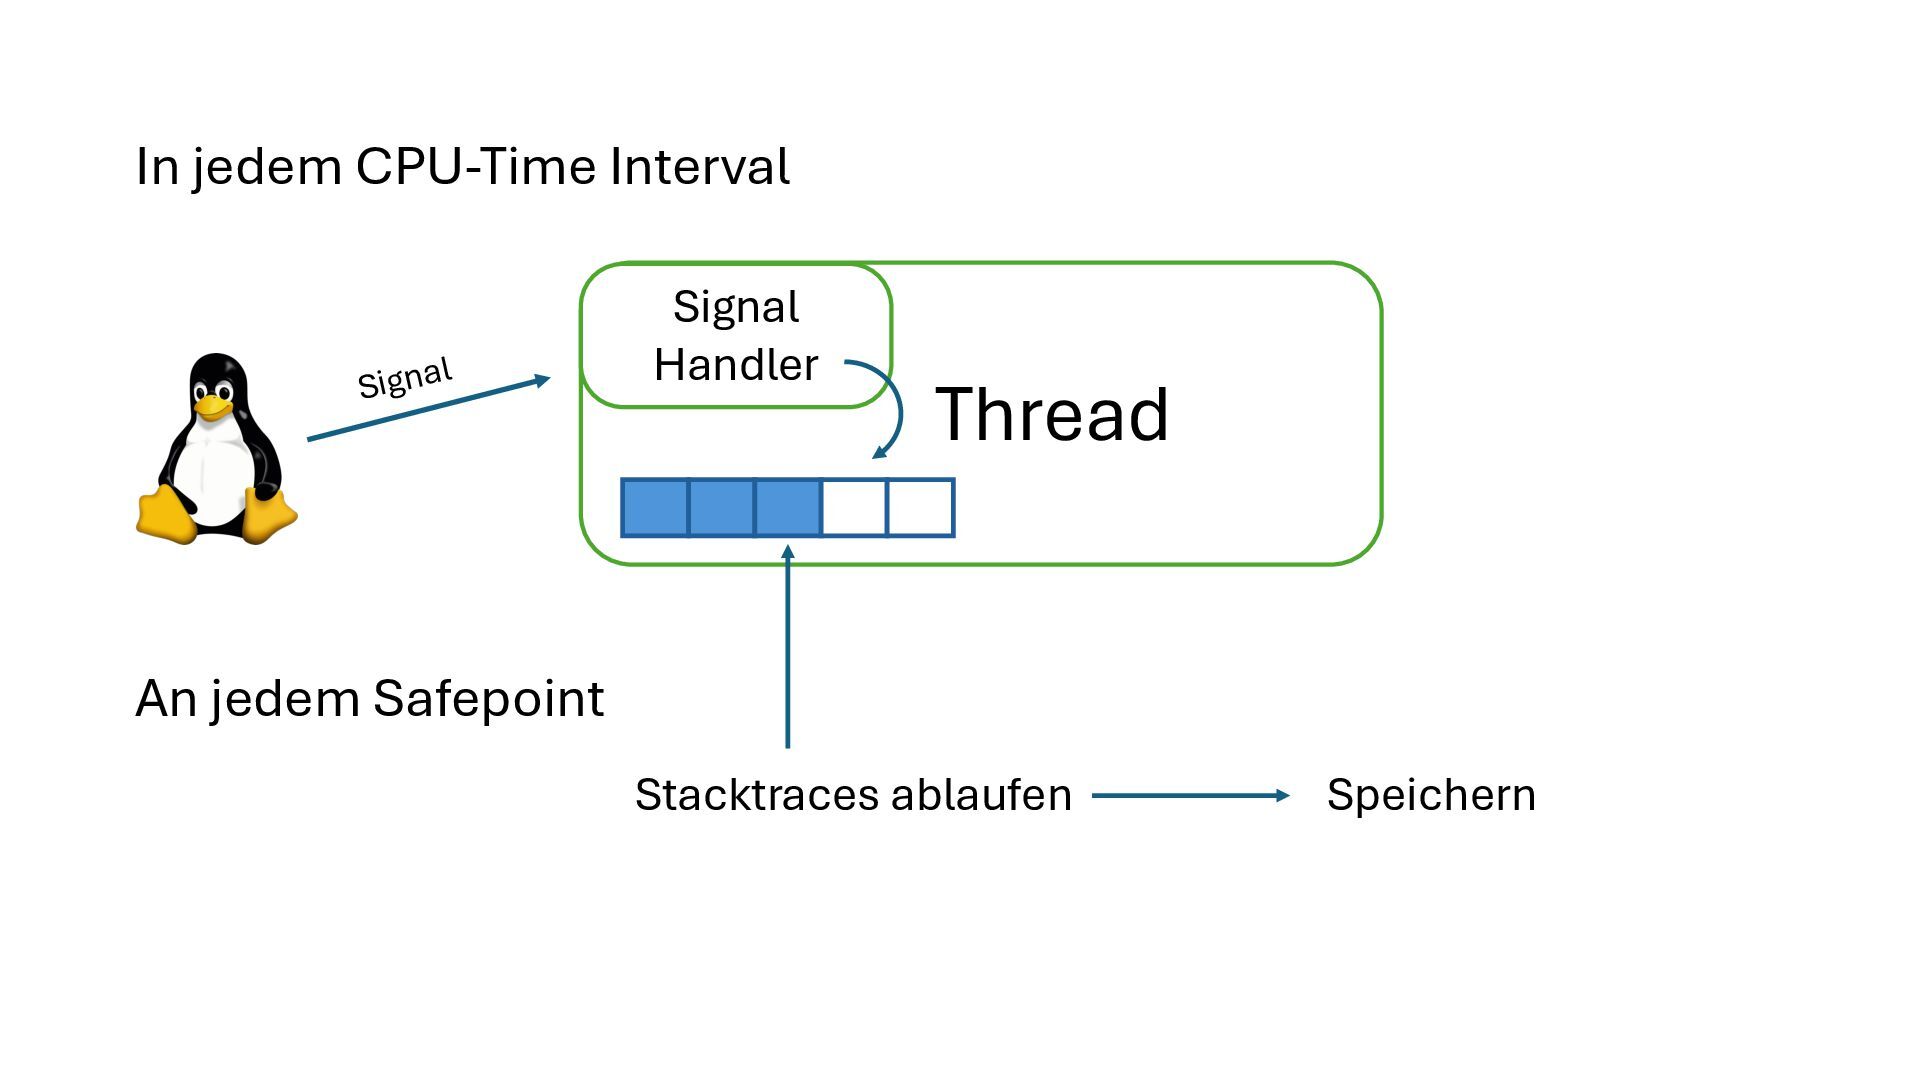
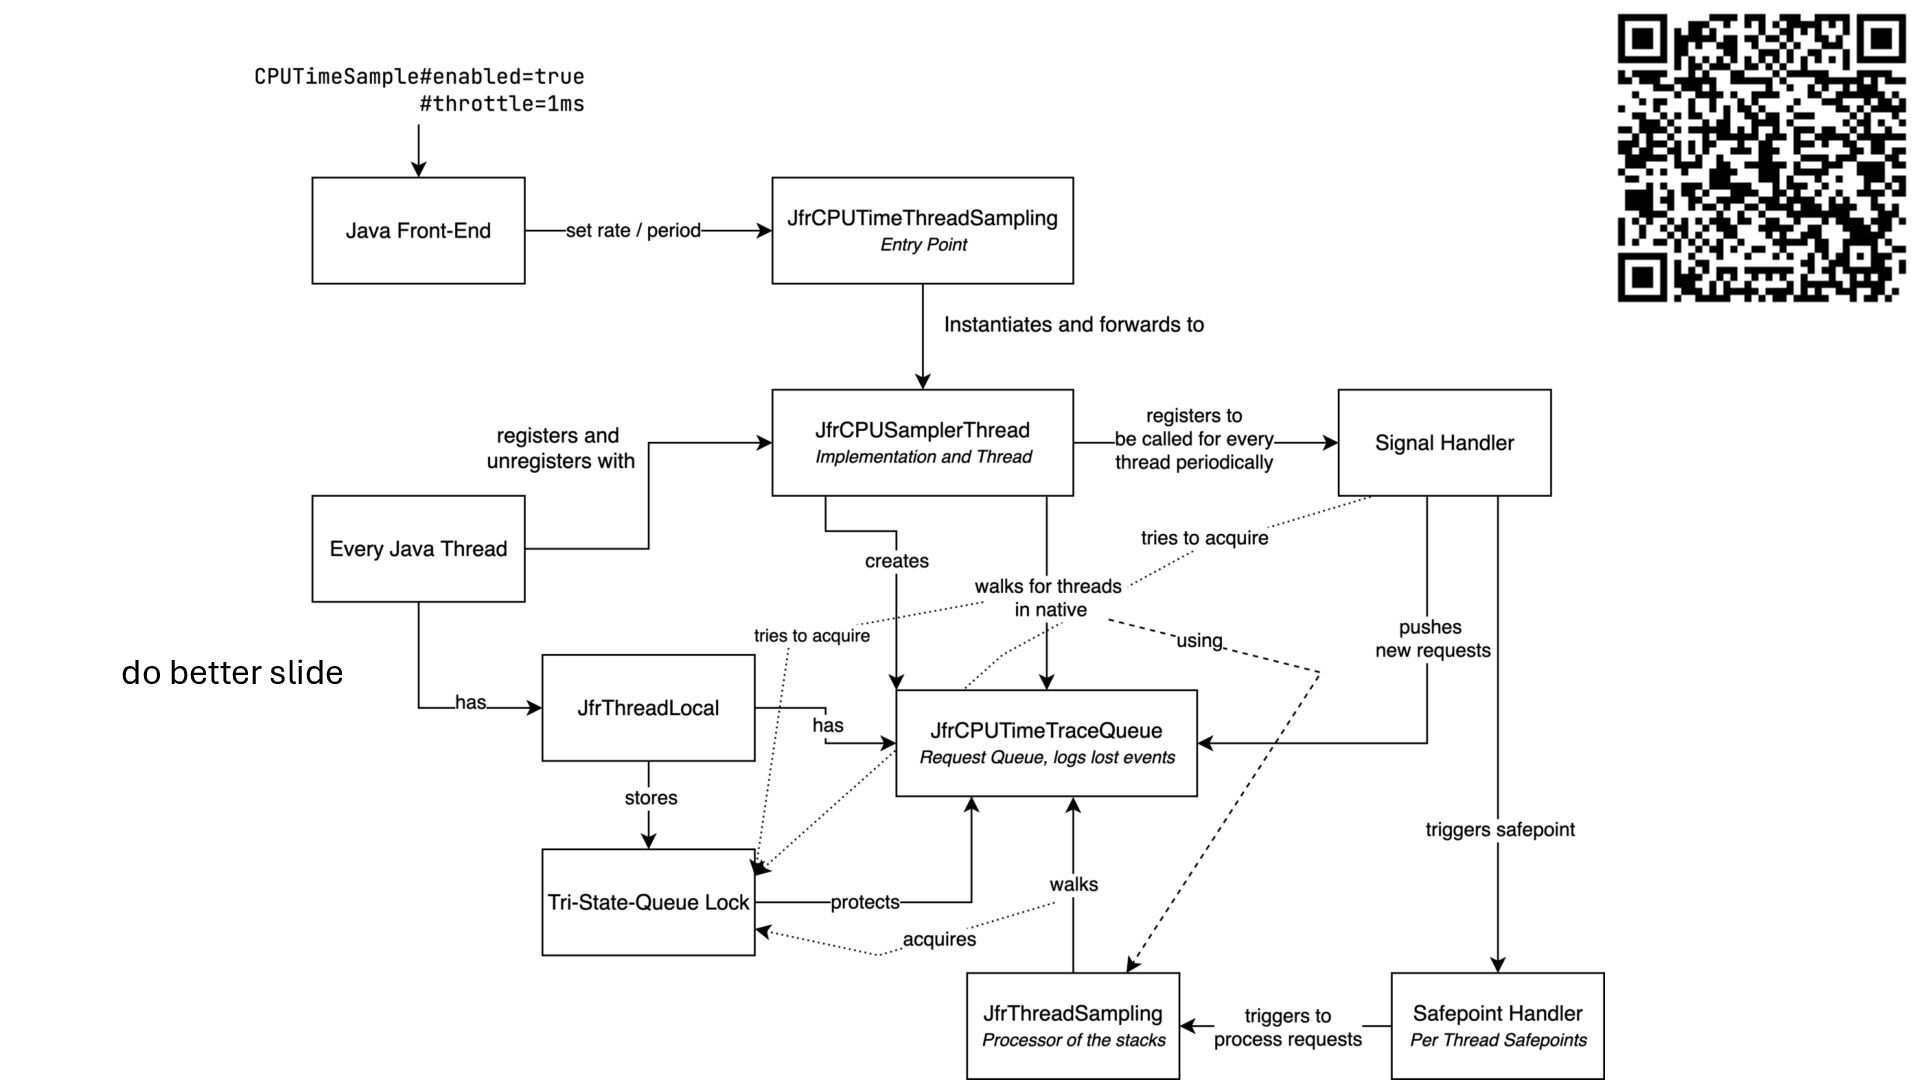
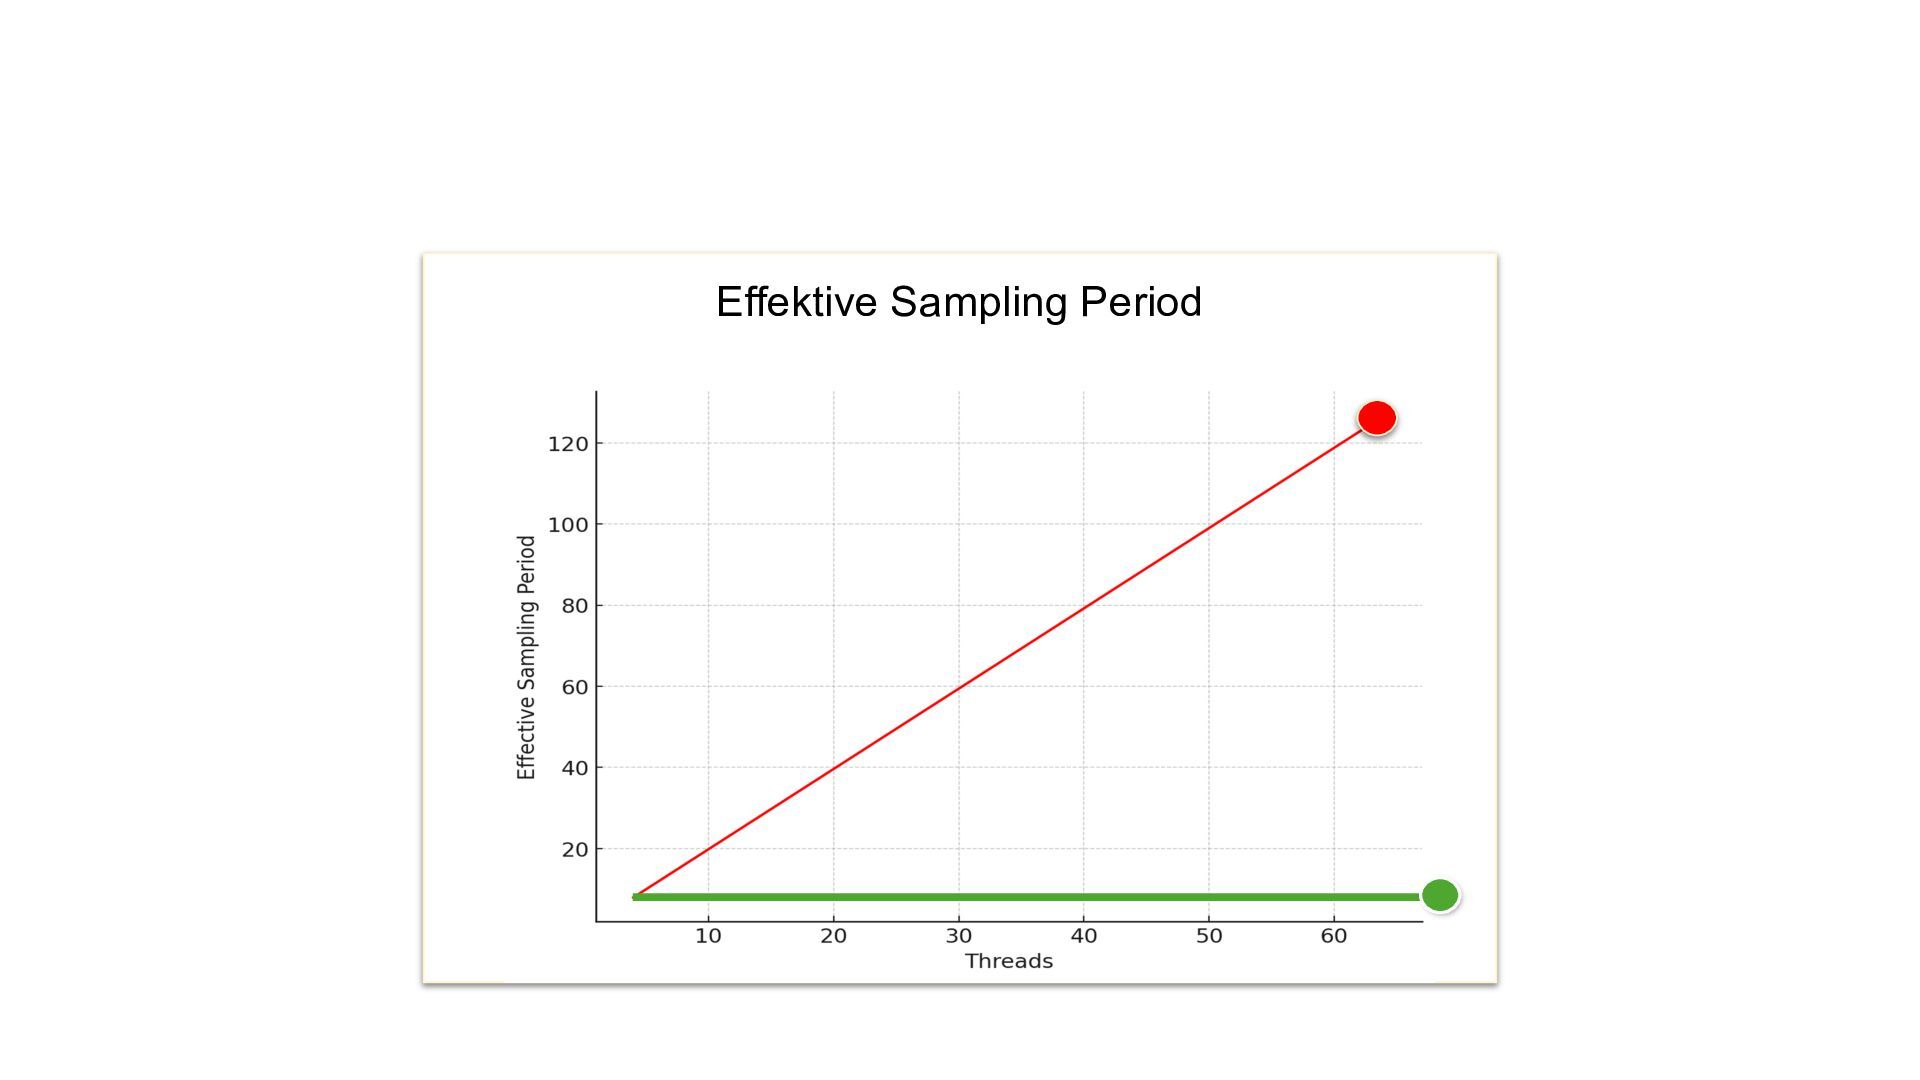
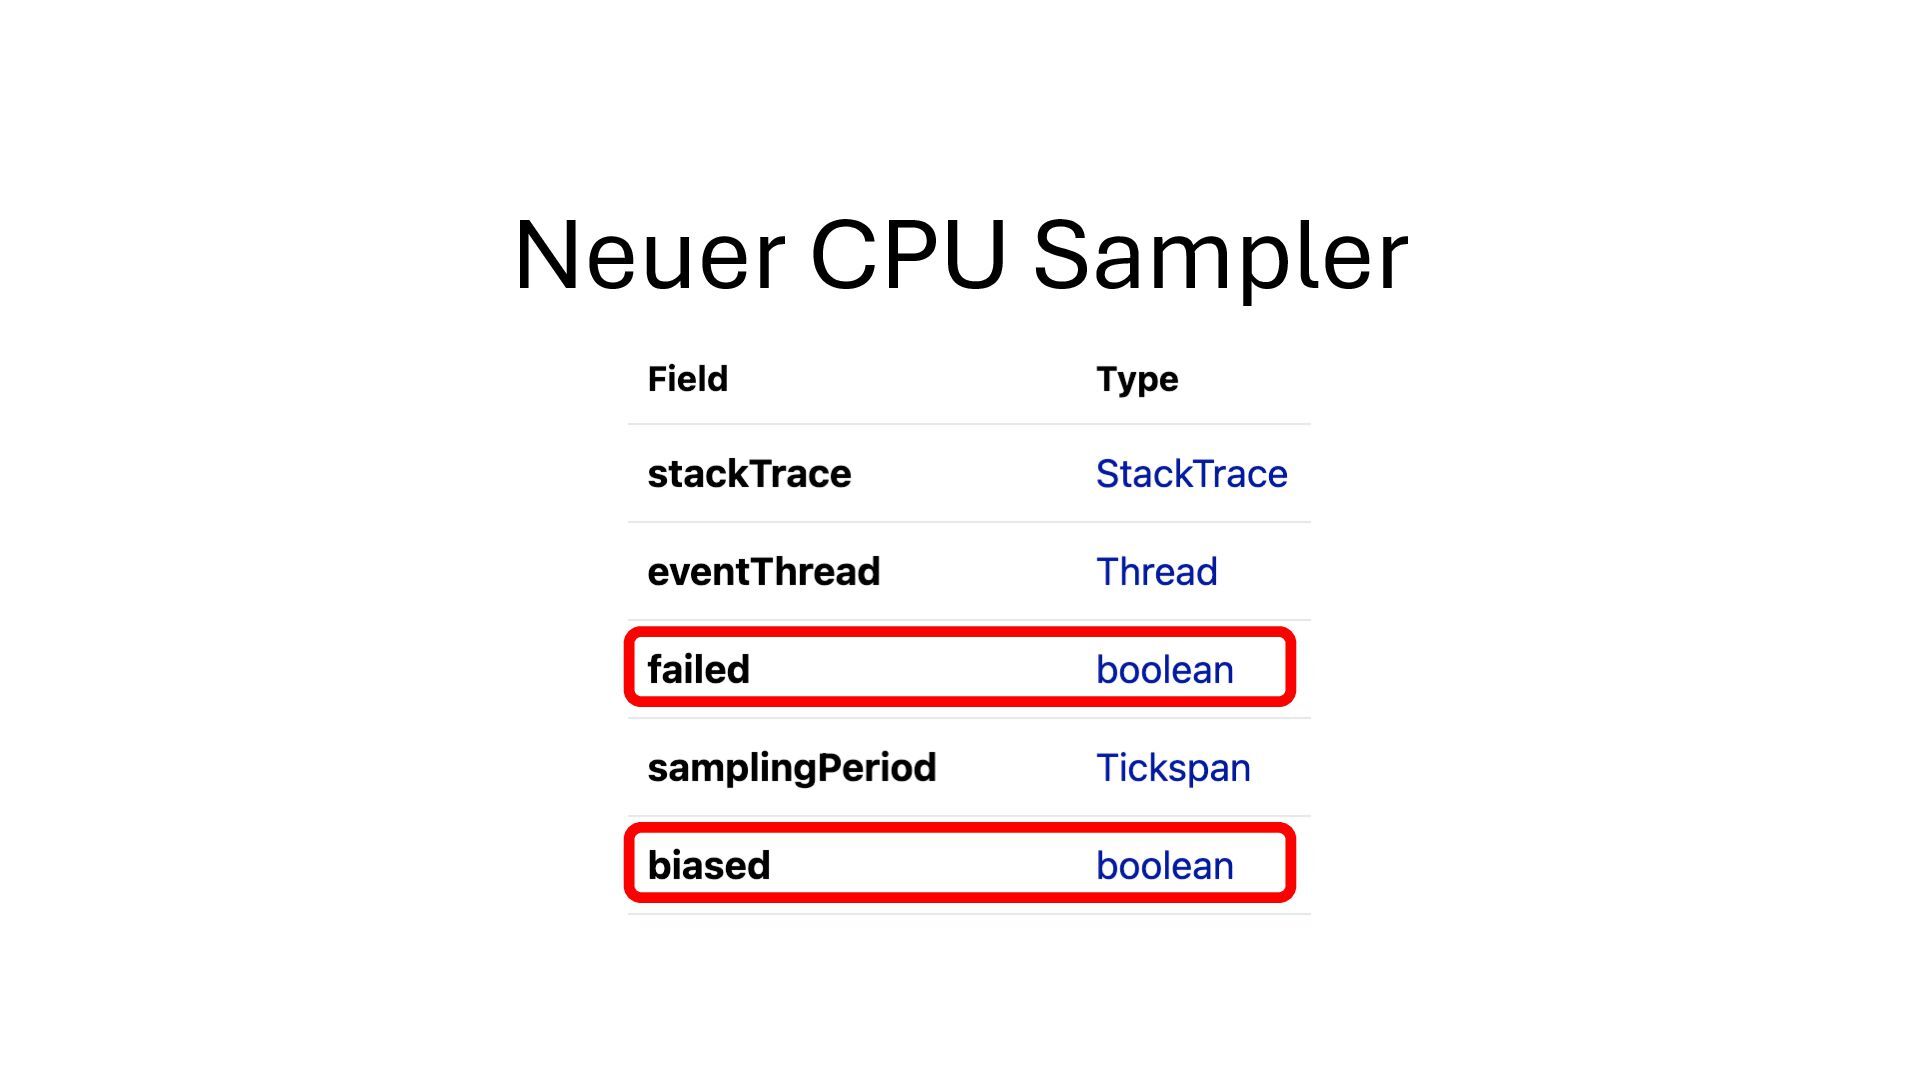
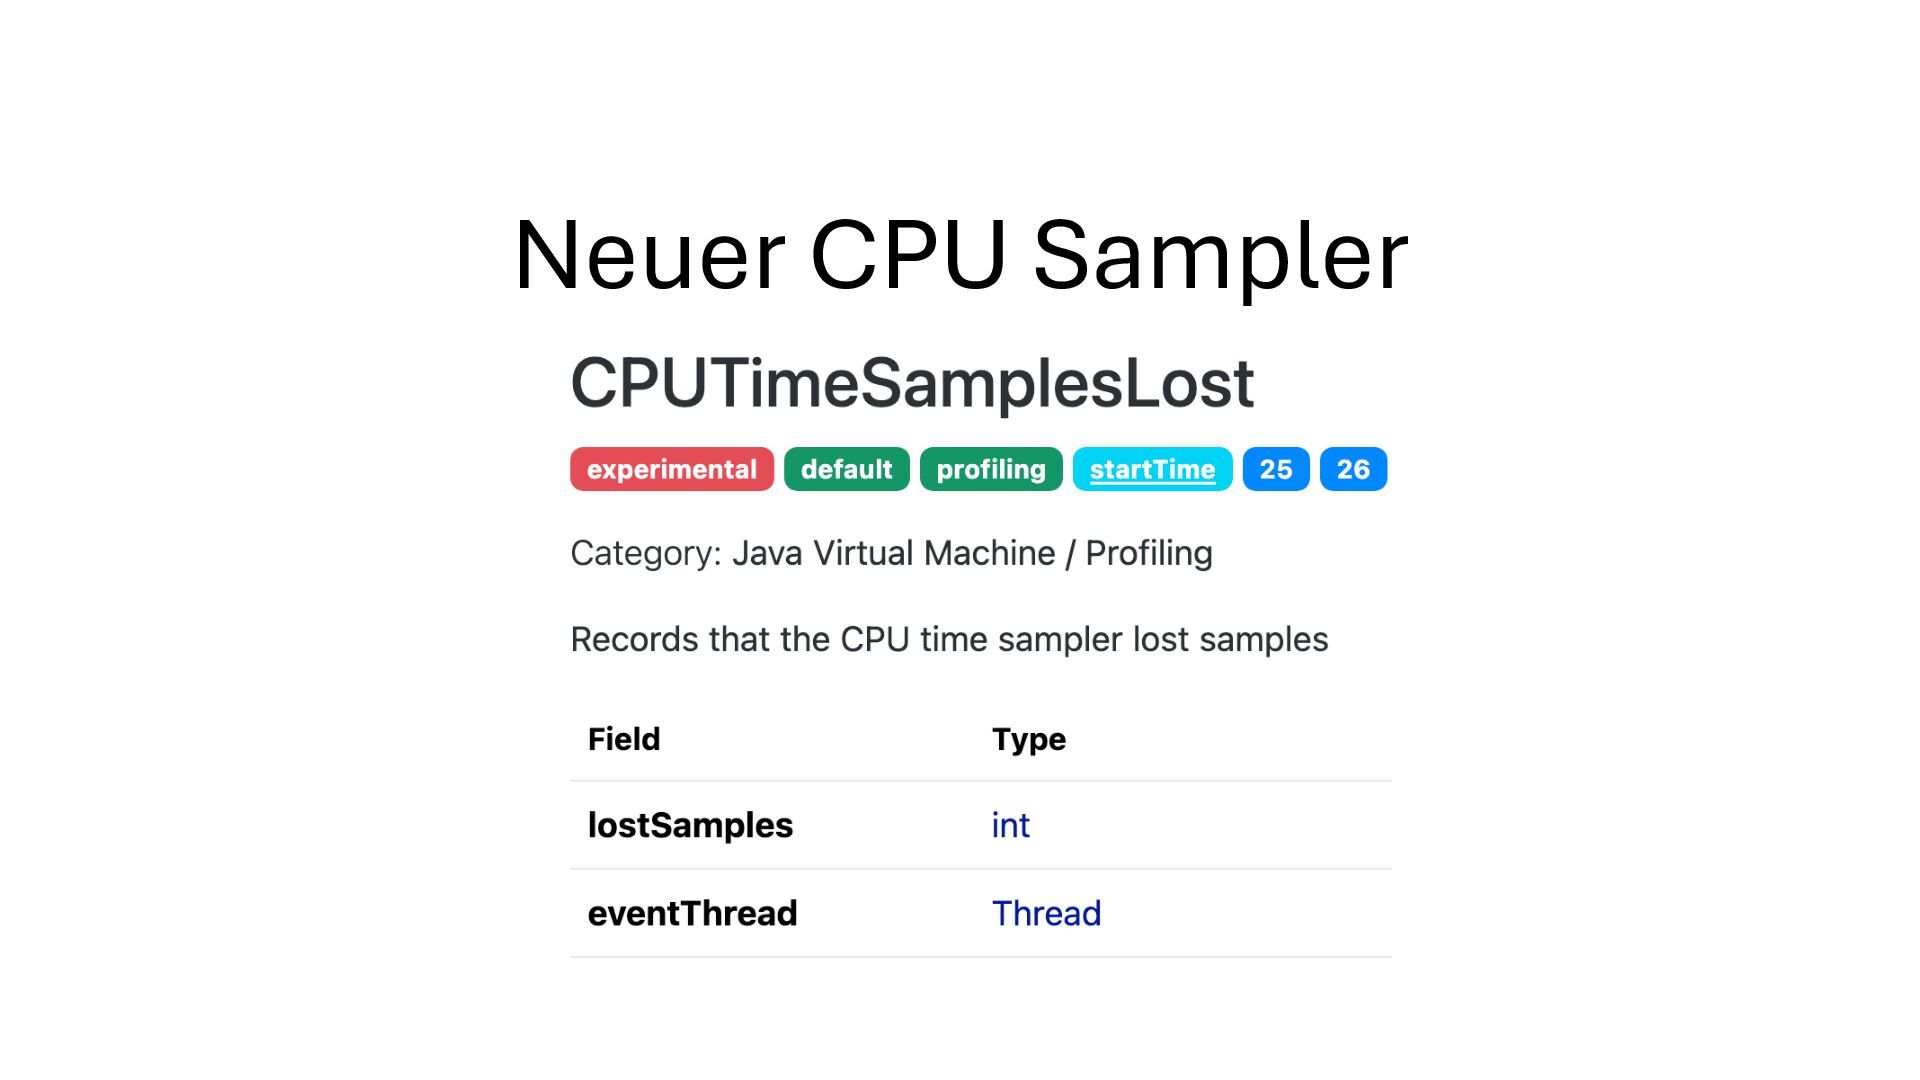
In diesem kurzen Talk stelle ich dir den neuen CPU-time Profiler in JDK 25 (JEP 509) vor. Du erfährst, warum traditionelle JFR-Execution-Time- Profile in die Irre führen können, wie CPU-time sampling unter der Haube funktioniert und wie du deine Anwendung jetzt präziser profilen kannst, ohne auf unsichere oder externe Tools angewiesen zu sein.

Egal, ob dir Performance wichtig ist oder du einfach die Durchsatz- Bottlenecks deiner App besser verstehen willst; dieser Talk vermittelt dir die Grundlagen des Profilings und zeigt, warum es mit JDK 25 einfacher ist als je zuvor.

Avatar for Johannes Bechberger

Johannes Bechberger

November 13, 2025
Tweet

More Decks by Johannes Bechberger

Other Decks in Programming

Transcript

  1. ExecutionSampleEvent each N milliseconds capture five stacktraces pick next non-blocked

    Java thread suspend thread capture the thread stack resume thread :: end Thread list Runnable Blocked Processed: 0 Captured : 0 Errors: 0 T1 T2 T3 T5 T4 Source: https://archive.fosdem.org/2025/schedule/event/fosdem-2025-4848-advancing-java-profiling-achieving-precision-and-stability-with-jfr-ebpf-and-user-context/
  2. ExecutionSampleEvent each N milliseconds capture five stacktraces pick next non-blocked

    Java thread suspend thread capture the thread stack resume thread :: end Thread list Runnable Blocked Processed: 0 Captured : 0 Errors: 0 T1 T2 T3 T5 T4
  3. ExecutionSampleEvent each N milliseconds capture five stacktraces pick next non-blocked

    Java thread suspend thread capture the thread stack resume thread :: end Thread list Runnable Blocked Processed: 1 Captured : 1 Errors: 0 T1 T2 T3 T5 T4
  4. ExecutionSampleEvent each N milliseconds capture five stacktraces pick next non-blocked

    Java thread suspend thread capture the thread stack resume thread :: end Thread list Runnable Blocked Processed: 2 Captured : 1 Errors: 0 T1 T2 T3 T5 T4
  5. ExecutionSampleEvent each N milliseconds capture five stacktraces pick next non-blocked

    Java thread suspend thread capture the thread stack resume thread :: end Thread list Runnable Blocked Processed: 2 Captured : 1 Errors: 1 T1 T2 T3 T5 T4 X
  6. ExecutionSampleEvent each N milliseconds capture five stacktraces pick next non-blocked

    Java thread suspend thread capture the thread stack resume thread :: end Thread list Runnable Blocked Processed: 3 Captured : 1 Errors: 1 T1 T2 T3 T5 T4 X
  7. ExecutionSampleEvent each N milliseconds capture five stacktraces pick next non-blocked

    Java thread suspend thread capture the thread stack resume thread :: end Thread list Runnable Blocked Processed: 3 Captured : 2 Errors: 1 T1 T2 T3 T5 T4 X
  8. ExecutionSampleEvent each N milliseconds capture five stacktraces pick next non-blocked

    Java thread suspend thread capture the thread stack resume thread :: end Thread list Runnable Blocked Processed: 6 Captured : 5 Errors: 1 T1 T2 T3 T5 T4
  9. Thread Signal In jedem CPU-Time Interval Signal Handler An jedem

    Safepoint Stacktraces ablaufen Speichern