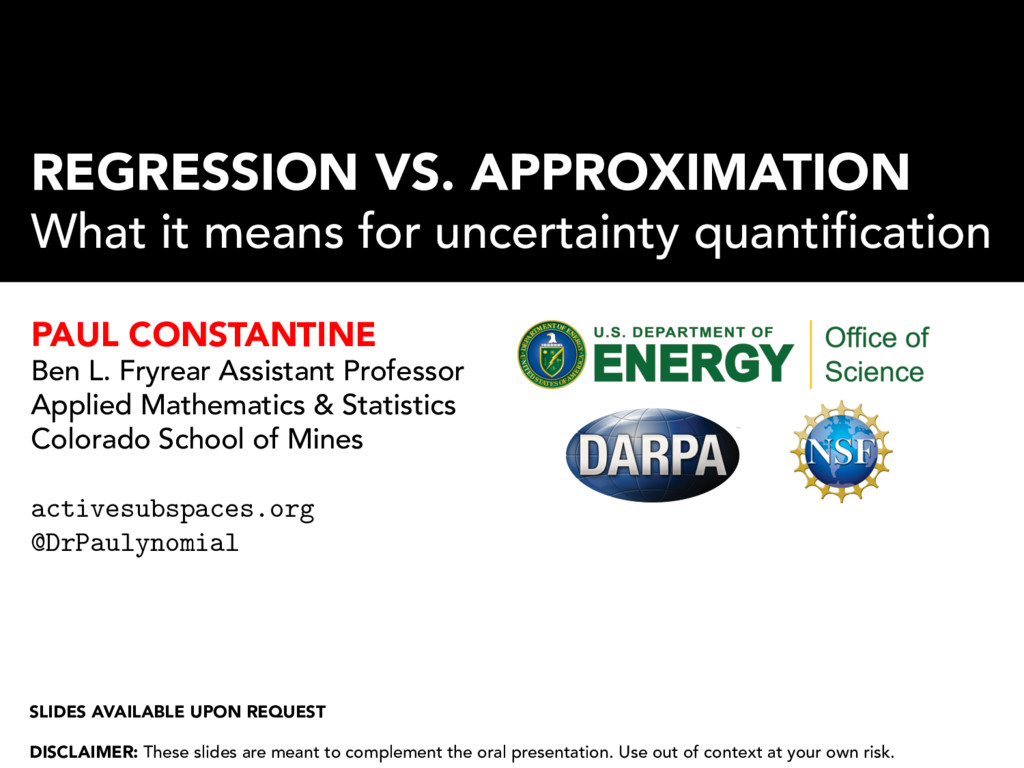
CONSTANTINE Ben L. Fryrear Assistant Professor Applied Mathematics & Statistics Colorado School of Mines activesubspaces.org! @DrPaulynomial! SLIDES AVAILABLE UPON REQUEST DISCLAIMER: These slides are meant to complement the oral presentation. Use out of context at your own risk.
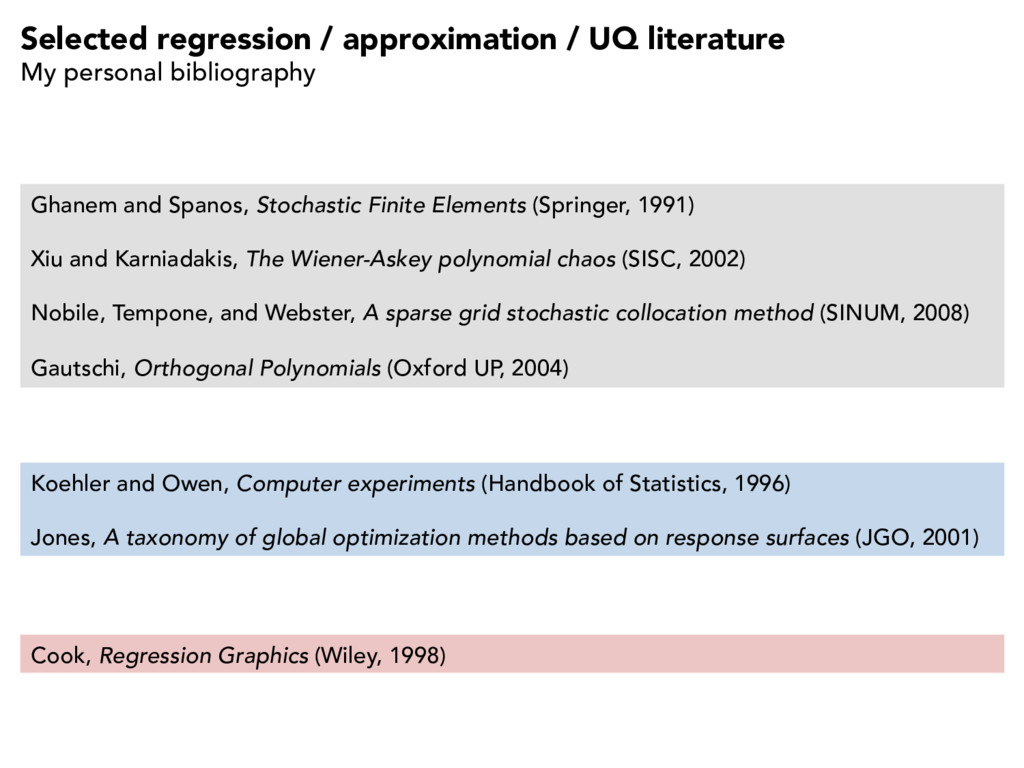
Ghanem and Spanos, Stochastic Finite Elements (Springer, 1991) Xiu and Karniadakis, The Wiener-Askey polynomial chaos (SISC, 2002) Nobile, Tempone, and Webster, A sparse grid stochastic collocation method (SINUM, 2008) Gautschi, Orthogonal Polynomials (Oxford UP, 2004) Koehler and Owen, Computer experiments (Handbook of Statistics, 1996) Jones, A taxonomy of global optimization methods based on response surfaces (JGO, 2001) Cook, Regression Graphics (Wiley, 1998)
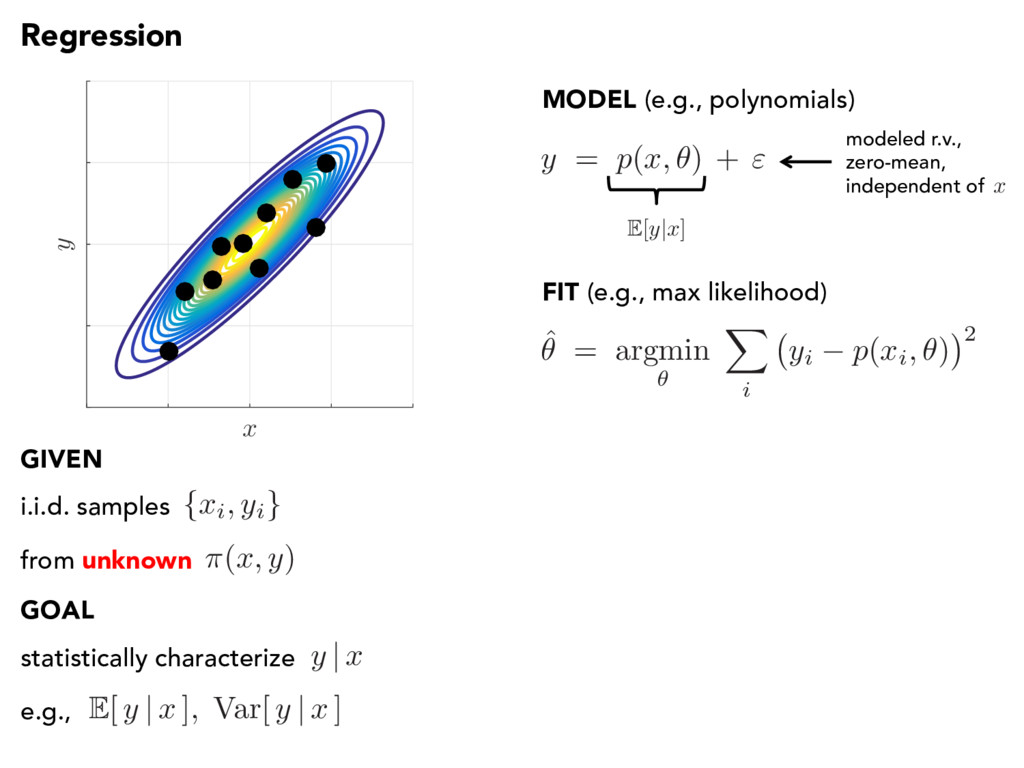
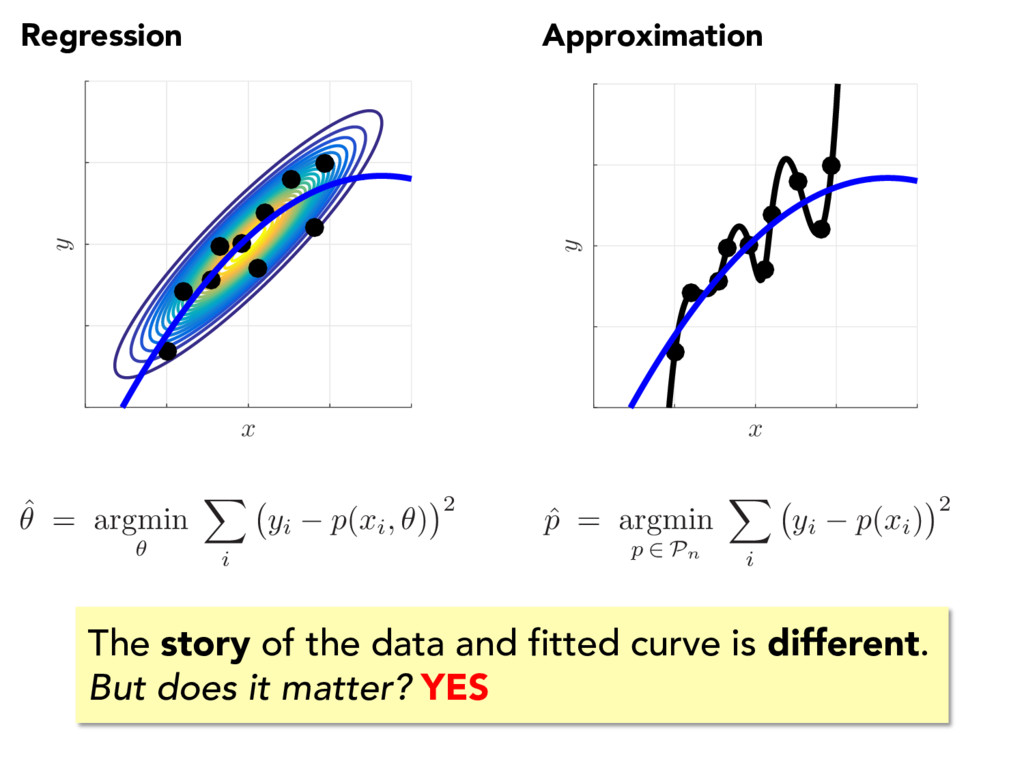
i.i.d. samples from unknown GIVEN GOAL statistically characterize y | x e.g., E[ y | x ] , Var[ y | x ] ˆ ✓ = argmin ✓ X i yi p ( xi, ✓ ) 2 y = p ( x, ✓ ) + " MODEL (e.g., polynomials) E[ y | x ] modeled r.v., zero-mean, independent of x x y FIT (e.g., max likelihood)
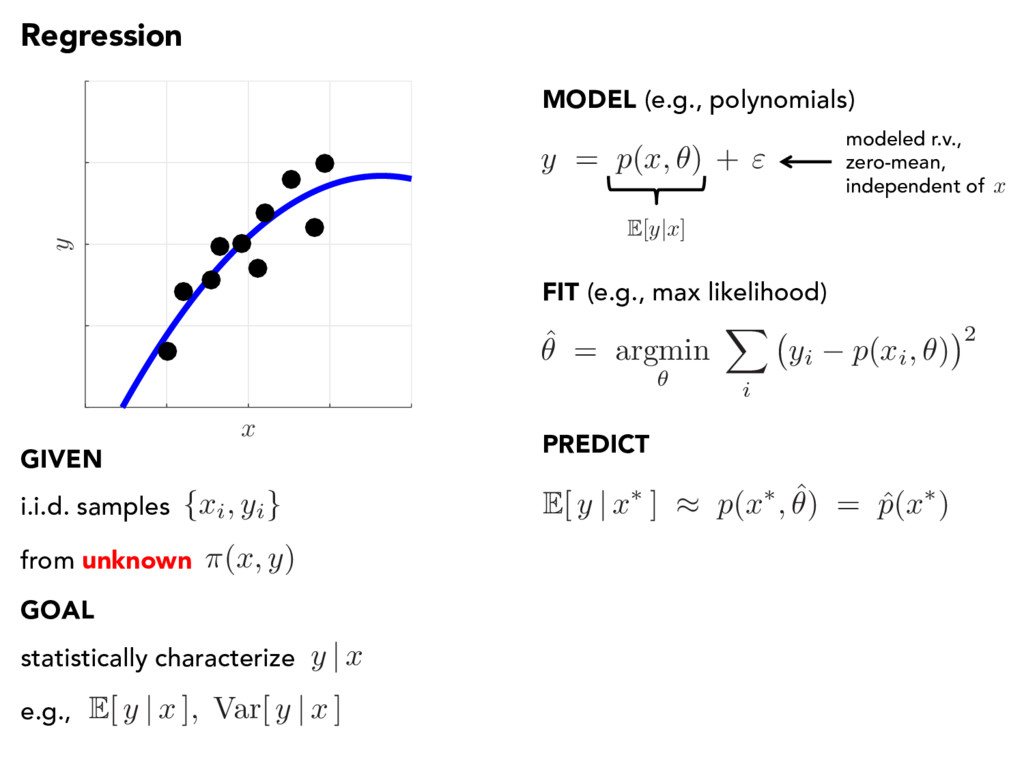
y ) i.i.d. samples from unknown GIVEN GOAL statistically characterize y | x e.g., E[ y | x ] , Var[ y | x ] ˆ ✓ = argmin ✓ X i yi p ( xi, ✓ ) 2 y = p ( x, ✓ ) + " E[ y | x ] modeled r.v., zero-mean, independent of x PREDICT E[ y | x ⇤ ] ⇡ p ( x ⇤ , ˆ ✓ ) = ˆ p ( x ⇤) MODEL (e.g., polynomials) FIT (e.g., max likelihood)
| x ⇤ ] ⇡ p ( x ⇤ , ˆ ✓ ) = ˆ p ( x ⇤) ˆ ✓ = argmin ✓ X i yi p ( xi, ✓ ) 2 y = p ( x, ✓ ) + " Regression x y { xi, yi } ⇡ ( x, y ) i.i.d. samples from unknown GIVEN GOAL statistically characterize y | x e.g., E[ y | x ] , Var[ y | x ] E[ y | x ] modeled r.v., zero-mean, independent of x FIT (e.g., max likelihood) PREDICT QUANTIFY UNCERTAINTY MODEL (e.g., polynomials)
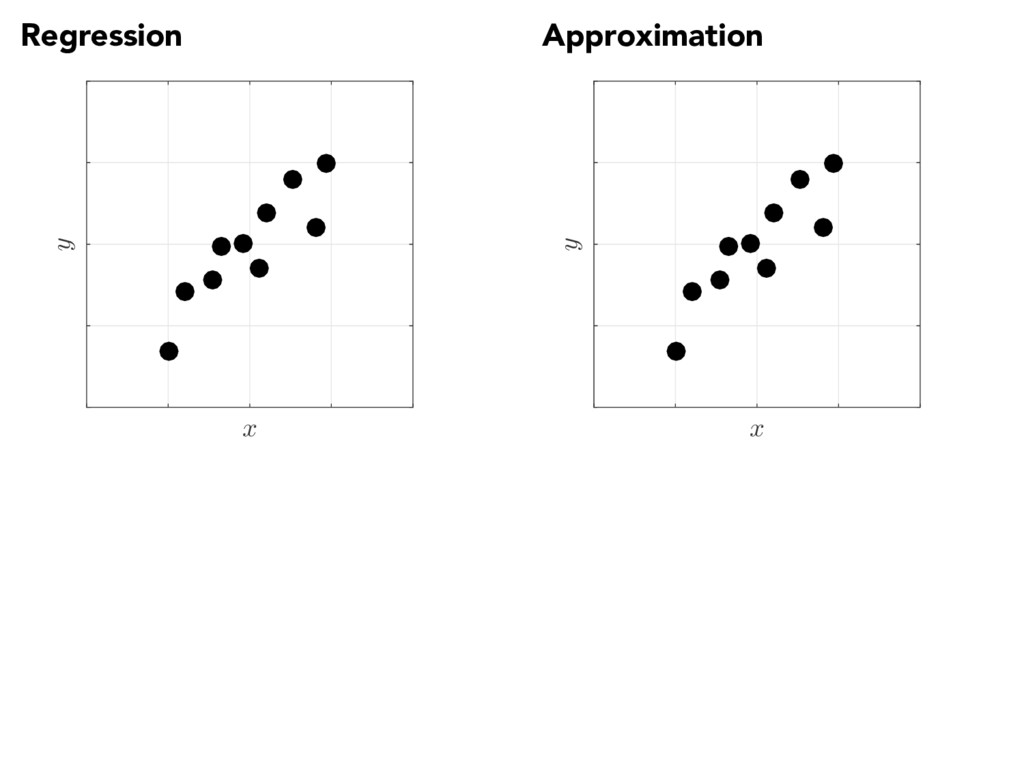
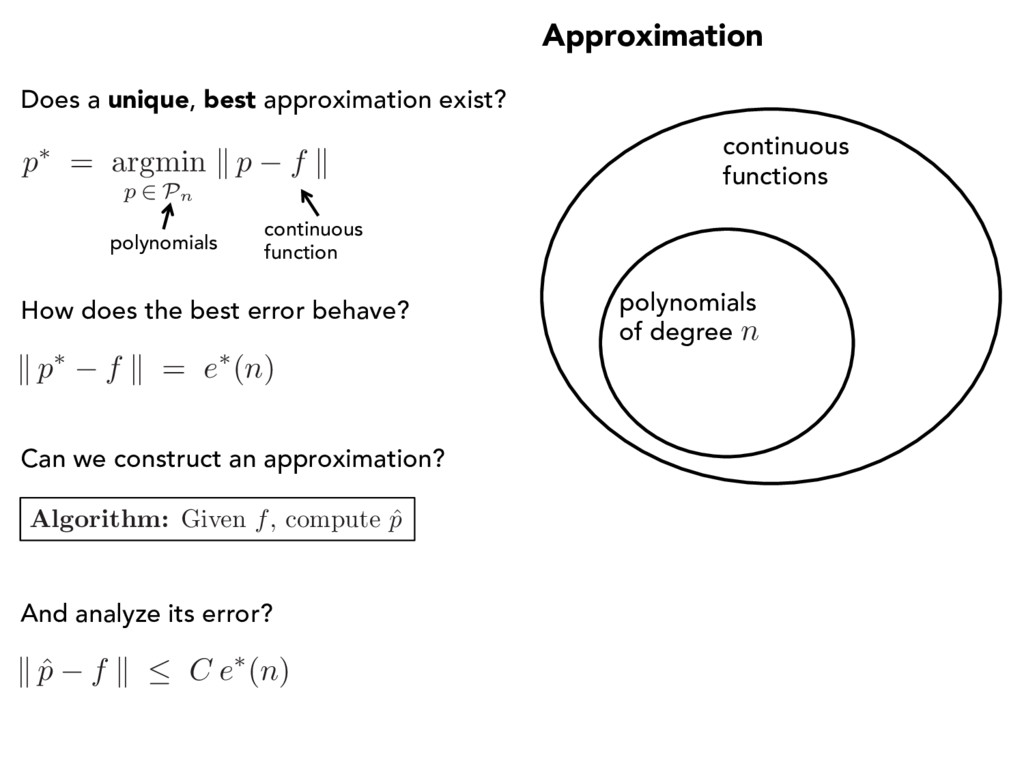
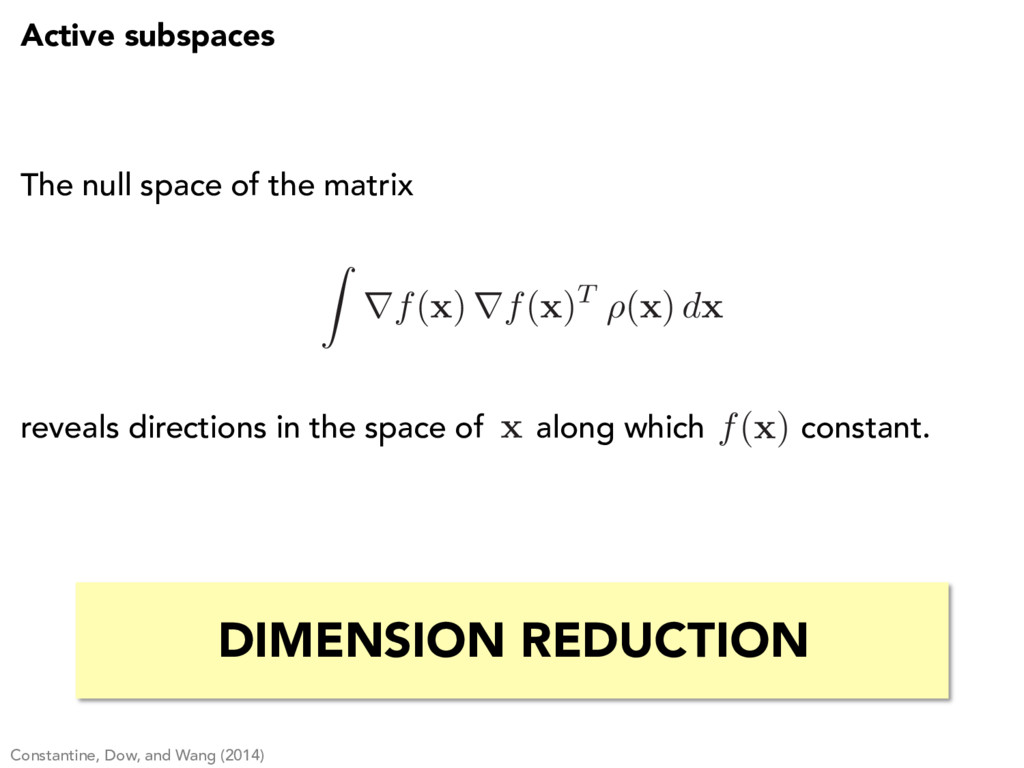
of degree n p⇤ = argmin p 2 Pn k p f k Does a unique, best approximation exist? polynomials How does the best error behave? continuous function Can we construct an approximation? Algorithm: Given f , compute ˆ p k ˆ p f k C e⇤(n) And analyze its error?
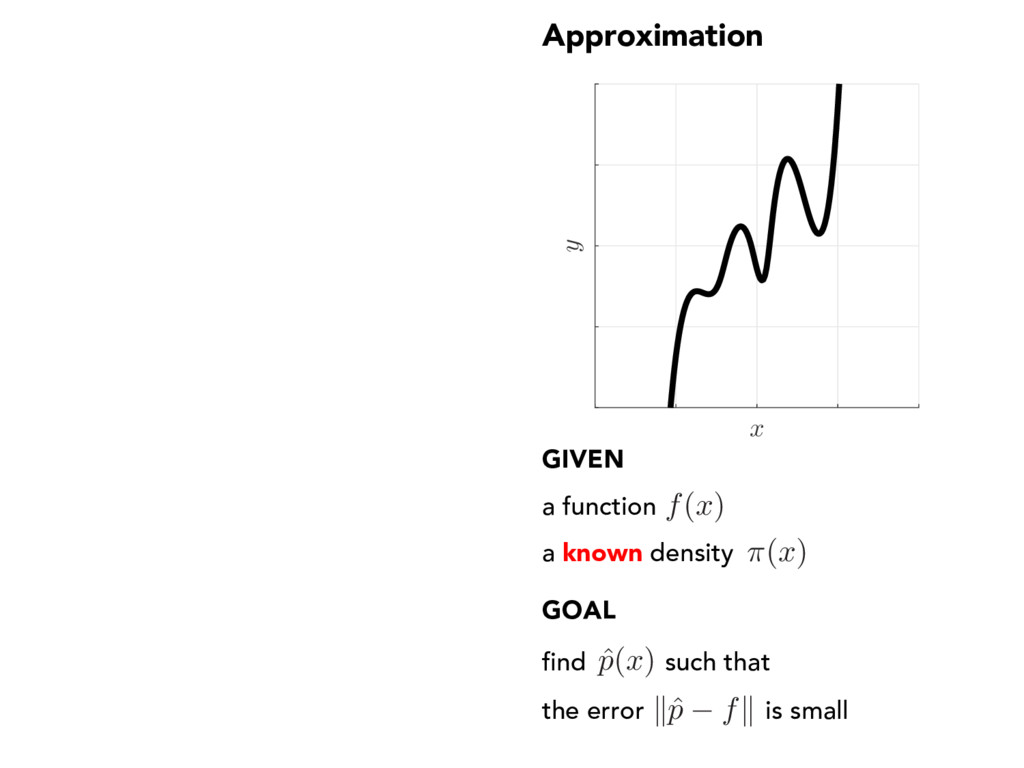
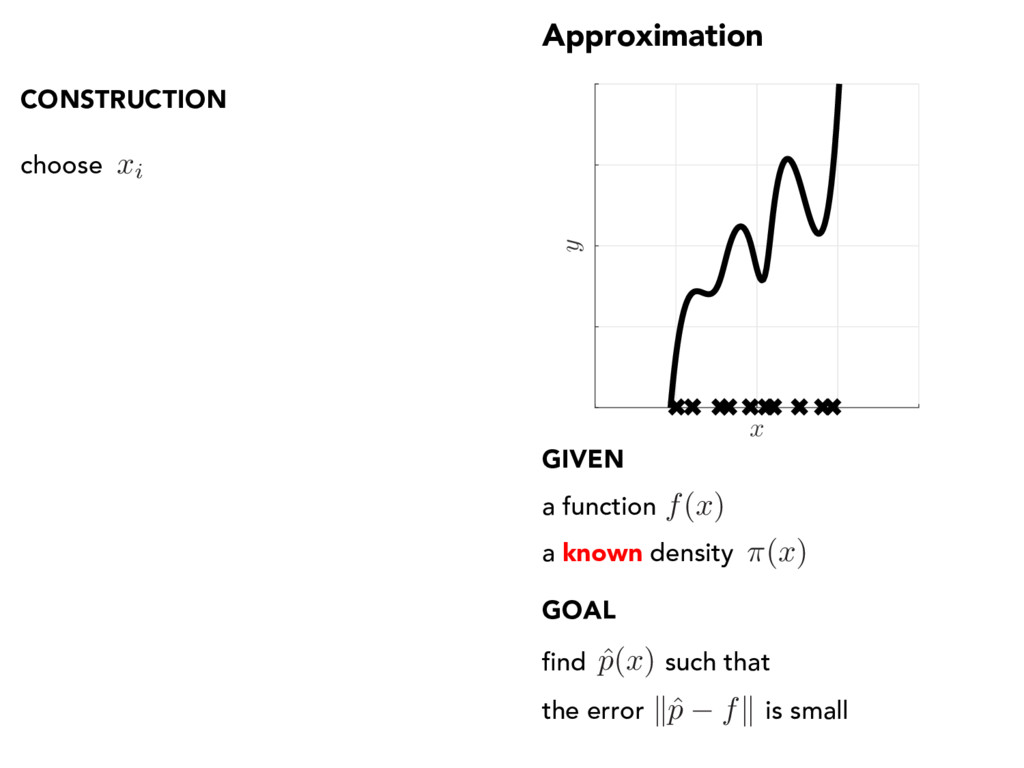
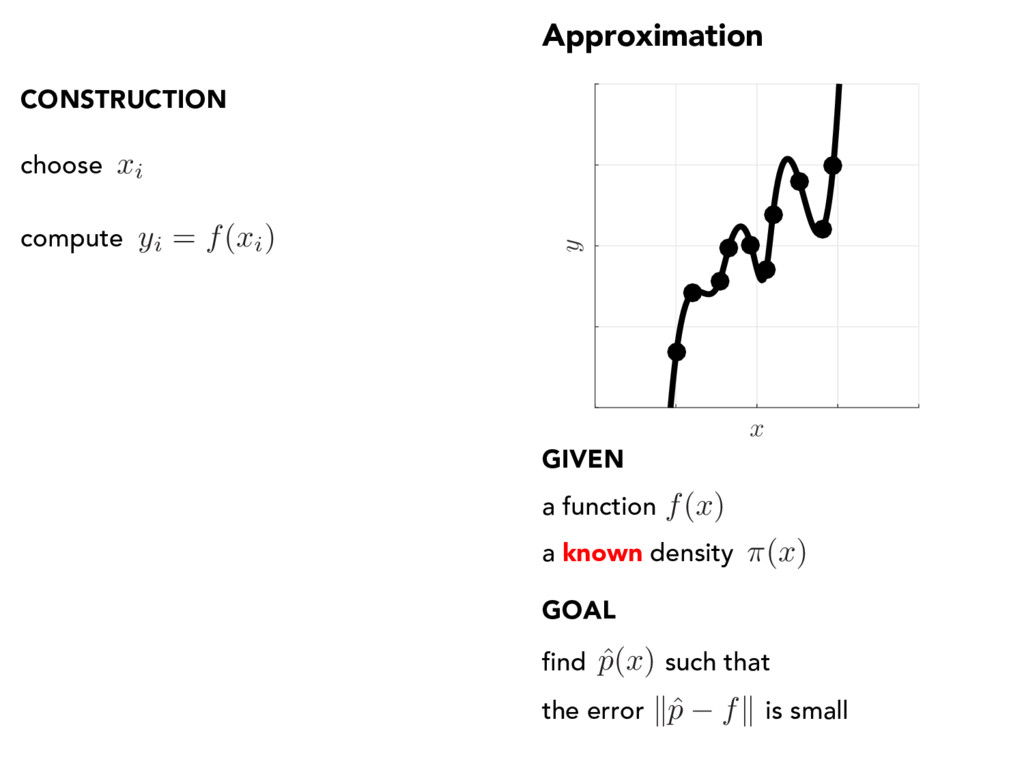
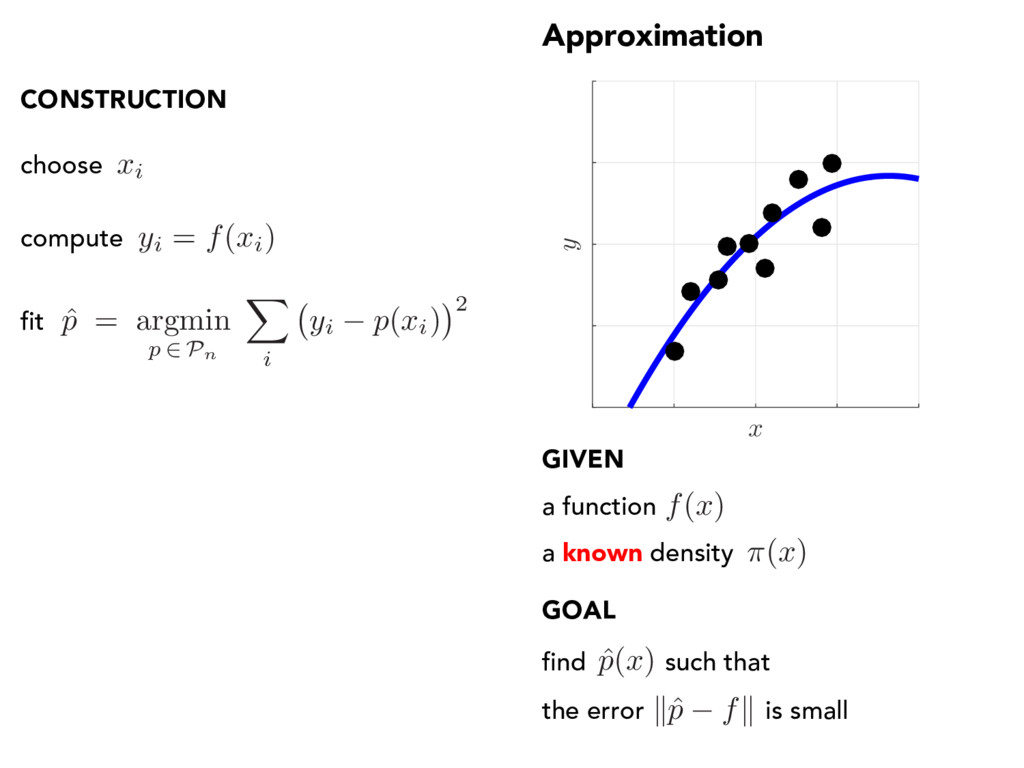
x ) find such that the error is small a known density CONSTRUCTION choose ˆ p ( x ) xi compute yi = f ( xi) fit ˆ p = argmin p 2 Pn X i yi p ( xi) 2 a function f ( x )
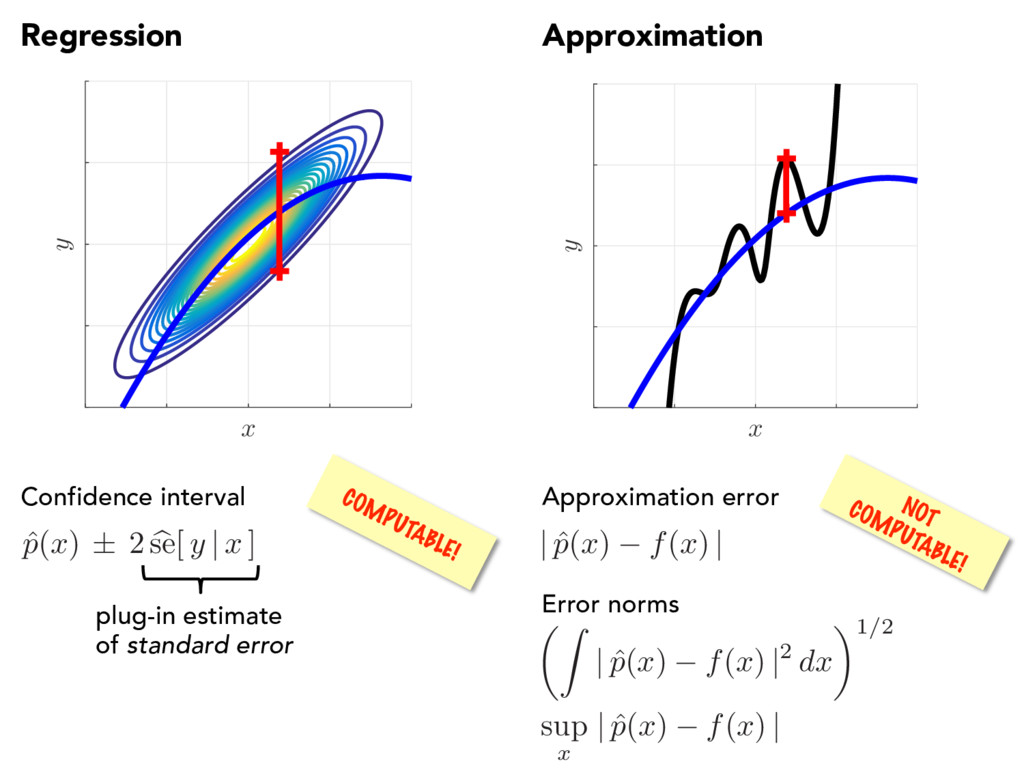
p ( x ) f ( x ) | sup x | ˆ p ( x ) f ( x ) | ✓Z | ˆ p ( x ) f ( x ) |2 dx ◆1/2 Error norms Confidence interval ˆ p ( x ) ± 2 b se[ y | x ] plug-in estimate of standard error
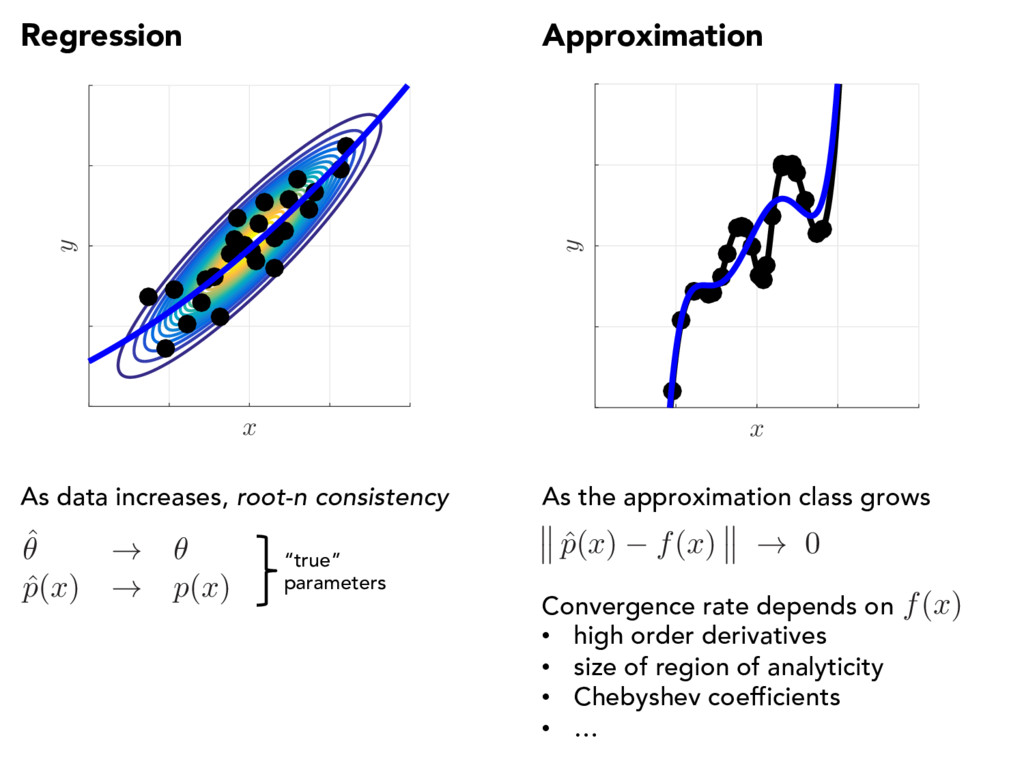
ˆ p ( x ) ! p ( x ) “true” parameters As data increases, root-n consistency ˆ p ( x ) f ( x ) ! 0 As the approximation class grows Convergence rate depends on • high order derivatives • size of region of analyticity • Chebyshev coefficients • … f ( x )
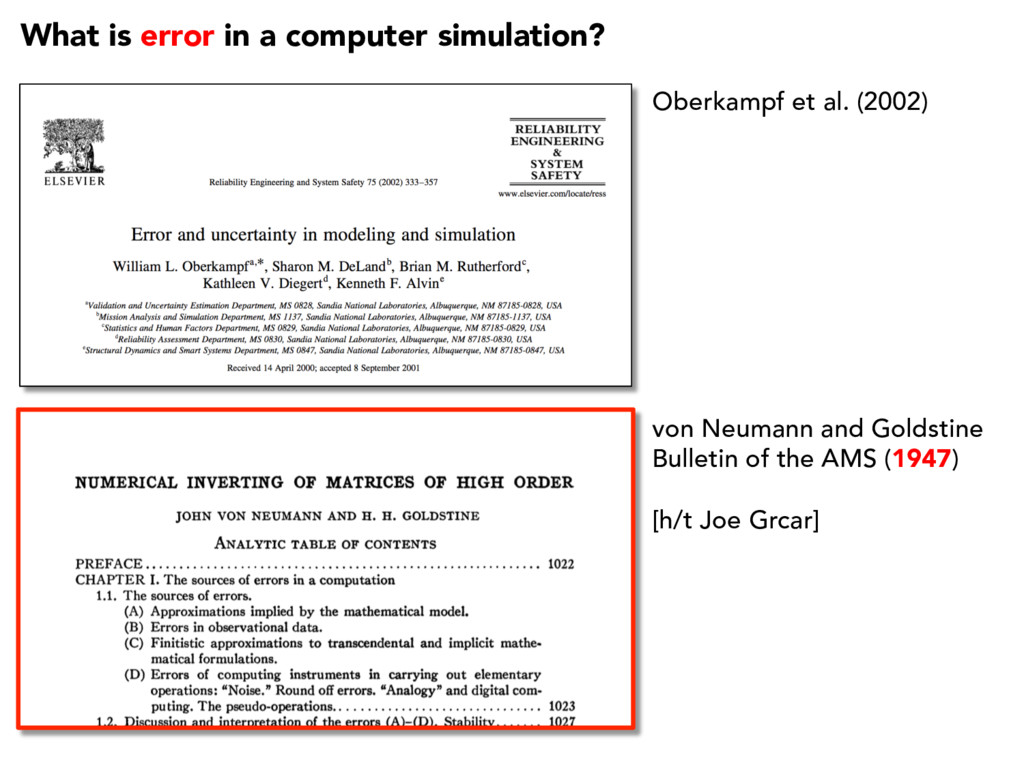
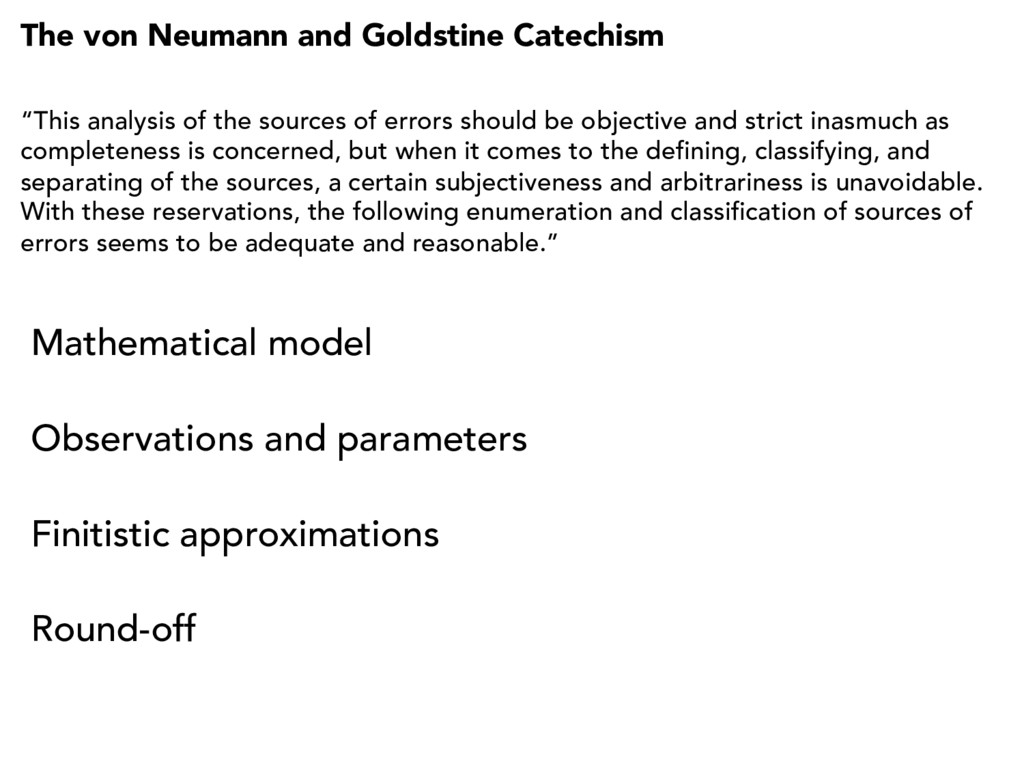
and strict inasmuch as completeness is concerned, but when it comes to the defining, classifying, and separating of the sources, a certain subjectiveness and arbitrariness is unavoidable. With these reservations, the following enumeration and classification of sources of errors seems to be adequate and reasonable.” Mathematical model Observations and parameters Finitistic approximations Round-off The von Neumann and Goldstine Catechism
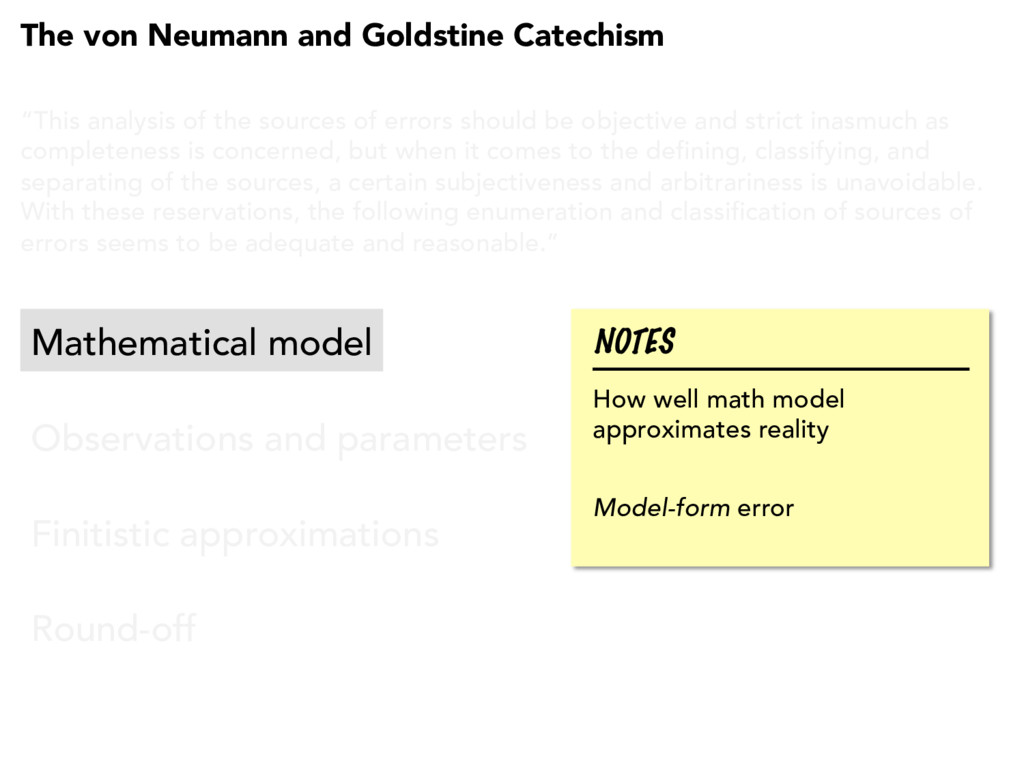
and strict inasmuch as completeness is concerned, but when it comes to the defining, classifying, and separating of the sources, a certain subjectiveness and arbitrariness is unavoidable. With these reservations, the following enumeration and classification of sources of errors seems to be adequate and reasonable.” Mathematical model Observations and parameters Finitistic approximations Round-off The von Neumann and Goldstine Catechism NOTES How well math model approximates reality Model-form error
and strict inasmuch as completeness is concerned, but when it comes to the defining, classifying, and separating of the sources, a certain subjectiveness and arbitrariness is unavoidable. With these reservations, the following enumeration and classification of sources of errors seems to be adequate and reasonable.” Mathematical model Observations and parameters Finitistic approximations Round-off The von Neumann and Goldstine Catechism NOTES Forward and inverse UQ Most of the UQ methods literature
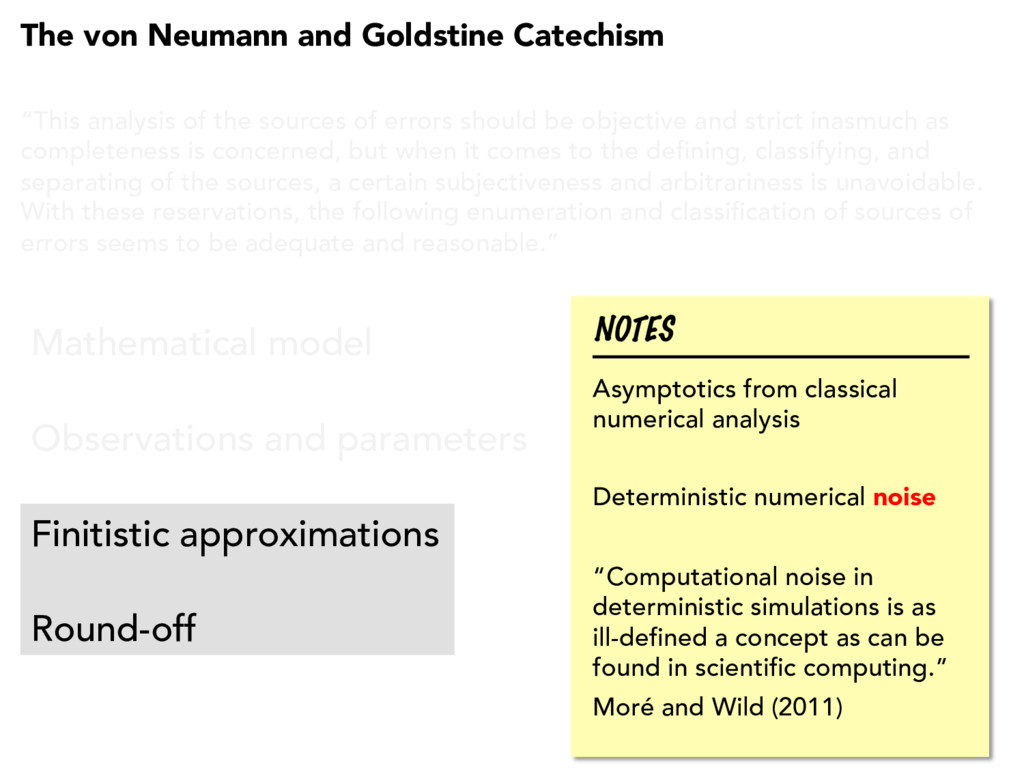
and strict inasmuch as completeness is concerned, but when it comes to the defining, classifying, and separating of the sources, a certain subjectiveness and arbitrariness is unavoidable. With these reservations, the following enumeration and classification of sources of errors seems to be adequate and reasonable.” Mathematical model Observations and parameters Finitistic approximations Round-off The von Neumann and Goldstine Catechism NOTES Asymptotics from classical numerical analysis Deterministic numerical noise “Computational noise in deterministic simulations is as ill-defined a concept as can be found in scientific computing.” Moré and Wild (2011)
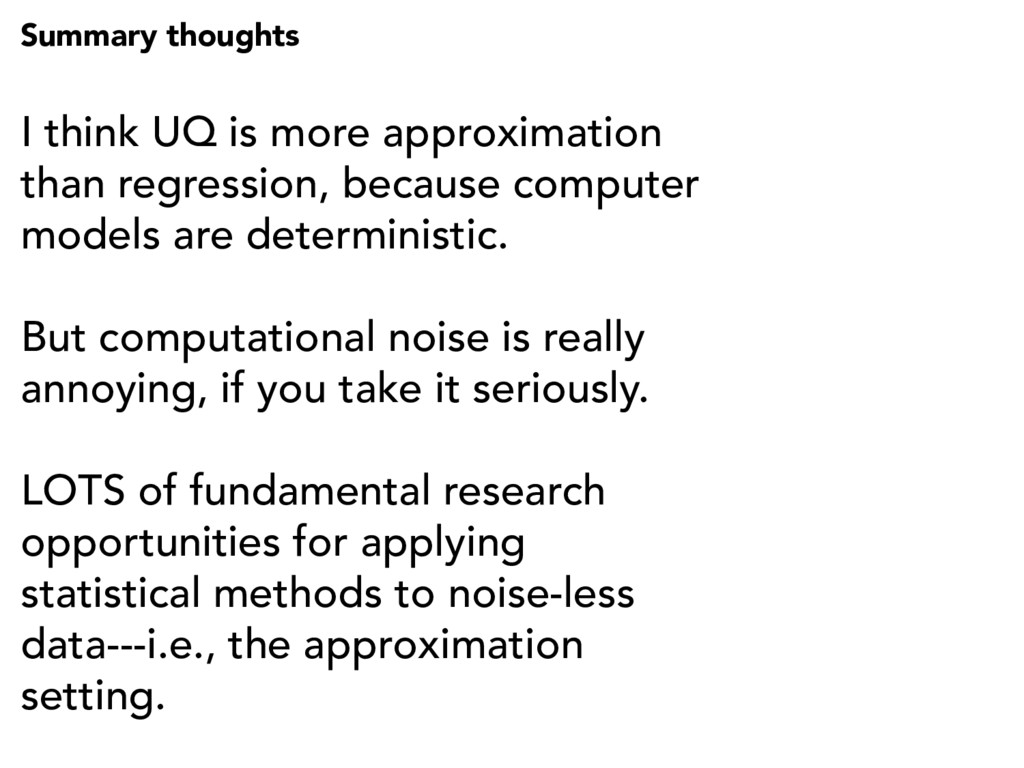
models are deterministic. But computational noise is really annoying, if you take it seriously. LOTS of fundamental research opportunities for applying statistical methods to noise-less data---i.e., the approximation setting. Summary thoughts
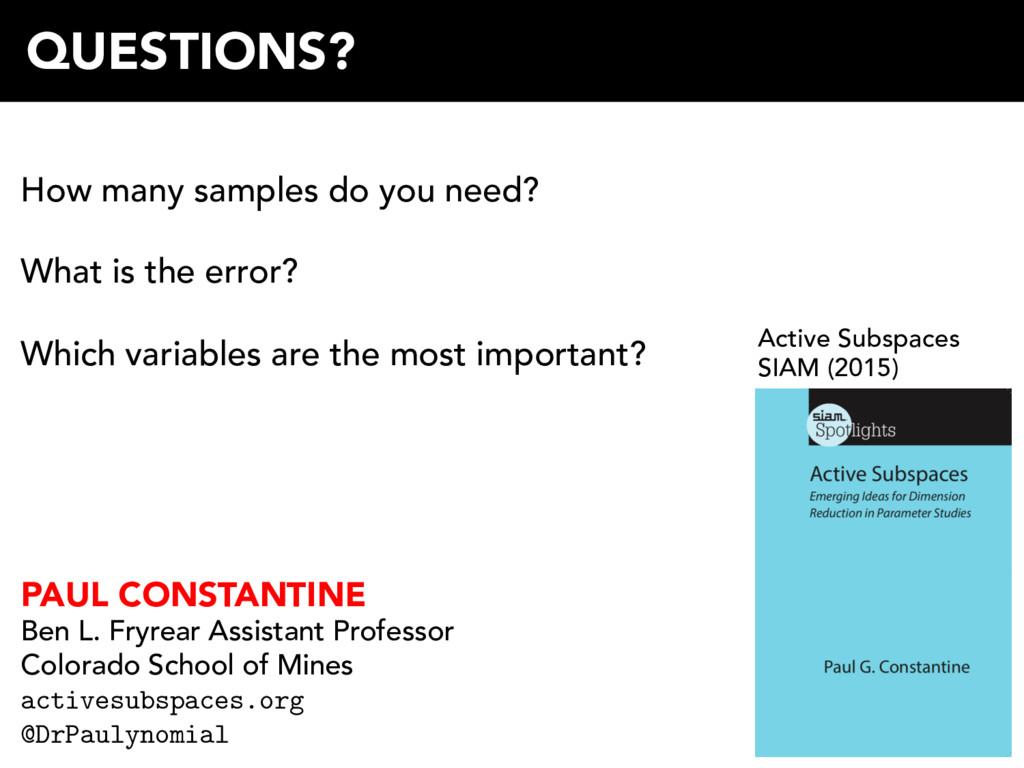
Mines activesubspaces.org! @DrPaulynomial! QUESTIONS? Active Subspaces SIAM (2015) How many samples do you need? What is the error? Which variables are the most important?
![Var[ y | x ⇤ ] ⇡ “formula” E[ y](https://files.speakerdeck.com/presentations/a334eb2e738243efbcf38ec305e07359/slide_8.jpg)