study from the above paper, which is a very nice read, that studies the notion of “nearest neighbor” for a set of points in high dimensions. This paper comes from the database literature, where nearest neighbor queries are often used. However, I’m interested in this work as it relates to choosing points in a high-dimensional input space to study the behavior or characterize properties of a function of several variables---e.g., integration, approximation / interpolation, and optimization. This study was inspired by Brian Reich, who stated the following aphorism to me a few years ago: “There’s no such thing as neighbors in high dimensions.” PAUL CONSTANTINE University of Colorado [email protected]
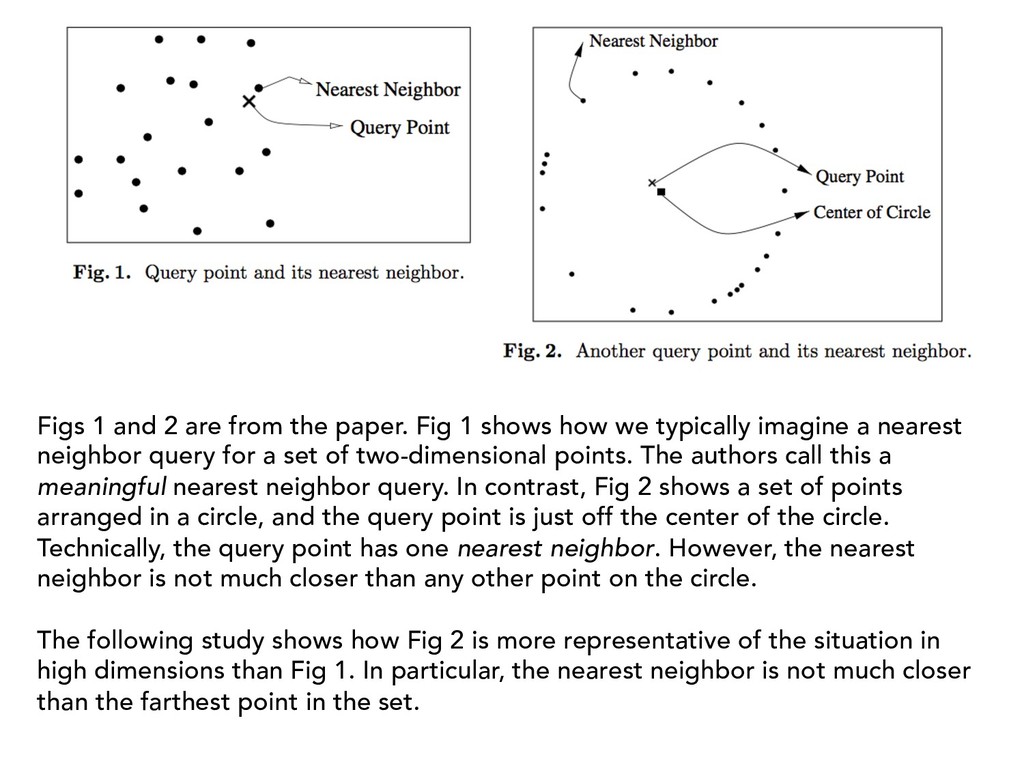
shows how we typically imagine a nearest neighbor query for a set of two-dimensional points. The authors call this a meaningful nearest neighbor query. In contrast, Fig 2 shows a set of points arranged in a circle, and the query point is just off the center of the circle. Technically, the query point has one nearest neighbor. However, the nearest neighbor is not much closer than any other point on the circle. The following study shows how Fig 2 is more representative of the situation in high dimensions than Fig 1. In particular, the nearest neighbor is not much closer than the farthest point in the set.
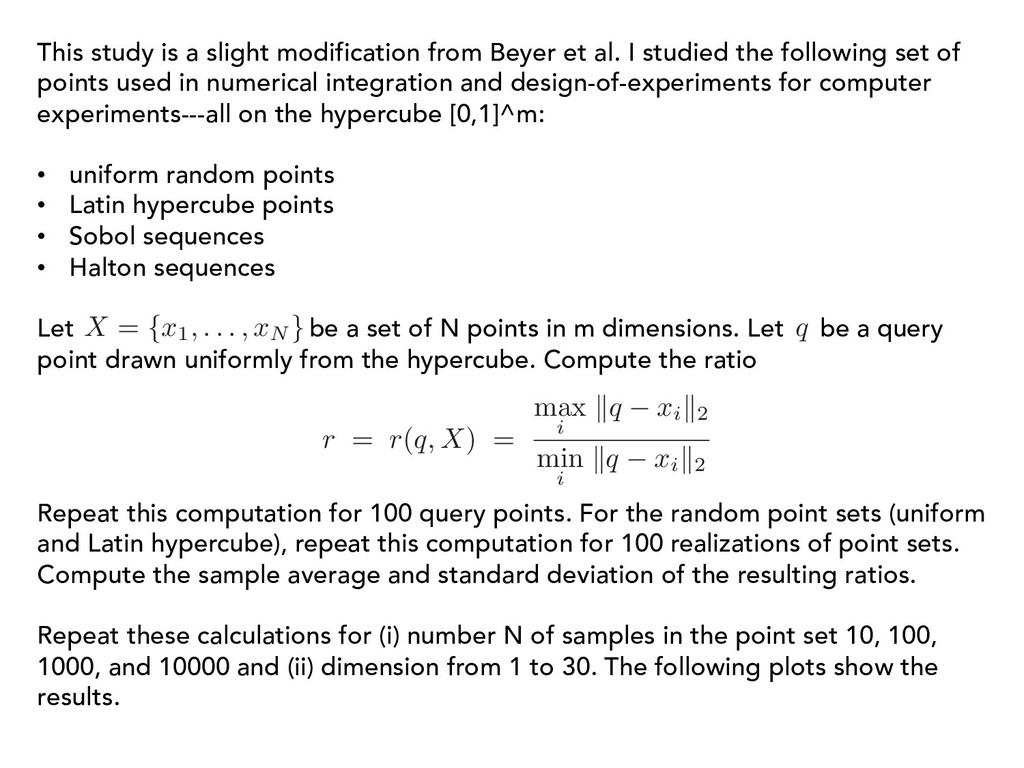
I studied the following set of points used in numerical integration and design-of-experiments for computer experiments---all on the hypercube [0,1]^m: • uniform random points • Latin hypercube points • Sobol sequences • Halton sequences Let be a set of N points in m dimensions. Let be a query point drawn uniformly from the hypercube. Compute the ratio Repeat this computation for 100 query points. For the random point sets (uniform and Latin hypercube), repeat this computation for 100 realizations of point sets. Compute the sample average and standard deviation of the resulting ratios. Repeat these calculations for (i) number N of samples in the point set 10, 100, 1000, and 10000 and (ii) dimension from 1 to 30. The following plots show the results. X = { x1, . . . , xN } q r = r(q, X) = max i k q xi k2 min i k q xi k2
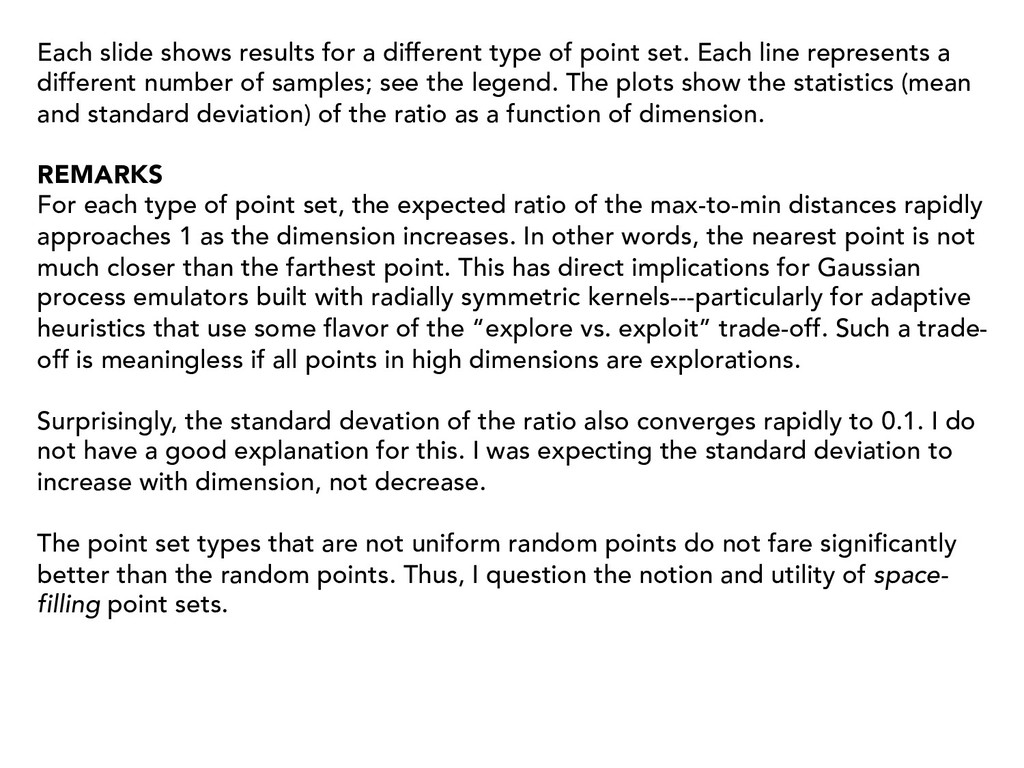
set. Each line represents a different number of samples; see the legend. The plots show the statistics (mean and standard deviation) of the ratio as a function of dimension. REMARKS For each type of point set, the expected ratio of the max-to-min distances rapidly approaches 1 as the dimension increases. In other words, the nearest point is not much closer than the farthest point. This has direct implications for Gaussian process emulators built with radially symmetric kernels---particularly for adaptive heuristics that use some flavor of the “explore vs. exploit” trade-off. Such a trade- off is meaningless if all points in high dimensions are explorations. Surprisingly, the standard devation of the ratio also converges rapidly to 0.1. I do not have a good explanation for this. I was expecting the standard deviation to increase with dimension, not decrease. The point set types that are not uniform random points do not fare significantly better than the random points. Thus, I question the notion and utility of space- filling point sets.
![Uniform random points in [0,1]^m 0 5 10 15 20](https://files.speakerdeck.com/presentations/6cc64188584346adb82ccfda0cce7d56/slide_4.jpg)
![Latin hypercube points in [0,1]^m 0 5 10 15 20](https://files.speakerdeck.com/presentations/6cc64188584346adb82ccfda0cce7d56/slide_5.jpg)
![Sobol sequence in [0,1]^m 0 5 10 15 20 25](https://files.speakerdeck.com/presentations/6cc64188584346adb82ccfda0cce7d56/slide_6.jpg)
![Halton sequence in [0,1]^m 0 5 10 15 20 25](https://files.speakerdeck.com/presentations/6cc64188584346adb82ccfda0cce7d56/slide_7.jpg)