Iris for novel analysis • Opportunities for combining Iris with other tools Audience of this talk: • Those who write code to do data analysis and visualisation
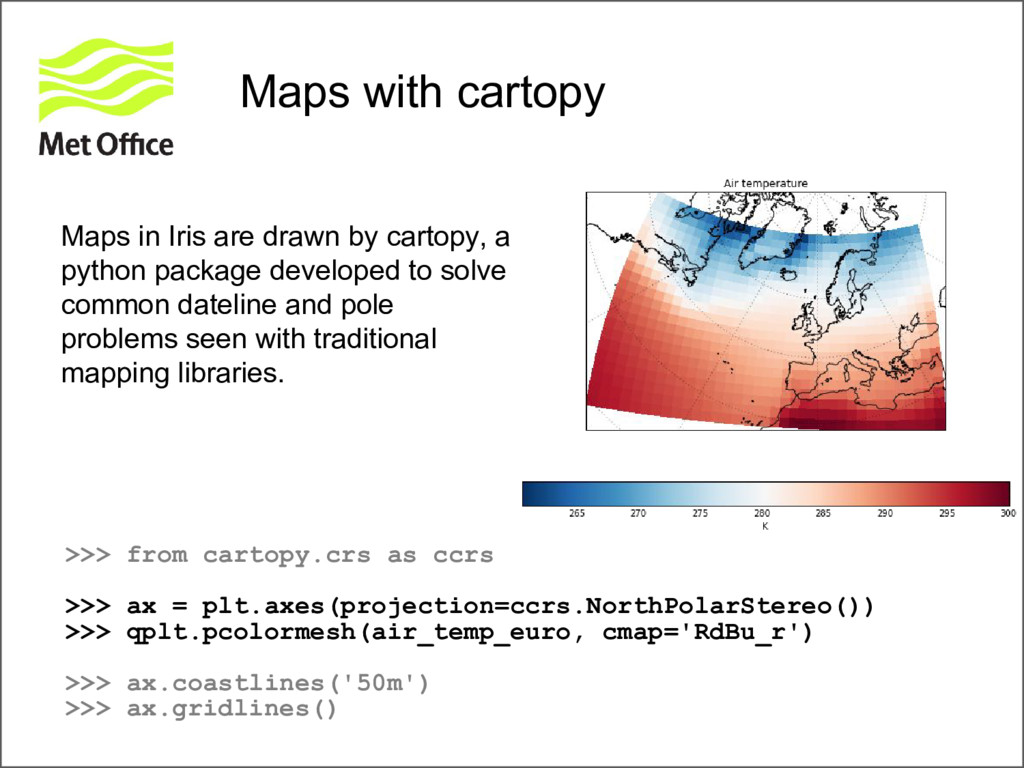
qplt.pcolormesh(air_temp_euro, cmap='RdBu_r') >>> ax.coastlines('50m') >>> ax.gridlines() Maps with cartopy Maps in Iris are drawn by cartopy, a python package developed to solve common dateline and pole problems seen with traditional mapping libraries.
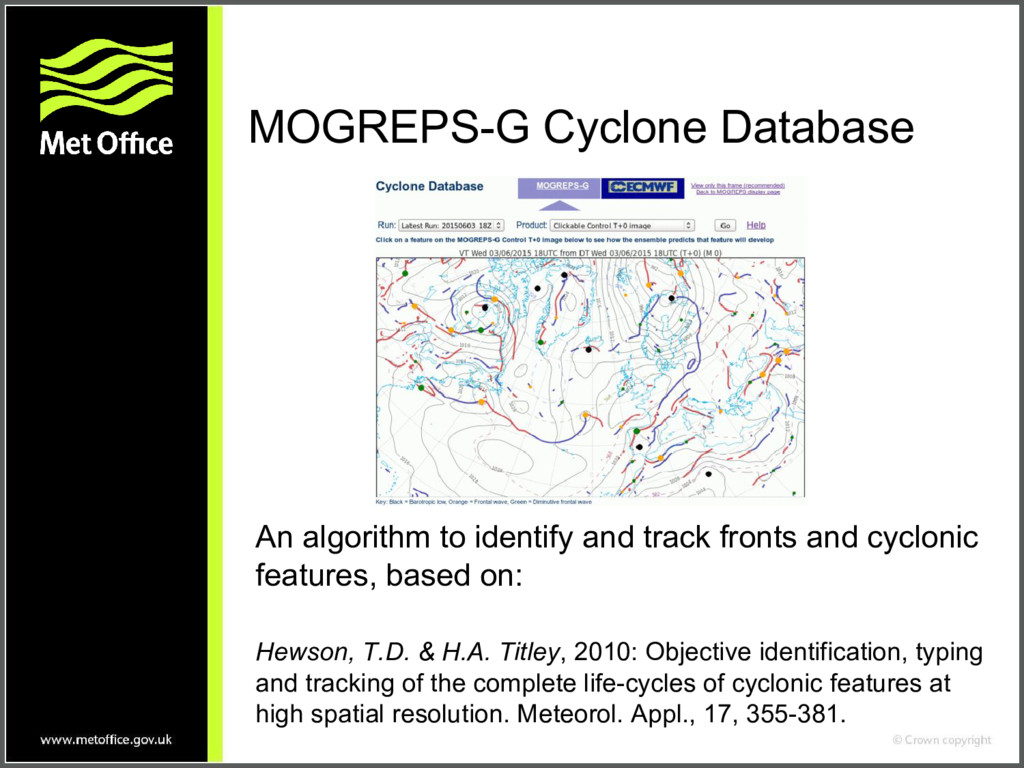
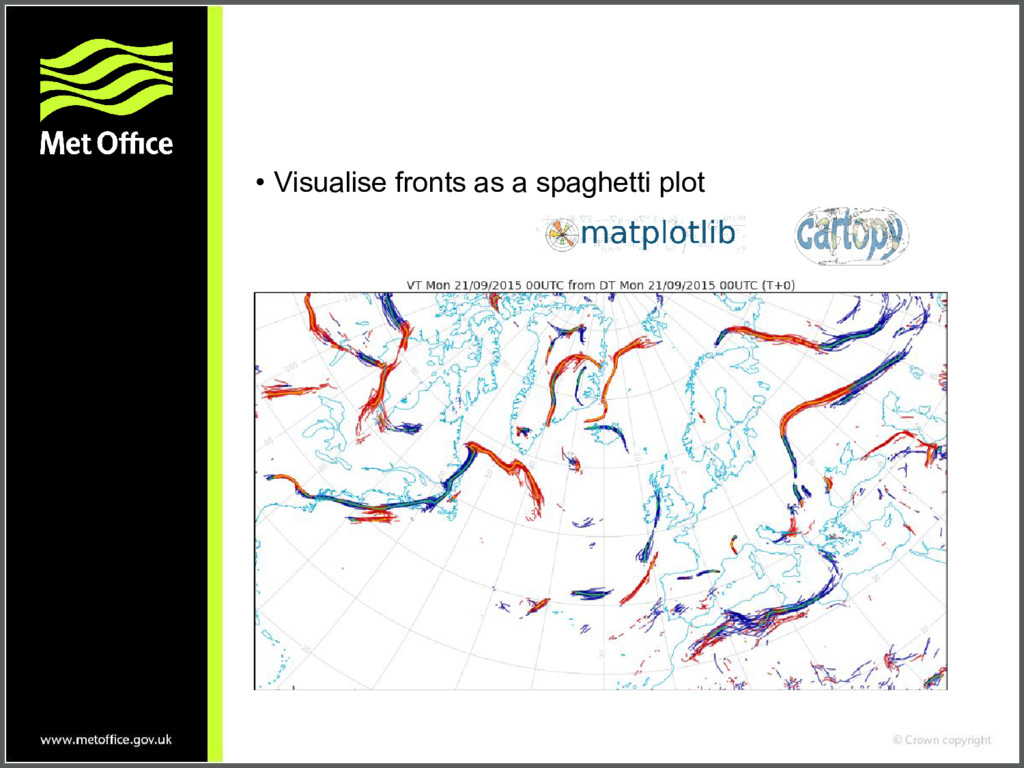
and cyclonic features, based on: Hewson, T.D. & H.A. Titley, 2010: Objective identification, typing and tracking of the complete life-cycles of cyclonic features at high spatial resolution. Meteorol. Appl., 17, 355-381.
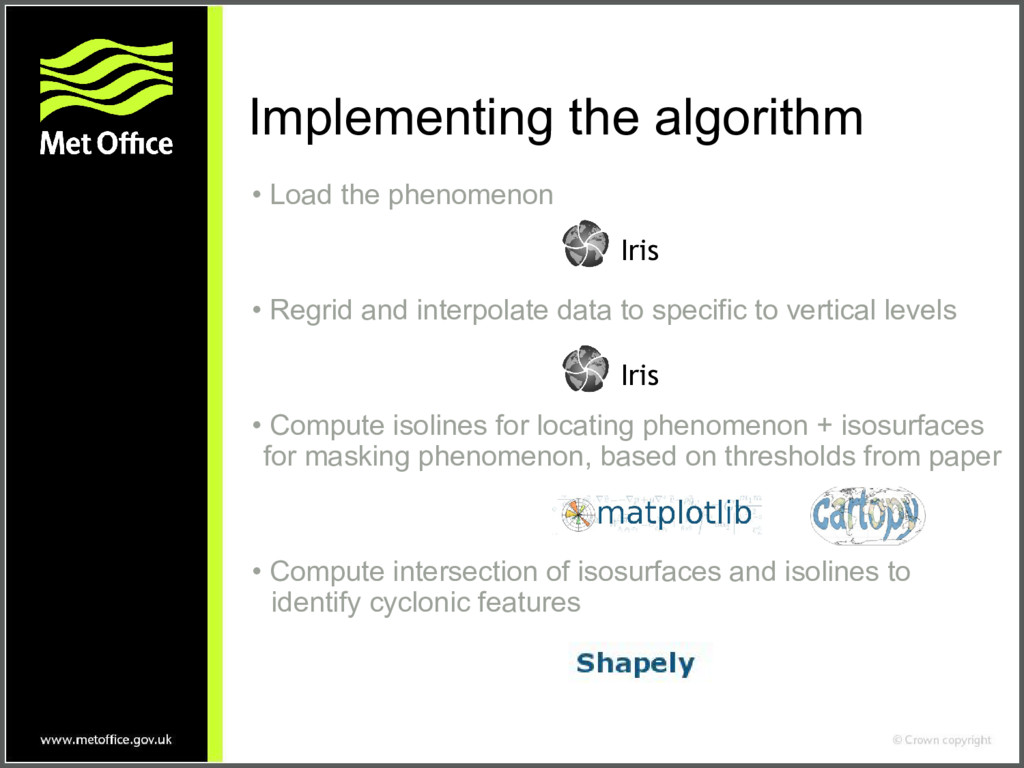
interpolate data to specific to vertical levels • Compute isolines for locating phenomenon + isosurfaces for masking phenomenon, based on thresholds from paper • Compute intersection of isosurfaces and isolines to identify cyclonic features Iris Iris
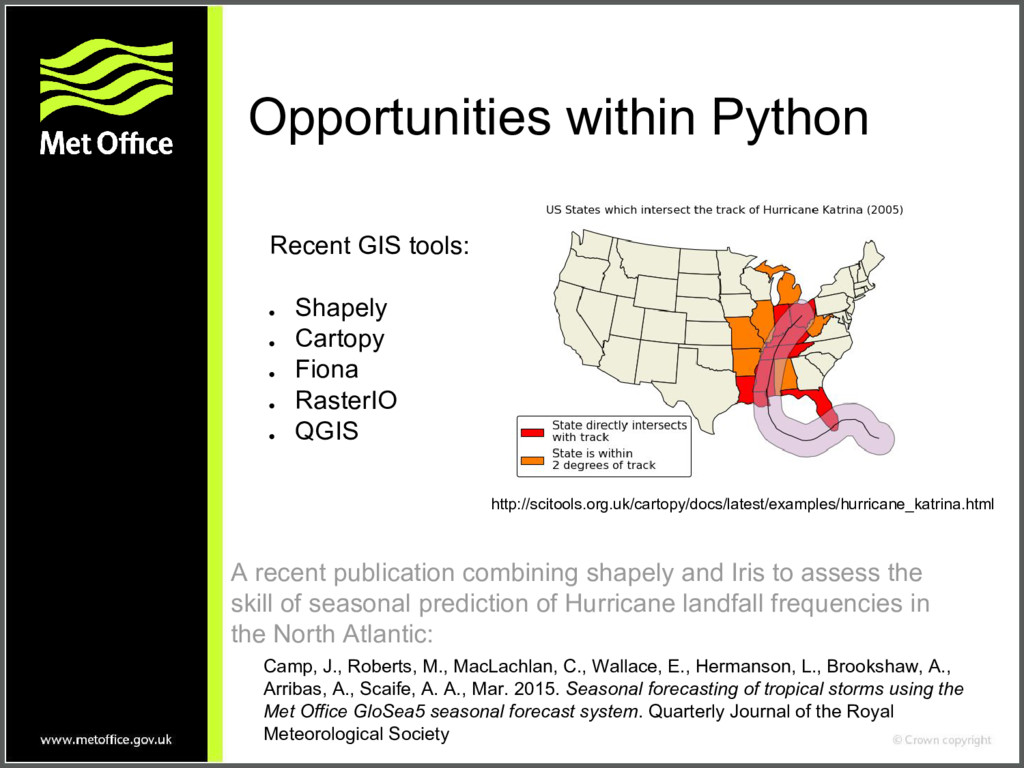
• Fiona • RasterIO • QGIS http://scitools.org.uk/cartopy/docs/latest/examples/hurricane_katrina.html Camp, J., Roberts, M., MacLachlan, C., Wallace, E., Hermanson, L., Brookshaw, A., Arribas, A., Scaife, A. A., Mar. 2015. Seasonal forecasting of tropical storms using the Met Office GloSea5 seasonal forecast system. Quarterly Journal of the Royal Meteorological Society A recent publication combining shapely and Iris to assess the skill of seasonal prediction of Hurricane landfall frequencies in the North Atlantic:
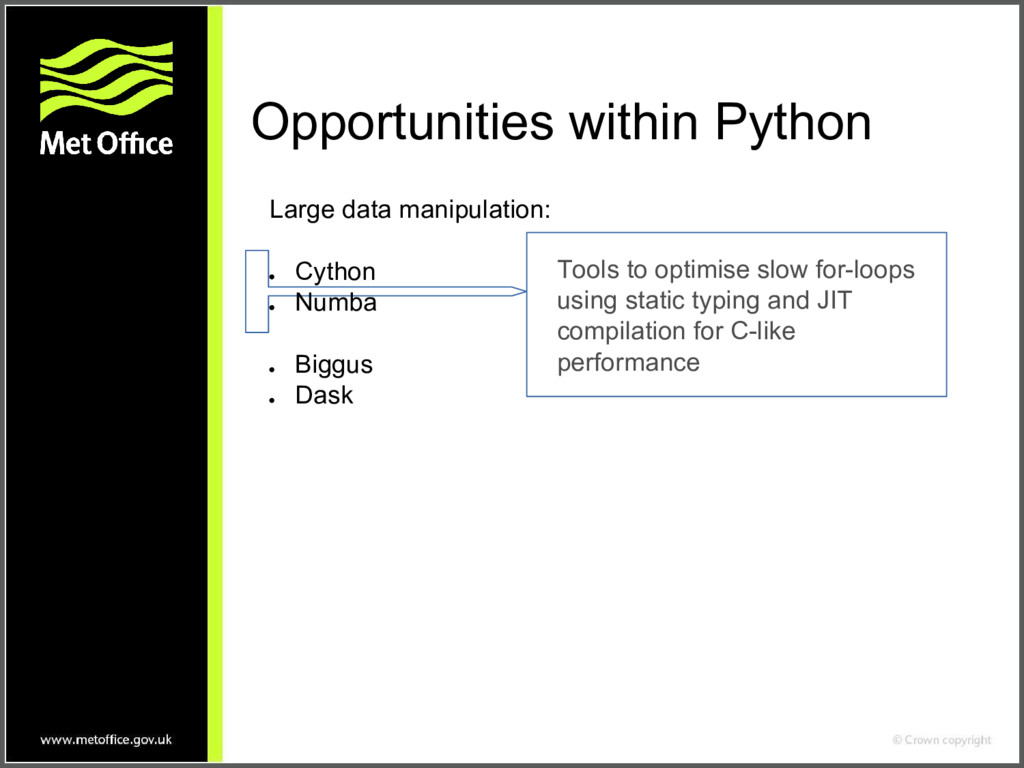
• Biggus • Dask >>> print(data) <Array shape=(80640, 4, 144, 192) dtype=dtype('float32') size=33.22 GiB> >>> stats = [biggus.mean(data, axis=0), biggus.max(data, axis=0), biggus.min(data, axis=0)] >>> biggus.ndarrays(stats) Result in ~4m45s on an Intel Xeon E5520 with 8GiB memory, bound by I/O not CPU. Biggus example: Iris is using Biggus for many of it operations. This means that we can load, analyse and save cubes way beyond the available system memory.
![>>> from iris.analysis import Linear >>> exeter = [('longitude', [-3.5]),](https://files.speakerdeck.com/presentations/fd23f472fded4d1ab9d971a6fb4f8ff8/slide_8.jpg)