Upgrade to Pro
— share decks privately, control downloads, hide ads and more …
Speaker Deck
Features
Speaker Deck
PRO
Sign in
Sign up for free
Search
Search
xdebug Profiler
Search
Sponsored
·
Your Podcast. Everywhere. Effortlessly.
Share. Educate. Inspire. Entertain. You do you. We'll handle the rest.
→
Peter Tilsen
June 23, 2015
Technology
0
49
xdebug Profiler
Short overview of xdebug profiler usage supported by qcachegrind
Peter Tilsen
June 23, 2015
Tweet
Share
More Decks by Peter Tilsen
See All by Peter Tilsen
Why did we choose to use GoLang
petertilsen
0
180
xdebug configuration
petertilsen
0
82
xdebug
petertilsen
0
74
Other Decks in Technology
See All in Technology
Context Engineeringの取り組み
nutslove
0
300
Ruby版 JSXのRuxが気になる
sansantech
PRO
0
120
配列に見る bash と zsh の違い
kazzpapa3
1
110
Webhook best practices for rock solid and resilient deployments
glaforge
1
270
モダンUIでフルサーバーレスなAIエージェントをAmplifyとCDKでサクッとデプロイしよう
minorun365
4
160
15 years with Rails and DDD (AI Edition)
andrzejkrzywda
0
180
日本の85%が使う公共SaaSは、どう育ったのか
taketakekaho
1
140
データの整合性を保ちたいだけなんだ
shoheimitani
8
3k
こんなところでも(地味に)活躍するImage Modeさんを知ってるかい?- Image Mode for OpenShift -
tsukaman
0
110
Deno・Bunの標準機能やElysiaJSを使ったWebSocketサーバー実装 / ラーメン屋を貸し切ってLT会! IoTLT 2026新年会
you
PRO
0
300
外部キー制約の知っておいて欲しいこと - RDBMSを正しく使うために必要なこと / FOREIGN KEY Night
soudai
PRO
12
4.9k
IaaS/SaaS管理における SREの実践 - SRE Kaigi 2026
bbqallstars
4
1.7k
Featured
See All Featured
Everyday Curiosity
cassininazir
0
130
How Fast Is Fast Enough? [PerfNow 2025]
tammyeverts
3
450
Rails Girls Zürich Keynote
gr2m
96
14k
Statistics for Hackers
jakevdp
799
230k
Bioeconomy Workshop: Dr. Julius Ecuru, Opportunities for a Bioeconomy in West Africa
akademiya2063
PRO
1
54
How to Get Subject Matter Experts Bought In and Actively Contributing to SEO & PR Initiatives.
livdayseo
0
63
Introduction to Domain-Driven Design and Collaborative software design
baasie
1
580
sira's awesome portfolio website redesign presentation
elsirapls
0
140
Music & Morning Musume
bryan
47
7.1k
GraphQLとの向き合い方2022年版
quramy
50
14k
30 Presentation Tips
portentint
PRO
1
210
Highjacked: Video Game Concept Design
rkendrick25
PRO
1
280
Transcript
xdebug Profiler
xdebug Profiler • What is this and what is it
good for? • Installation • Configuration • xdebug Profiler plugin • Analysers • Qcachegrind • Demo
xdebug Profiler What is this? • Build in extension of
debug • Helps finding performance leaks • Helps inspecting code execution
xdebug Profiler What is this? • Three major functions •
Monitor execution time of each and all methods called during one request • Visualise most consuming execution (Callee Map) • Visualise call history (Call Graph)
Installation • Part of xdebug (http://xdebug.org/) • Multiple ways to
install • Precompiled package for windows, PEAR/PECL, source
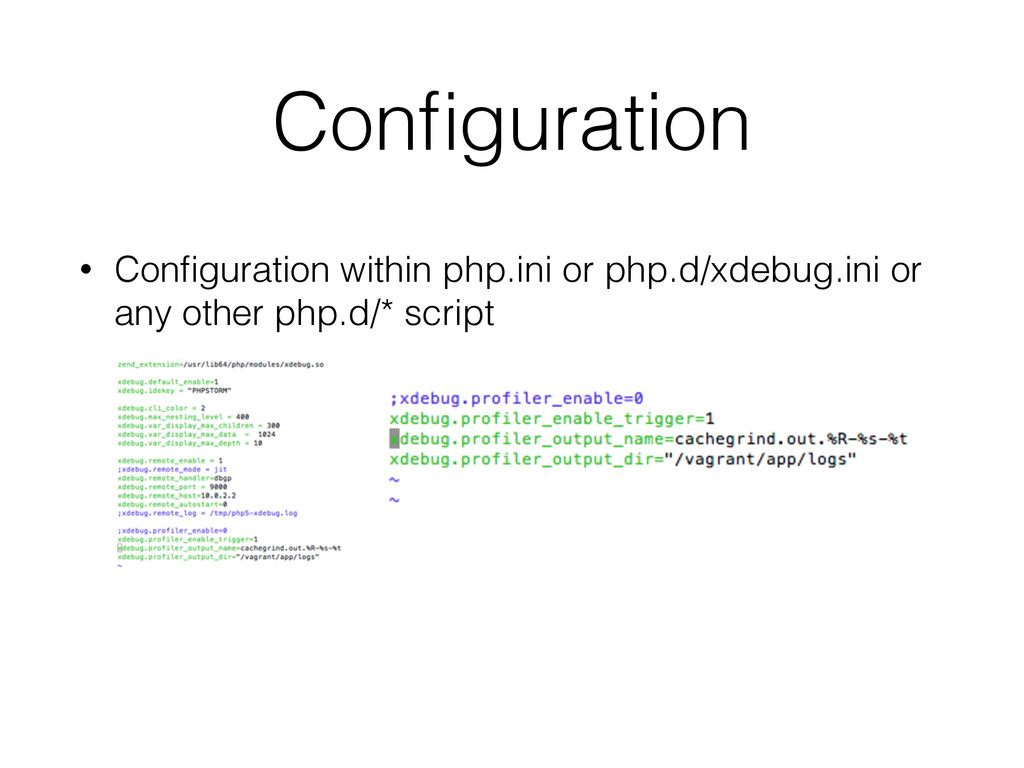
Configuration • Configuration within php.ini or php.d/xdebug.ini or any other
php.d/* script
Configuration remote profiling • Enable remote profiling debug.profiler_enable_trigger=1
• requires remote enabler • Recommend to use browser plugin xdebug enabler
Configuration cachegrind.out • Params for additional verbosity cachegrind.out.%R-%s-%t •
R $_SERVER[‘REQUEST_URI'] • s script name • t timestamp (seconds) • see http://xdebug.org/docs/ all_settings#trace_output_name for compete list
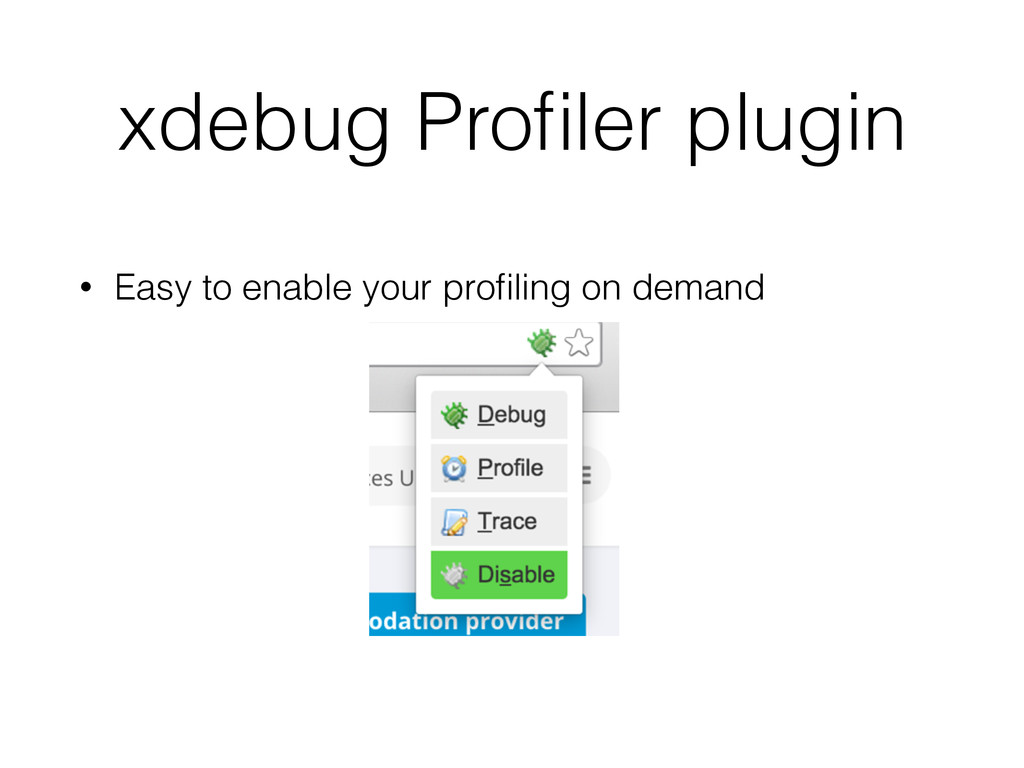
xdebug Profiler plugin • Easy to enable your profiling on
demand
Analysers • Platform/OS related analysers ported from kcachegrind • wincachegrind
• kcachegrind • qcachegrind • Further analysers • phpstrom (embedded plugin) • etc.
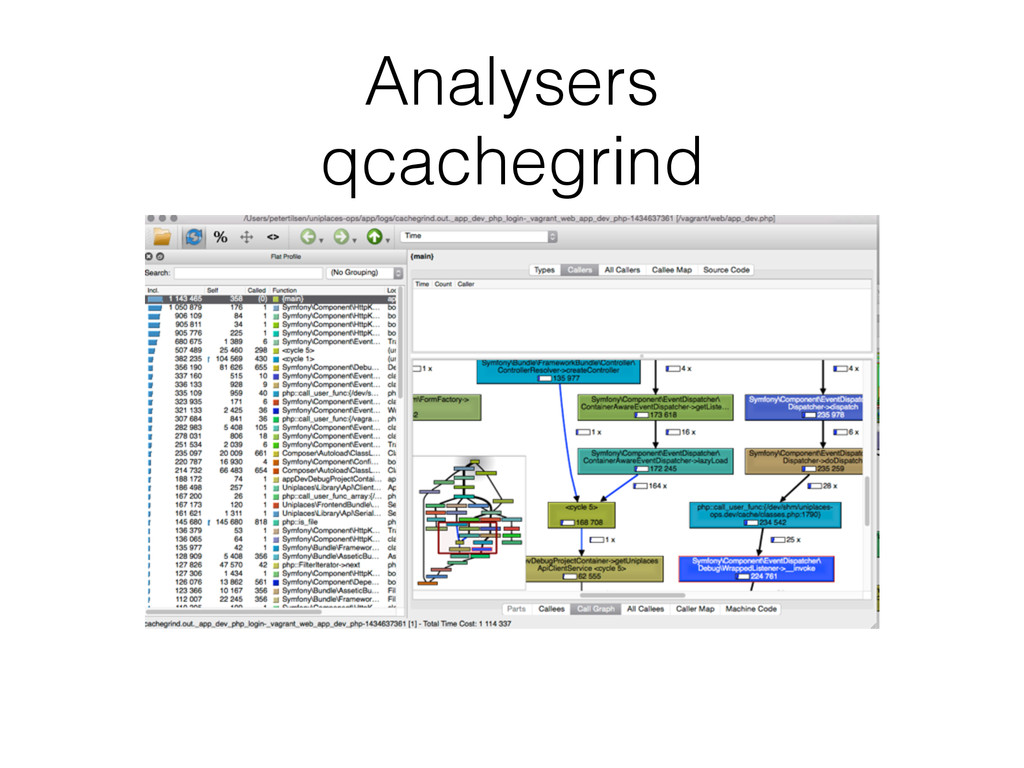
Analysers qcachegrind
Analysers qcachegrind • What should I take a closer look
at? • Time • Callee Map • Call Graph
Analysers qcachegrind • Demo