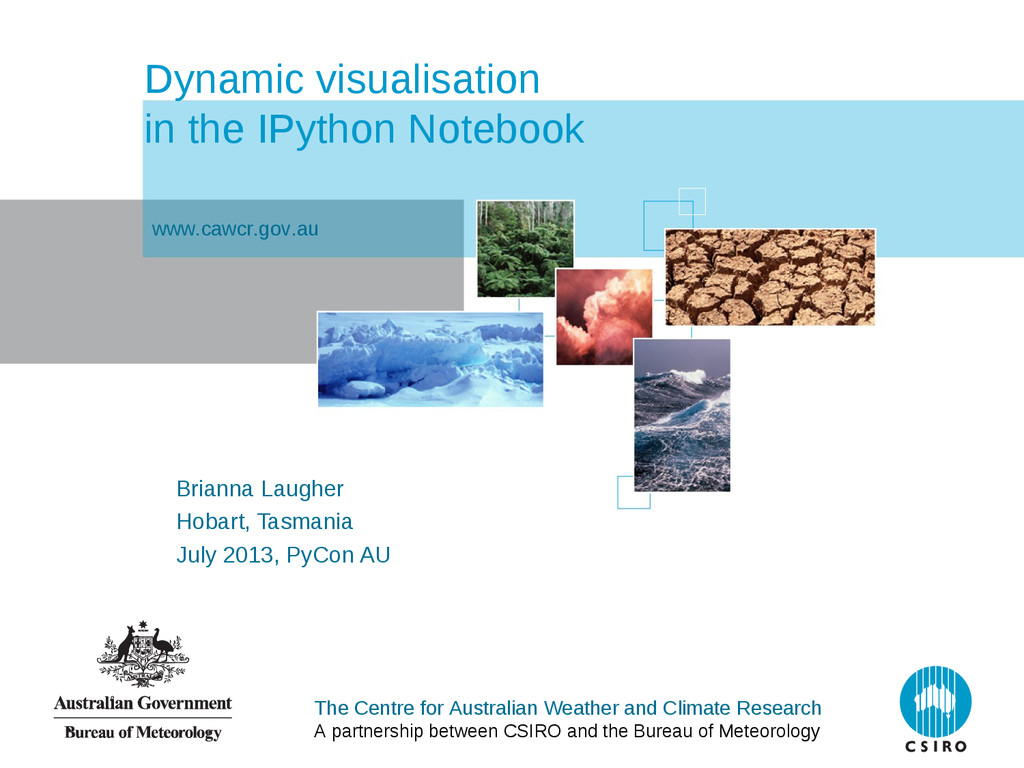
between CSIRO and the Bureau of Meteorology Dynamic visualisation in the IPython Notebook Brianna Laugher Hobart, Tasmania July 2013, PyCon AU www.cawcr.gov.au
Can't layer IPython Notebook makes it easy to explore datasets and plot them with matplotlib... ...but for gridded datasets, it really would be nice to have them on a map!
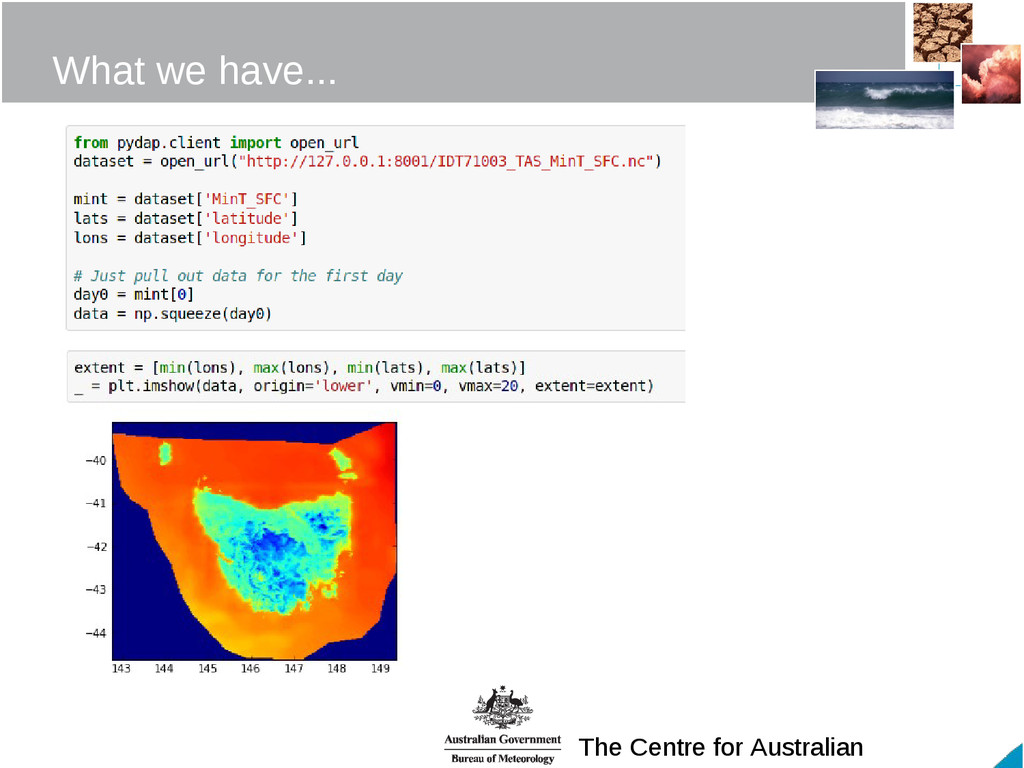
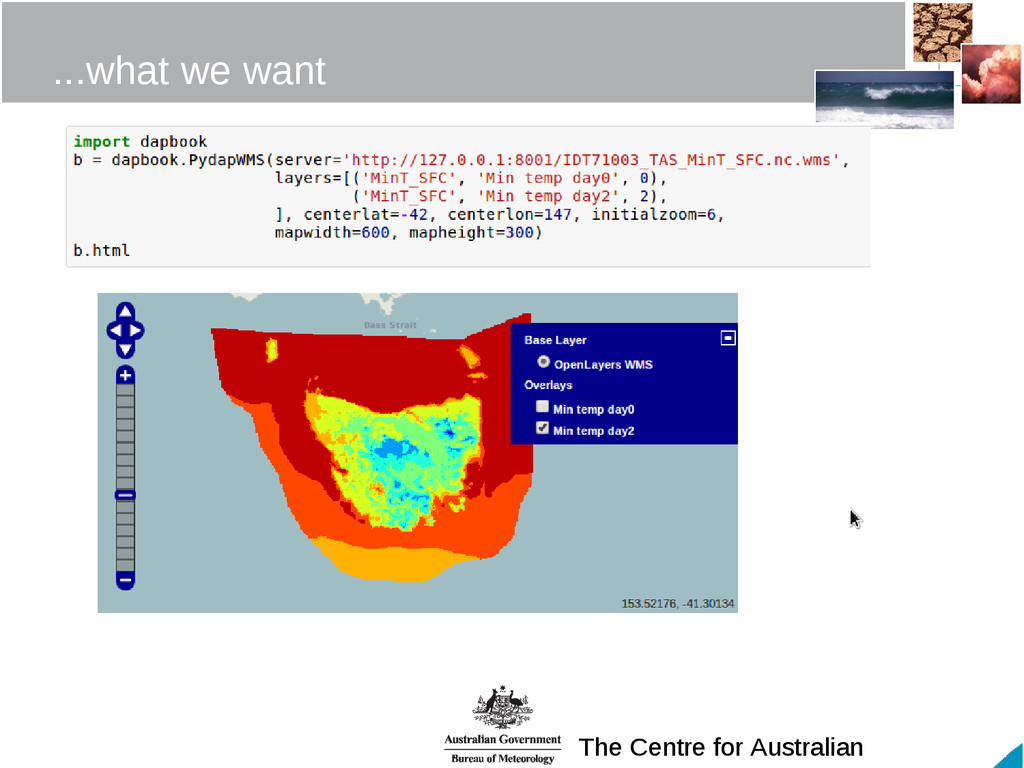
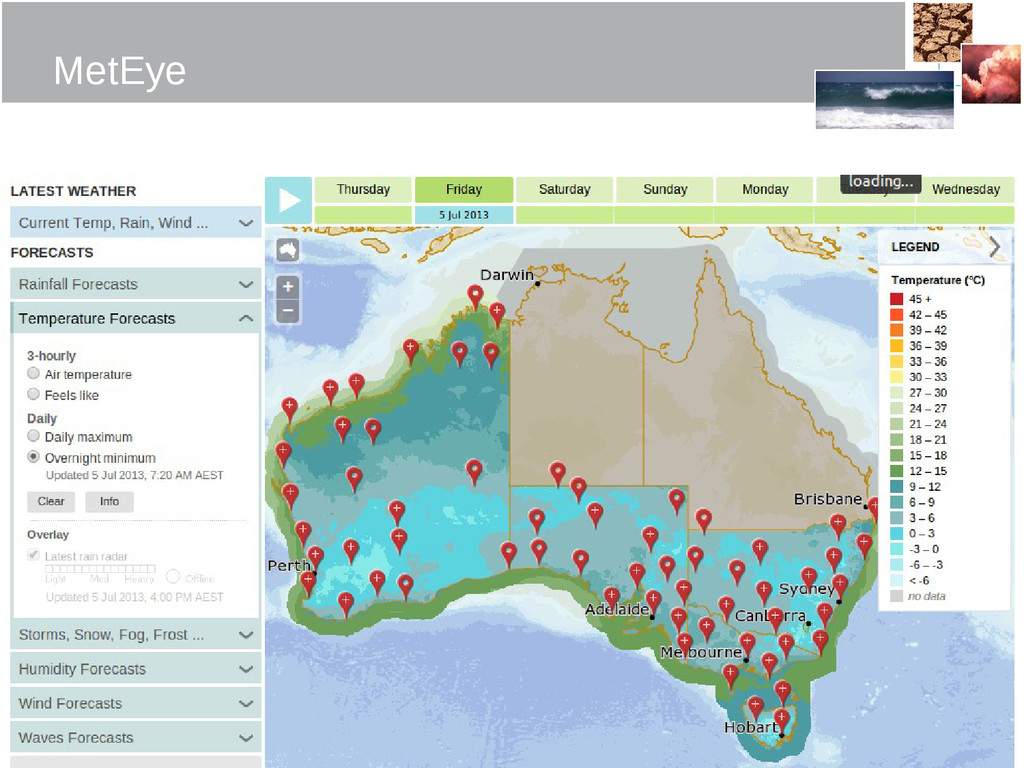
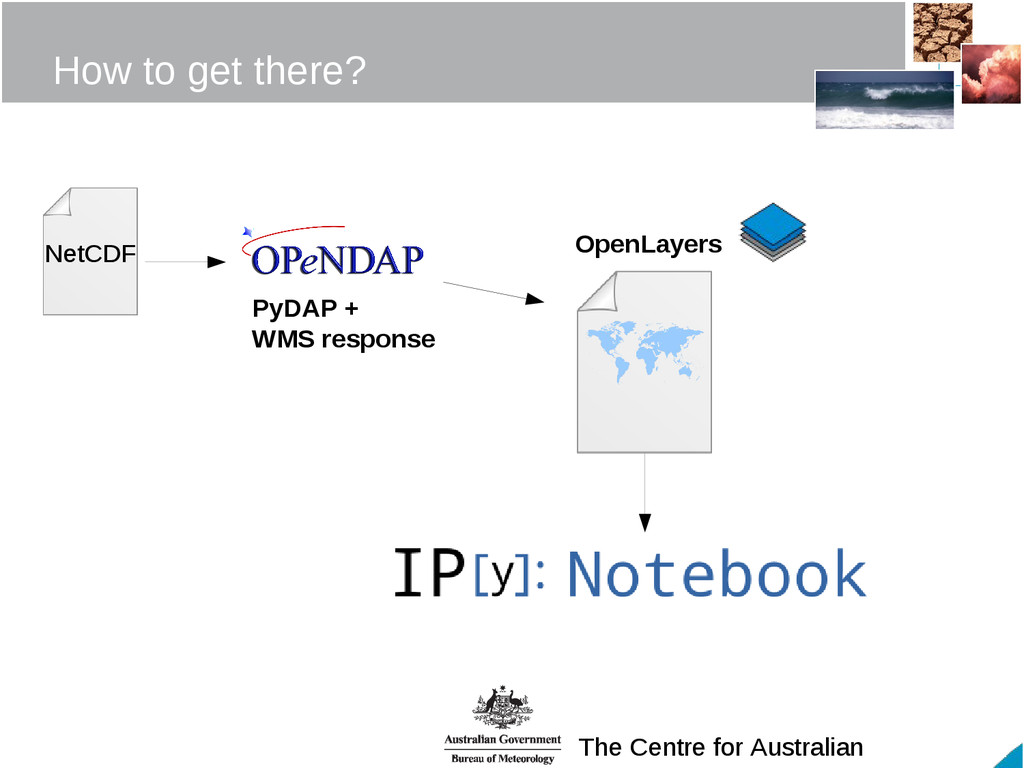
– common format for gridded data (could easily have been HDF5) Commonly used by earth science communities Sample TAS MinT grid from the Australian Digital Forecast Database produced by BoM, see http://www.bom.gov.au/catalogue/data-feeds.shtml for details and to download sample grids ADFD grids feed into MetEye - http://www.bom.gov.au/australia/meteye/
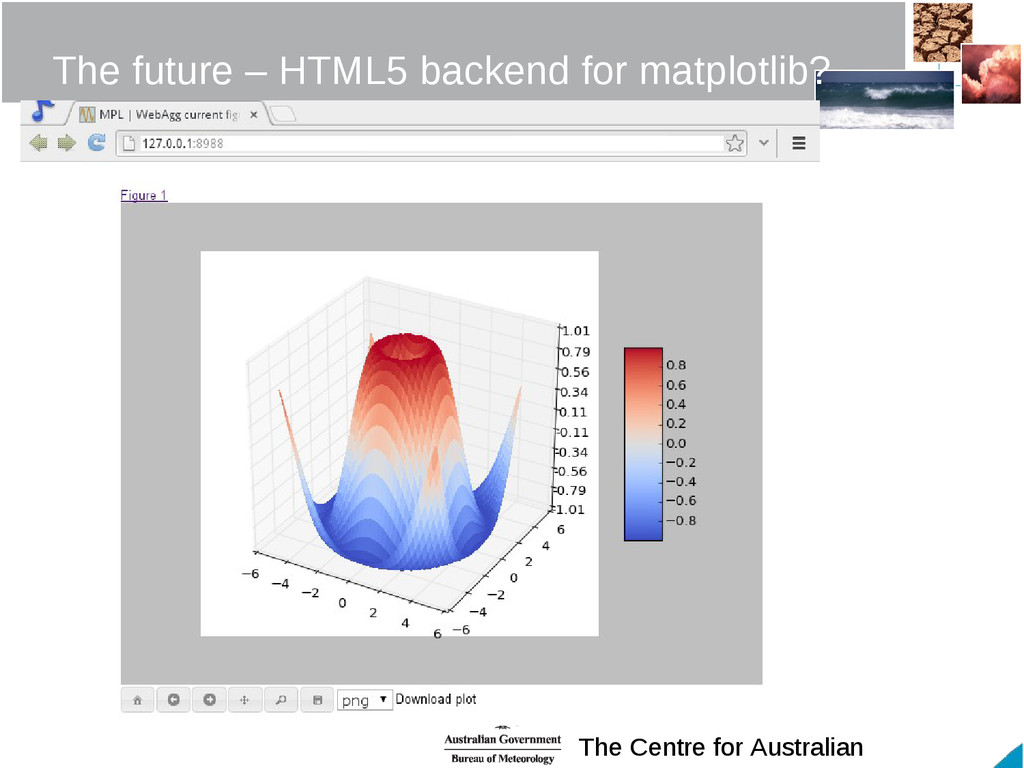
environment where you can combine code execution, text, mathematics, plots and rich media into a single document” • Inspired by Mathematica, SAGE notebooks • Built-in support for numpy, matplotlib • Half-interpreter, half-script • Great way to “show your work” • Useful for tuning fiddly APIs (ahem matplotlib) • Perfect for tutorials! Run a local server, and/or Publish your notebook as .ipynb and use http://nbviewer.ipython.org/
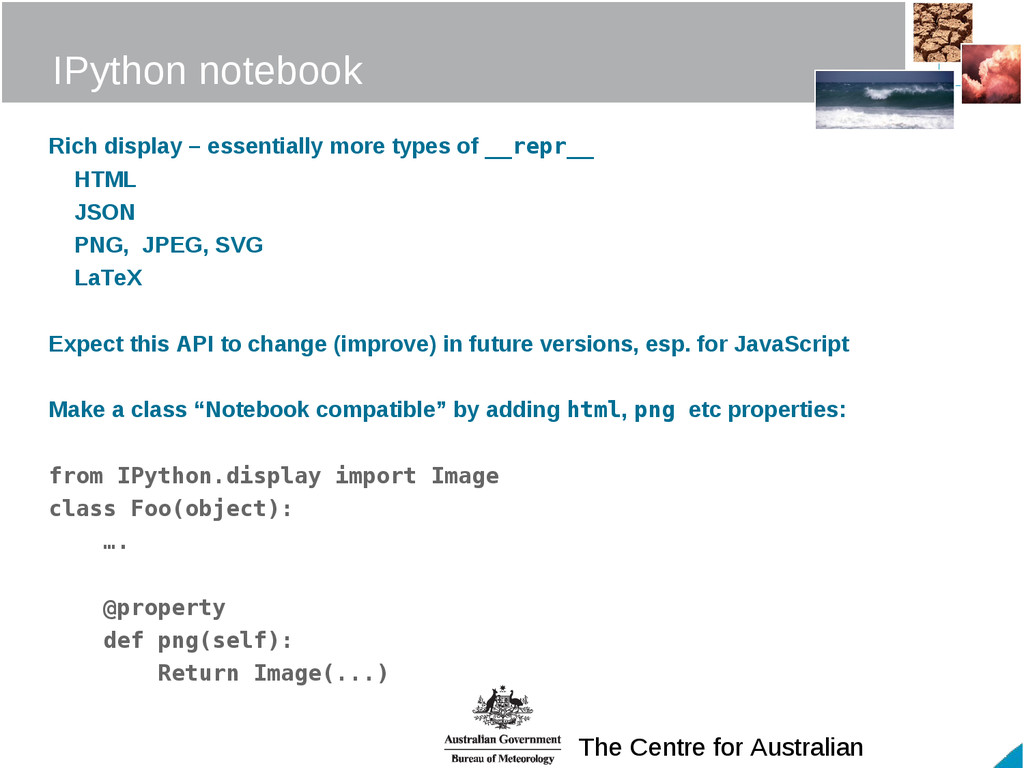
more types of __repr__ HTML JSON PNG, JPEG, SVG LaTeX Expect this API to change (improve) in future versions, esp. for JavaScript Make a class “Notebook compatible” by adding html, png etc properties: from IPython.display import Image class Foo(object): …. @property def png(self): Return Image(...)
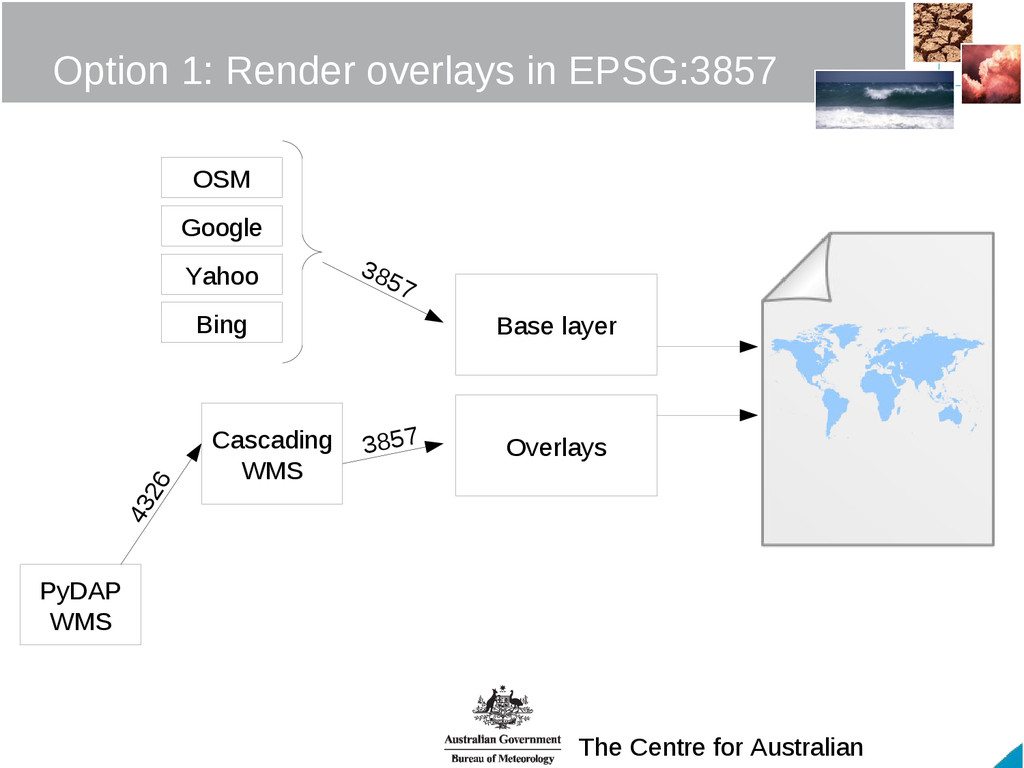
Specify layers as “tile layers” or “WMS tile layers” (different APIs) Can set projection as required Can reproject points and vectors (but not map tiles) on-the-fly
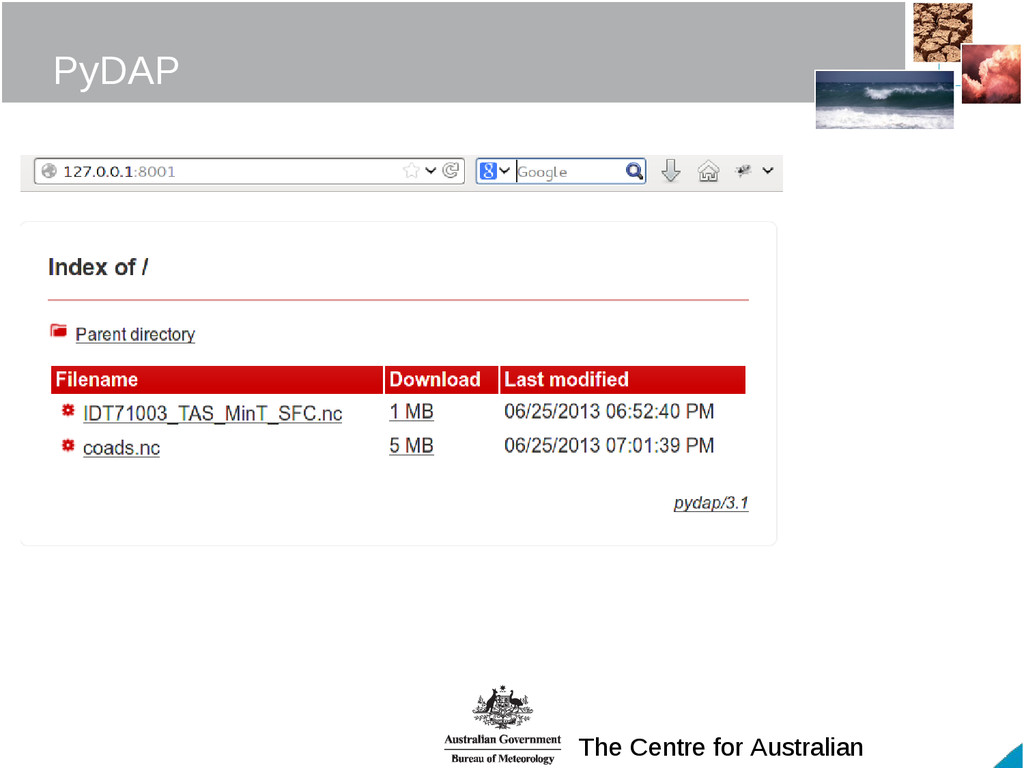
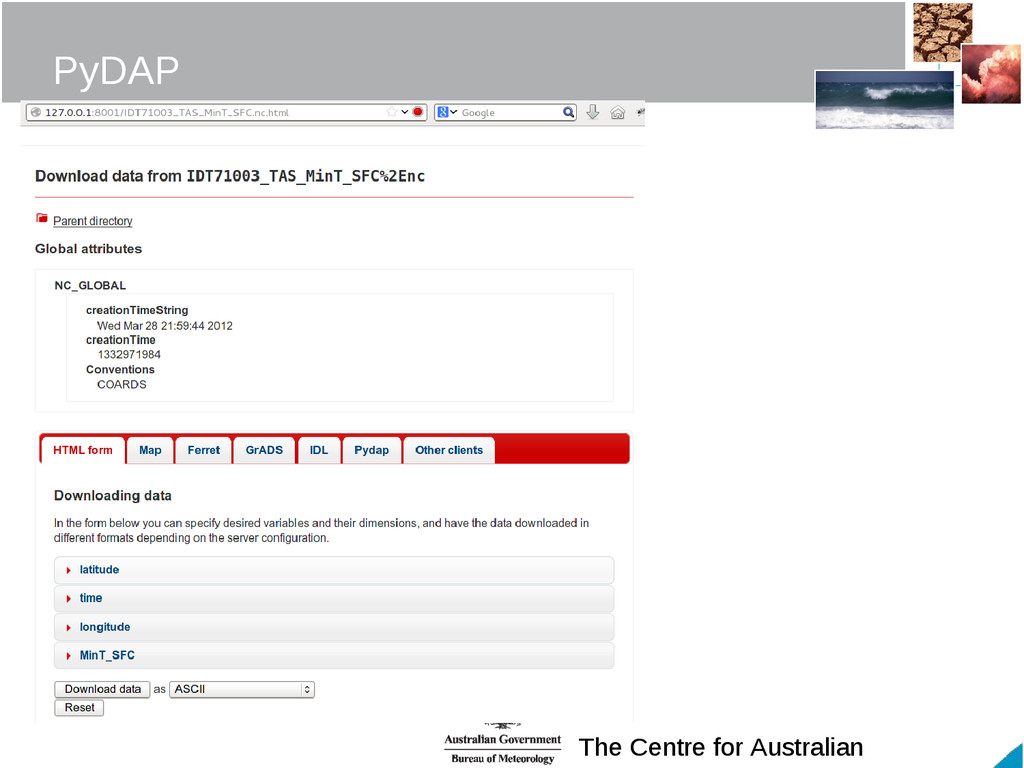
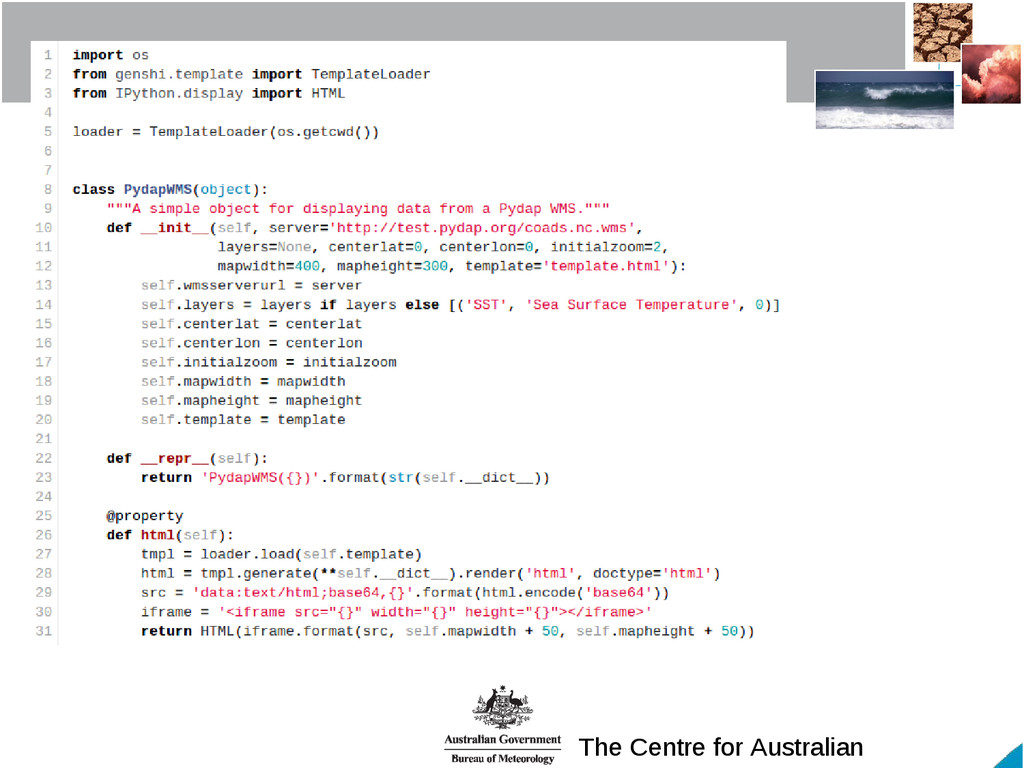
client Client • “Lazy loading” of data from any OPeNDAP server into numpy (incl. slices, subsets) • Don't have to care about file format of original data Server • WSGI app • Handlers (input): NetCDF, HDF5, SQL, CSV, remote!, ... • Responses (output): DAS/DDS/DODS, HTML, ASCII, WMS, KML, XLS, ...
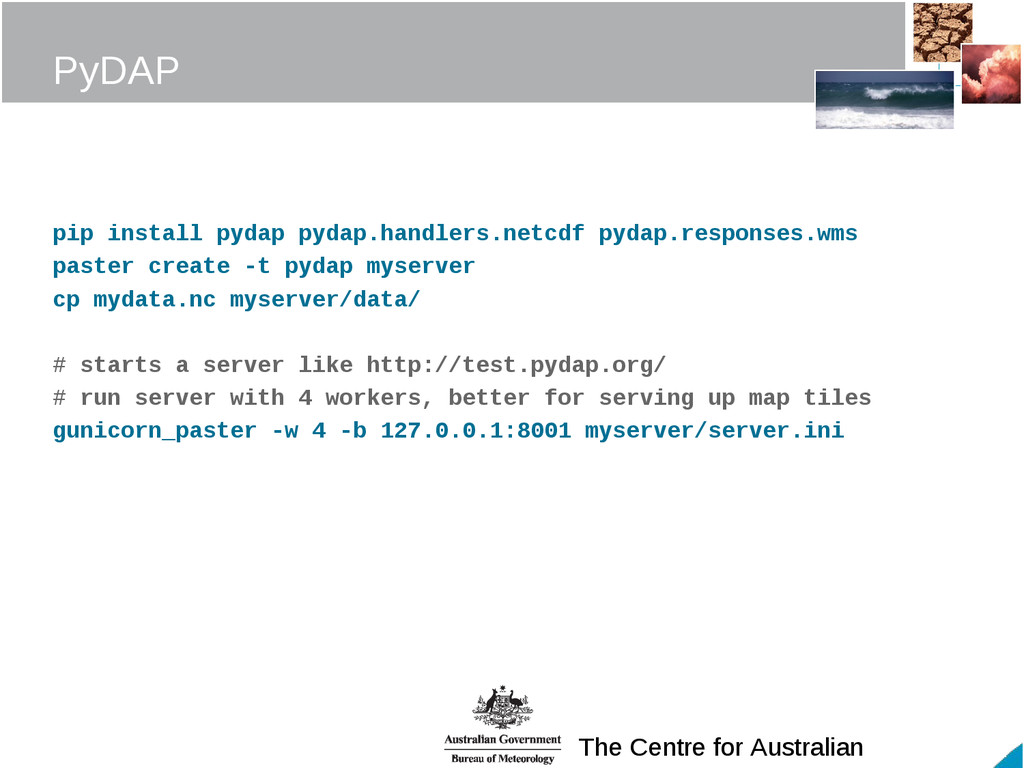
paster create -t pydap myserver cp mydata.nc myserver/data/ # starts a server like http://test.pydap.org/ # run server with 4 workers, better for serving up map tiles gunicorn_paster -w 4 -b 127.0.0.1:8001 myserver/server.ini
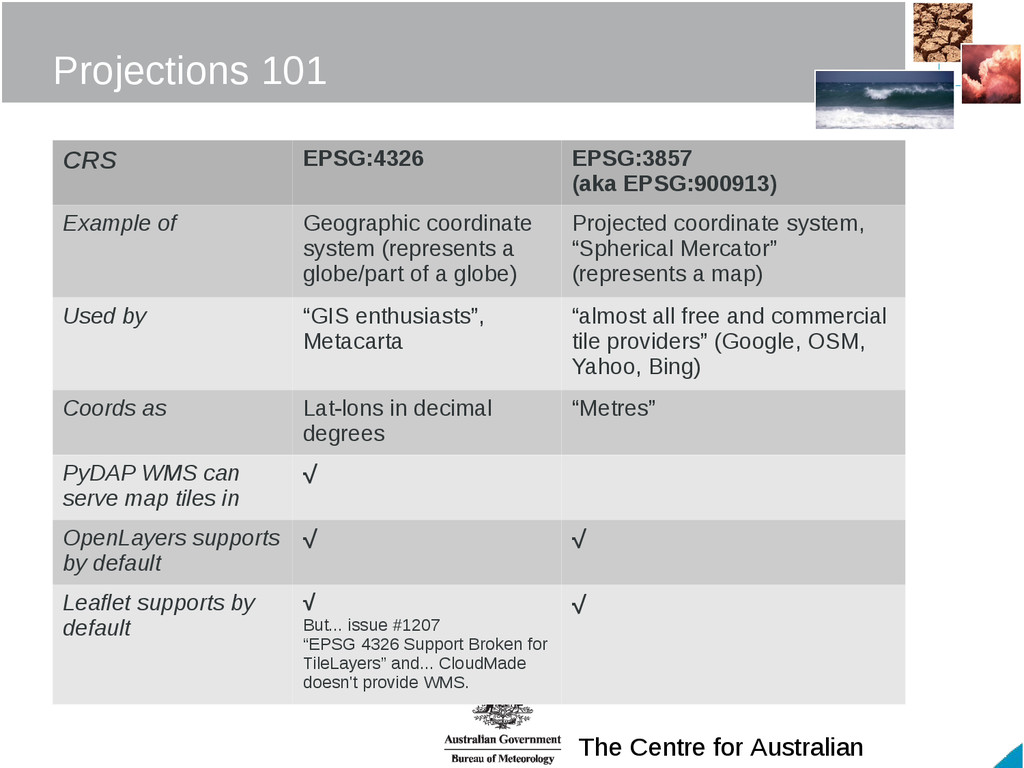
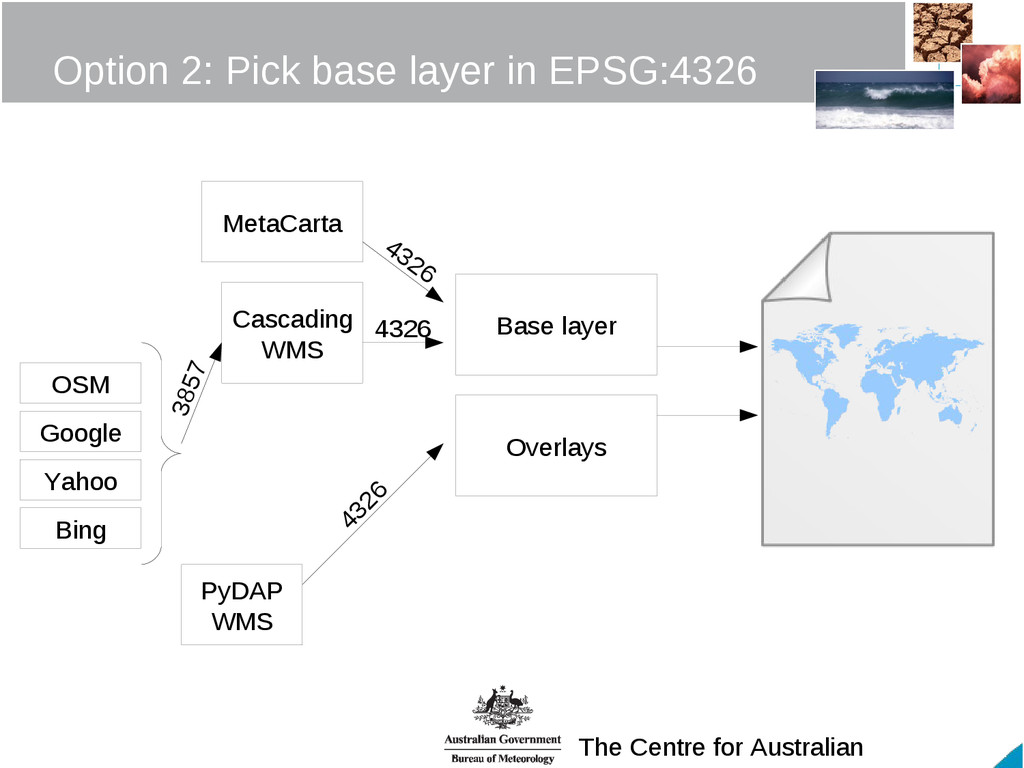
EPSG:900913) Example of Geographic coordinate system (represents a globe/part of a globe) Projected coordinate system, “Spherical Mercator” (represents a map) Used by “GIS enthusiasts”, Metacarta “almost all free and commercial tile providers” (Google, OSM, Yahoo, Bing) Coords as Lat-lons in decimal degrees “Metres” PyDAP WMS can serve map tiles in √ OpenLayers supports by default √ √ Leaflet supports by default √ But... issue #1207 “EPSG 4326 Support Broken for TileLayers” and... CloudMade doesn't provide WMS. √
for the original leavis, and willingness to share his ideas Leafvis – a WMS-ish app, DIY map tile rendering. https://github.com/nfaggian/leafvis And also: Roberto De Almeida James Sofra Danielle Madeley Roald de Wit Credits Map tiles photo: “Carcassonne” by Tom & Katrien, licensed CC-BY-SA. http://www.flickr.com/photos/inferis/283379928/ PyDAP slide: by PyCon 2007 talk by Roberto De Almeida. http://www.scribd.com/doc/2864/PyCon-2007
between CSIRO and the Bureau of Meteorology Brianna Laugher Email: [email protected] Web: www.cawcr.gov.au Slides & code: https://github.com/pfctdayelise/dapbook Thank you www.cawcr.gov.au