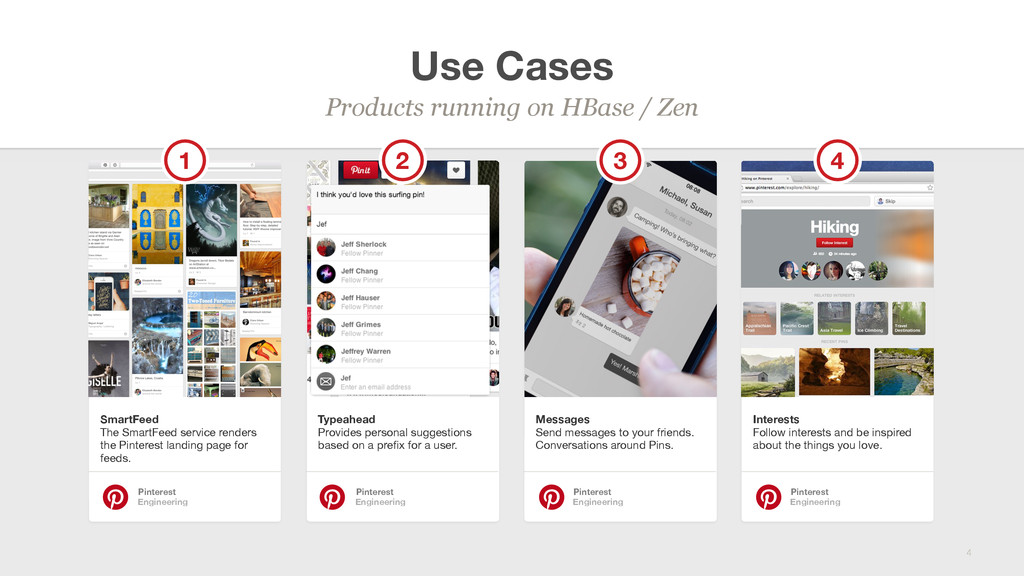
The SmartFeed service renders the Pinterest landing page for feeds. Pinterest Engineering Typeahead Provides personal suggestions based on a prefix for a user. Pinterest Engineering Messages Send messages to your friends. Conversations around Pins. Pinterest Engineering Interests Follow interests and be inspired about the things you love. Pinterest Engineering 1 2 3 4
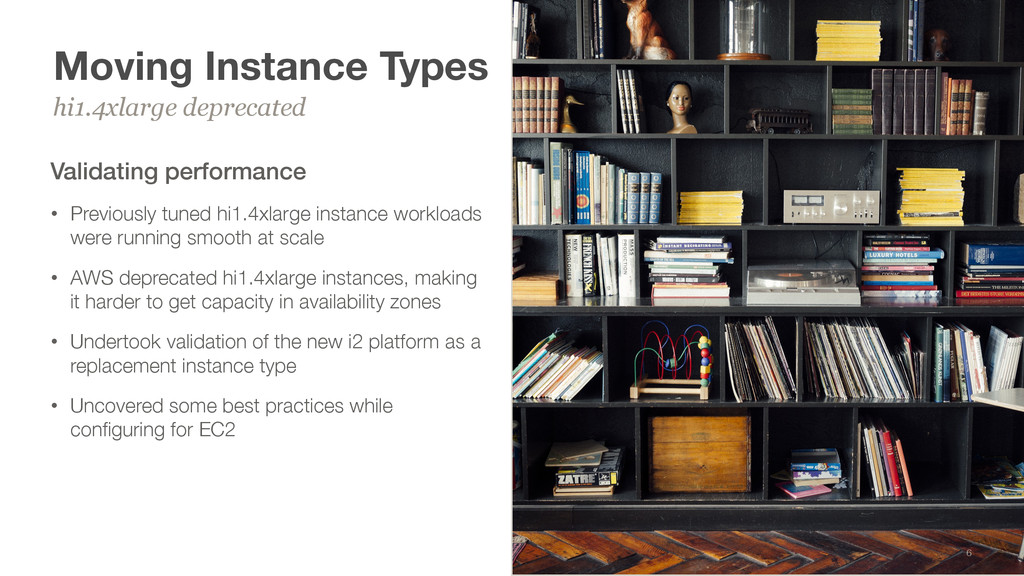
workloads were running smooth at scale • AWS deprecated hi1.4xlarge instances, making it harder to get capacity in availability zones • Undertook validation of the new i2 platform as a replacement instance type • Uncovered some best practices while configuring for EC2 hi1.4xlarge deprecated 6
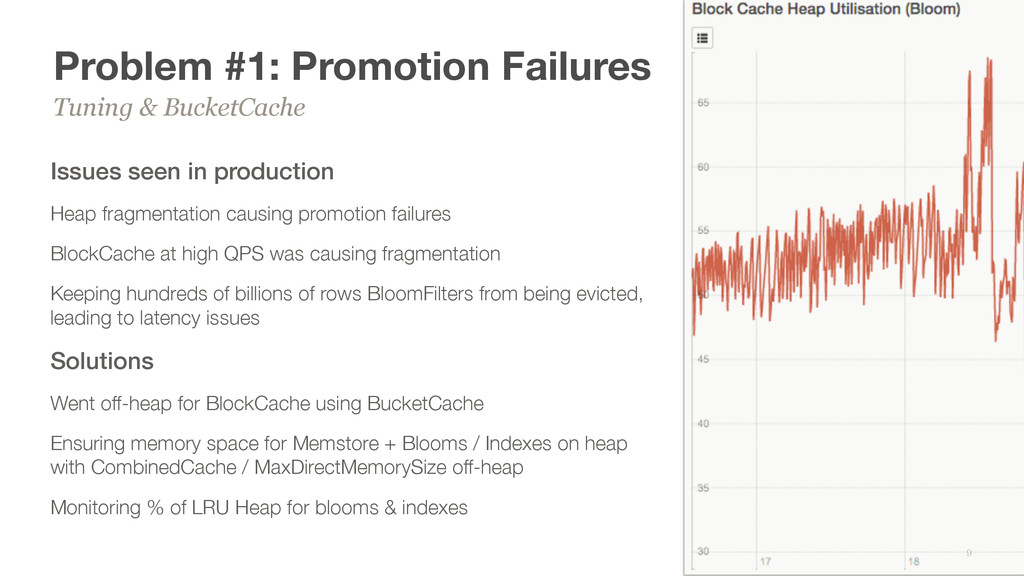
causing promotion failures BlockCache at high QPS was causing fragmentation Keeping hundreds of billions of rows BloomFilters from being evicted, leading to latency issues Solutions Went off-heap for BlockCache using BucketCache Ensuring memory space for Memstore + Blooms / Indexes on heap with CombinedCache / MaxDirectMemorySize off-heap Monitoring % of LRU Heap for blooms & indexes Tuning & BucketCache 9
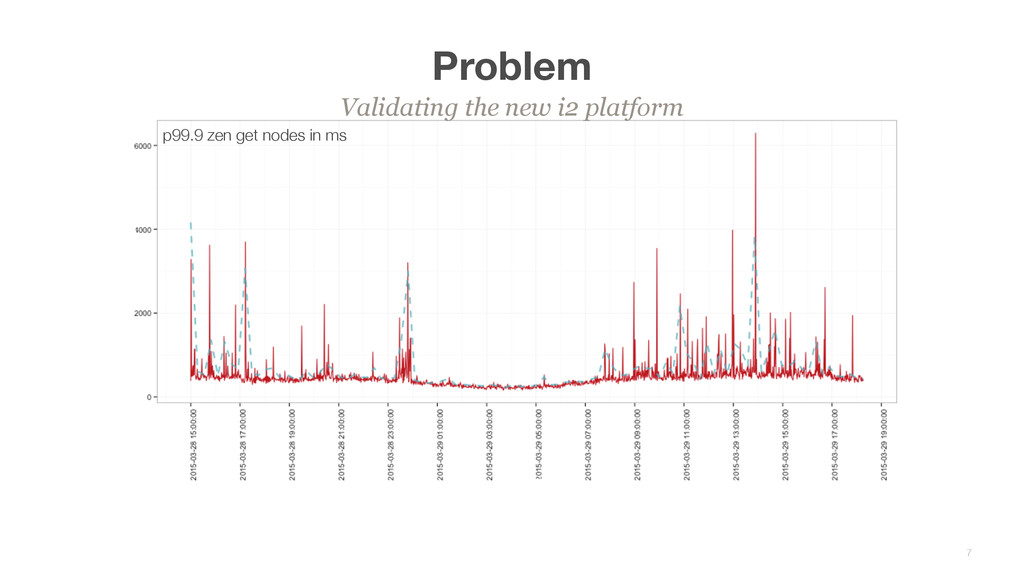
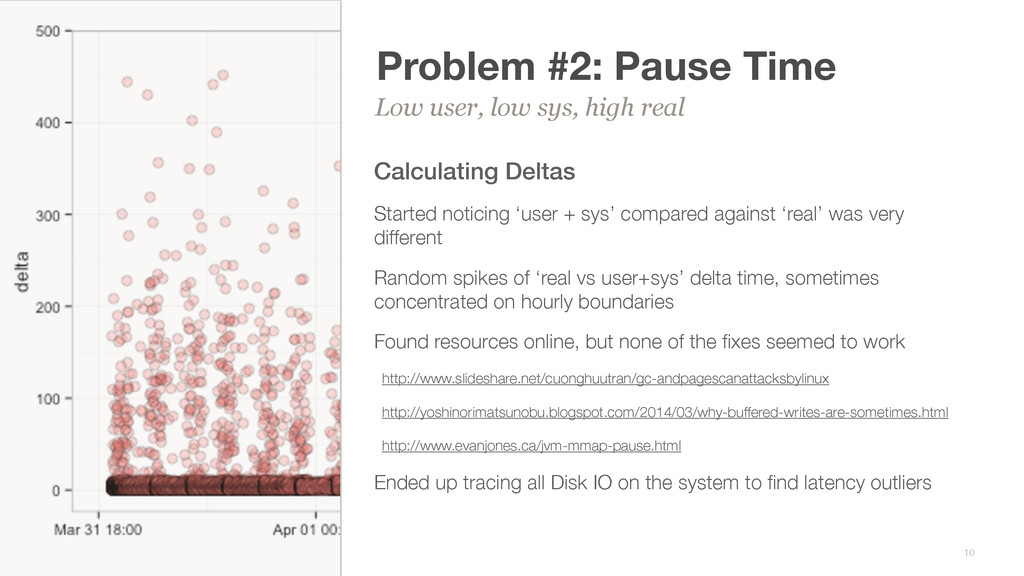
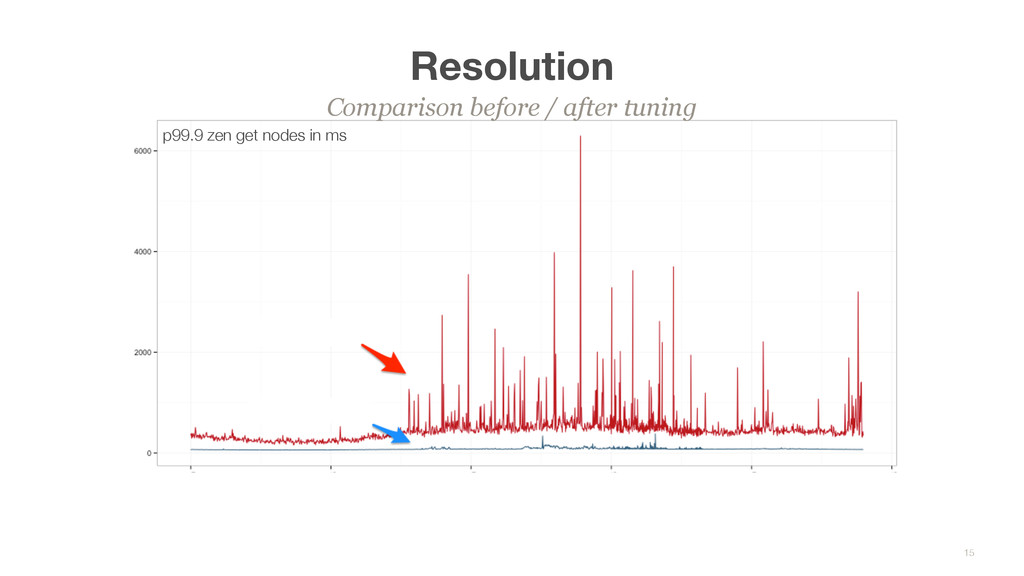
sys’ compared against ‘real’ was very different Random spikes of ‘real vs user+sys’ delta time, sometimes concentrated on hourly boundaries Found resources online, but none of the fixes seemed to work http://www.slideshare.net/cuonghuutran/gc-andpagescanattacksbylinux http://yoshinorimatsunobu.blogspot.com/2014/03/why-buffered-writes-are-sometimes.html http://www.evanjones.ca/jvm-mmap-pause.html Ended up tracing all Disk IO on the system to find latency outliers Low user, low sys, high real 10
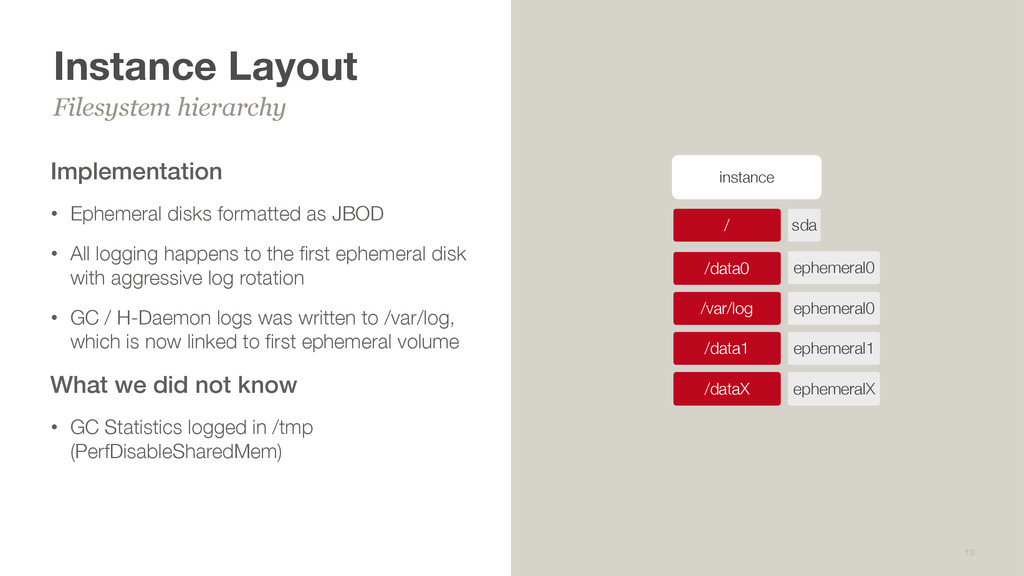
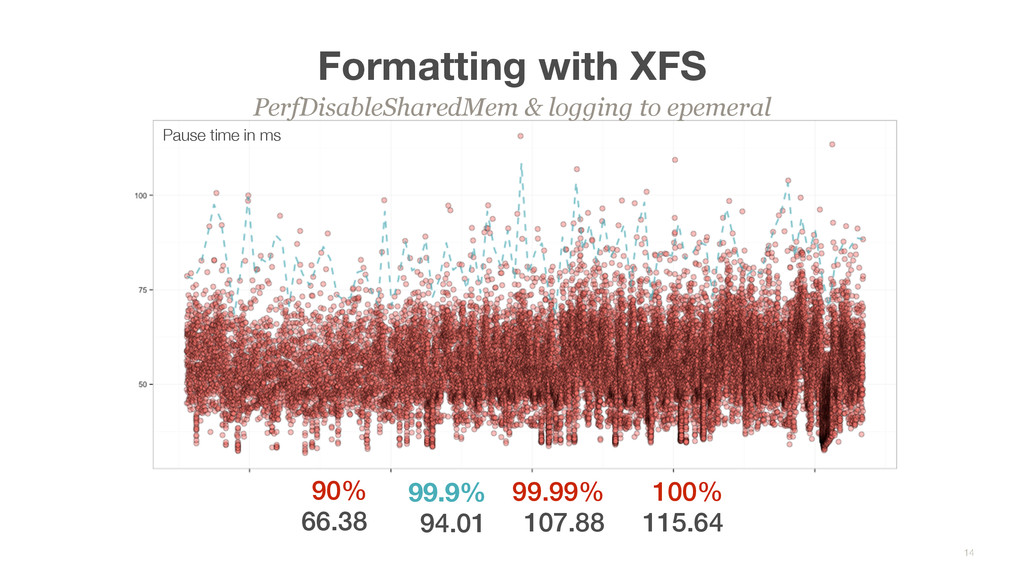
All logging happens to the first ephemeral disk with aggressive log rotation • GC / H-Daemon logs was written to /var/log, which is now linked to first ephemeral volume What we did not know • GC Statistics logged in /tmp (PerfDisableSharedMem) Filesystem hierarchy 13 ephemeral0 instance /var/log /data0 / sda /data1 ephemeral0 ephemeral1 /dataX ephemeralX
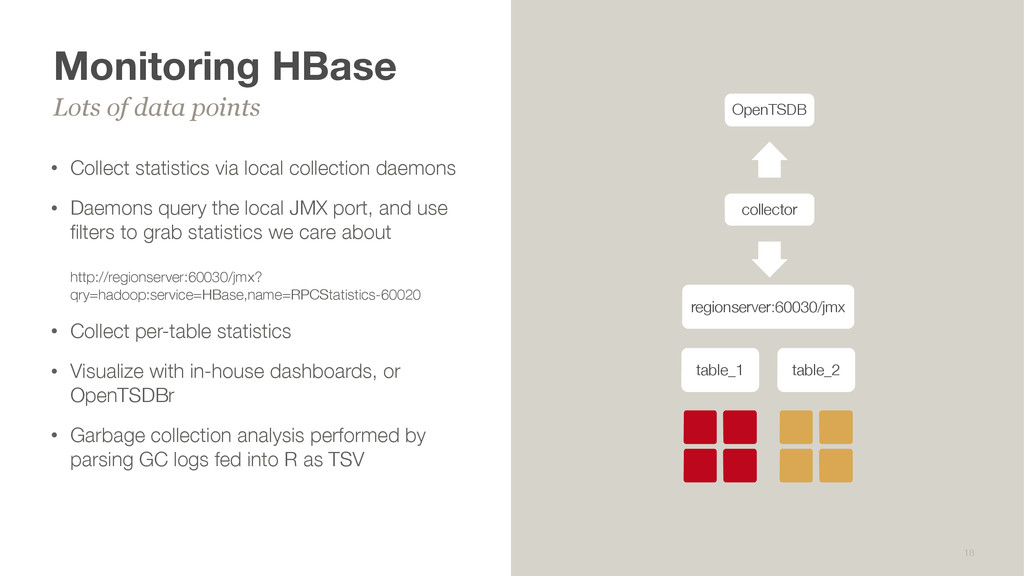
Daemons query the local JMX port, and use filters to grab statistics we care about http://regionserver:60030/jmx? qry=hadoop:service=HBase,name=RPCStatistics-60020 • Collect per-table statistics • Visualize with in-house dashboards, or OpenTSDBr • Garbage collection analysis performed by parsing GC logs fed into R as TSV Lots of data points 18 table_1 collector regionserver:60030/jmx table_2 OpenTSDB
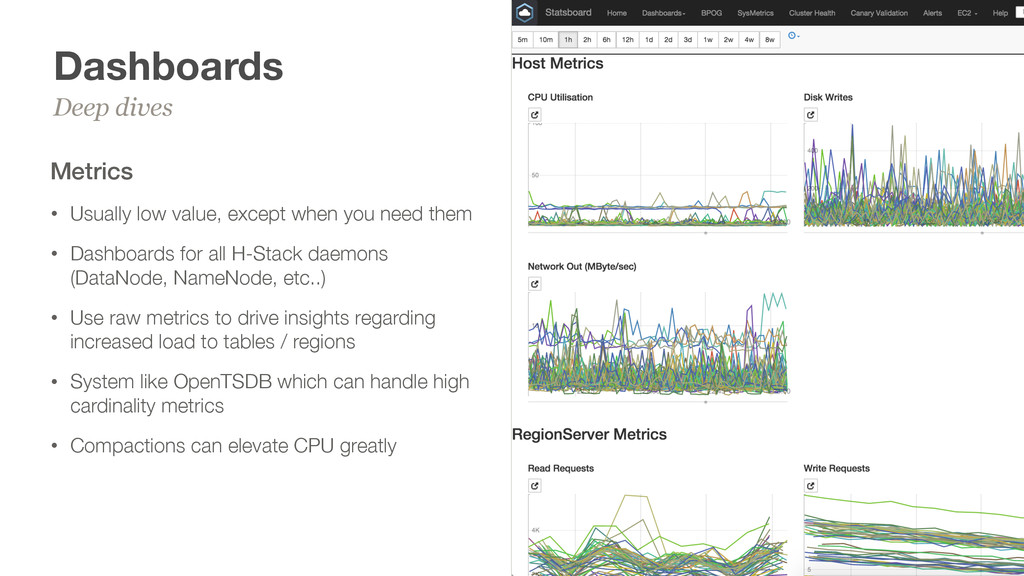
them • Dashboards for all H-Stack daemons (DataNode, NameNode, etc..) • Use raw metrics to drive insights regarding increased load to tables / regions • System like OpenTSDB which can handle high cardinality metrics • Compactions can elevate CPU greatly Deep dives 19
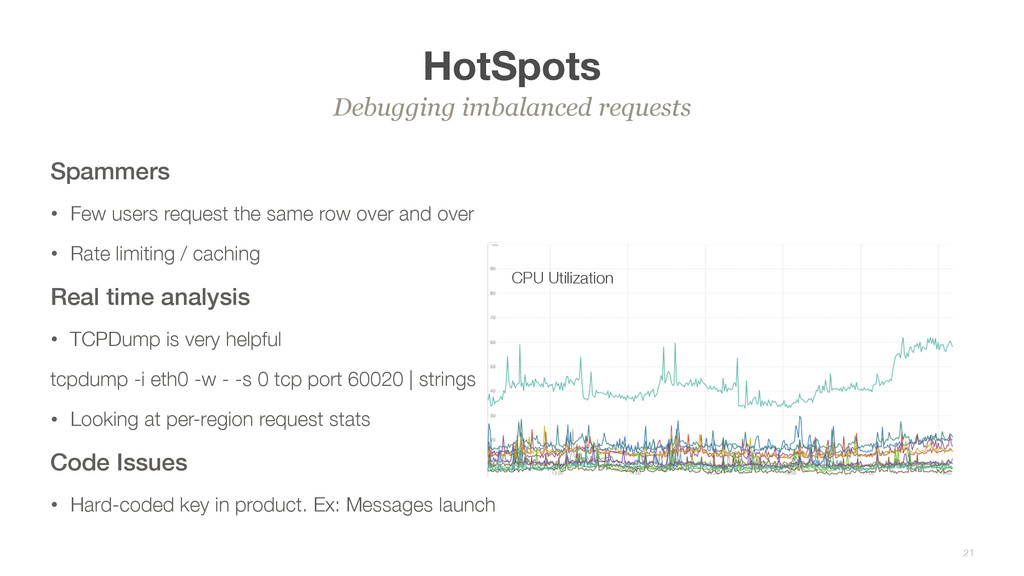
and over • Rate limiting / caching Real time analysis • TCPDump is very helpful tcpdump -i eth0 -w - -s 0 tcp port 60020 | strings • Looking at per-region request stats Code Issues • Hard-coded key in product. Ex: Messages launch Debugging imbalanced requests 21 CPU Utilization
2 4 5 3 1 3 4 2 Salted keys for uniform distribution Per-table region assignment • One or Two region difference could cause big difference on load • Average 2.5 regions per RS cause region assignment of 2 or 3 • Load is 30% different
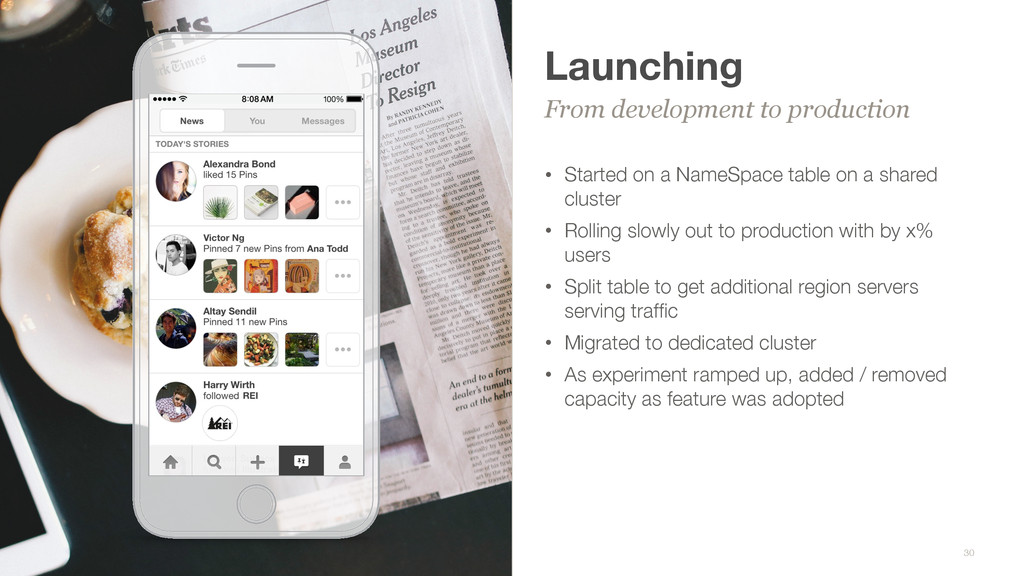
cluster • Rolling slowly out to production with by x% users • Split table to get additional region servers serving traffic • Migrated to dedicated cluster • As experiment ramped up, added / removed capacity as feature was adopted From development to production 30 2:50 PM 100%
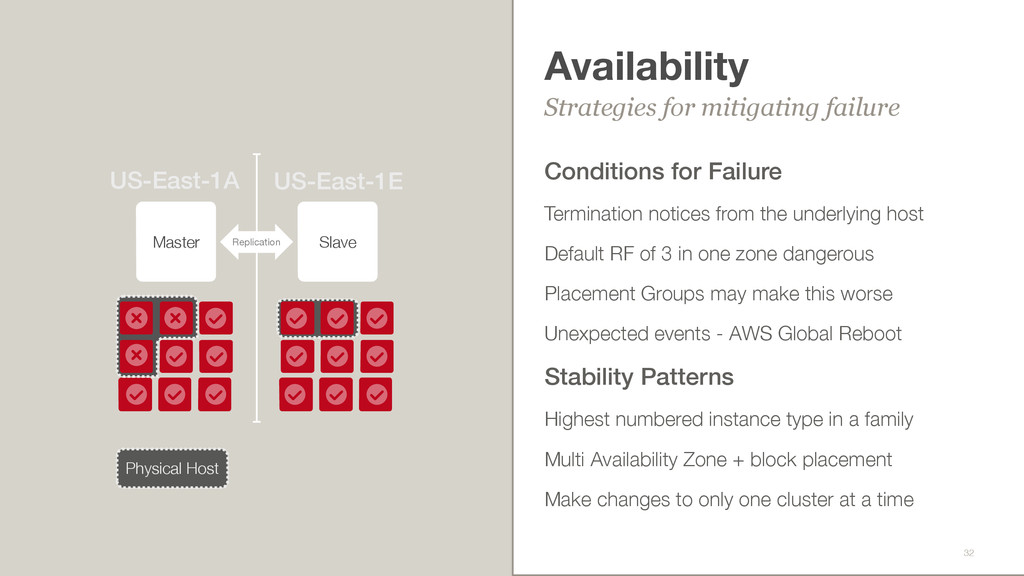
Default RF of 3 in one zone dangerous Placement Groups may make this worse Unexpected events - AWS Global Reboot Stability Patterns Highest numbered instance type in a family Multi Availability Zone + block placement Make changes to only one cluster at a time Strategies for mitigating failure 32 Master Slave US-East-1A US-East-1E Replication Physical Host
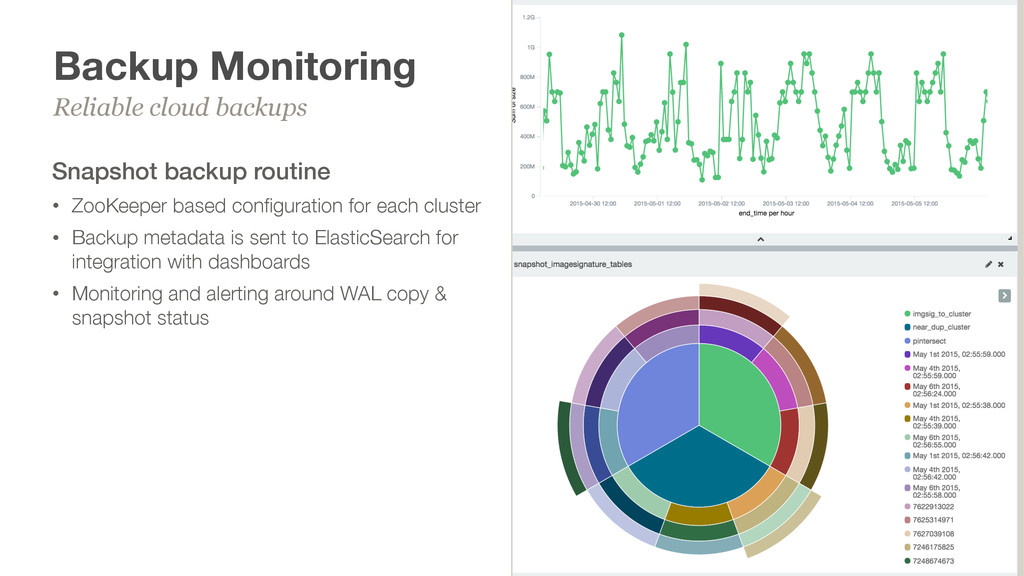
each cluster • Backup metadata is sent to ElasticSearch for integration with dashboards • Monitoring and alerting around WAL copy & snapshot status Reliable cloud backups 34
Avoid blocked region in queue Controlled concurrency • Control the space spike • Reduce increased network and disk traffic Controlled time to stop • Stop before day time traffic ramp up • Stop if compaction causing perf issue Resume the next night • Filter out the regions that has run compaction Important for online facing clusters 36
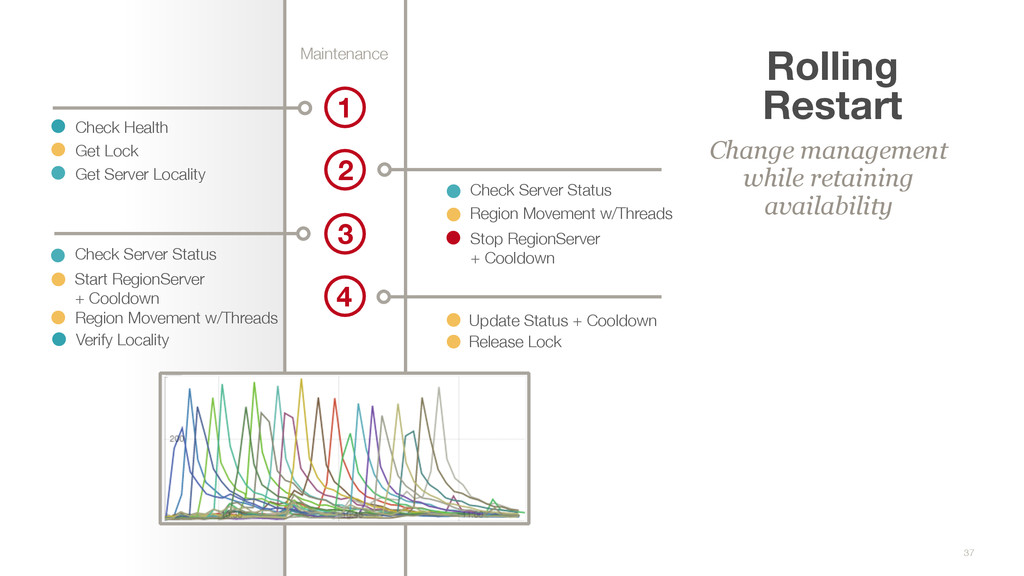
Check Server Status Region Movement w/Threads Start RegionServer + Cooldown Release Lock Update Status + Cooldown Rolling Restart Change management while retaining availability 1 2 3 Region Movement w/Threads Stop RegionServer + Cooldown Verify Locality Check Server Status
downtime Increasing performance • Lower latency • Better compaction throughput / less write amplification Regional Failover • Cross datacenter is in production now • Failing over between AWS regions Looking forward 38