and port information (No DNS entries) • Information regarding environment (prod, staging, dev) Look up a service • Retrieve a list of all ip:ports providing a service Notification when things change • Update provider list when a change occurs • List is not static. Ex: Autoscaling inside of EC2. Failed daemons • Application handles reconfiguration calls Provide a central service registry
different ports • Using resource containment techniques • Running client side load balancers • Applications register availability with service discovery system directly • Remove registration on failure • Sidecar application for 3rd party code, or apps in different languages Discovery based app svc-<uuid> storage app app app storage app app svc-<uuid> Client 4 storage 5 6 db-<uuid> 1 2 3 app app app Service Client Service Downstream app app app
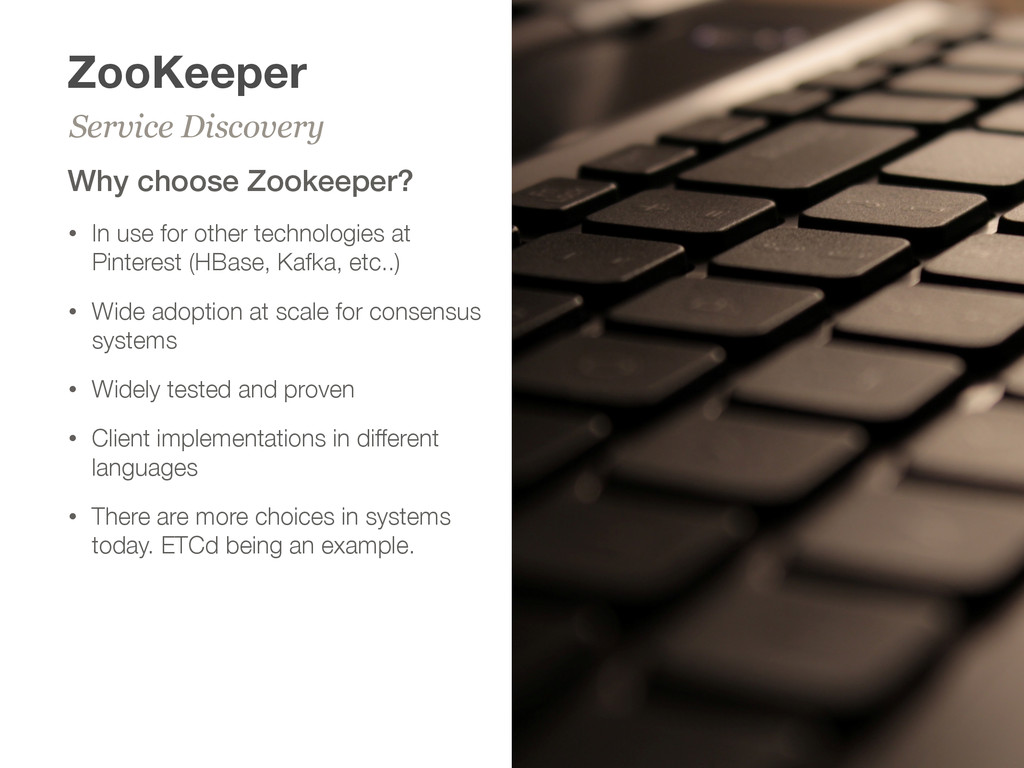
at Pinterest (HBase, Kafka, etc..) • Wide adoption at scale for consensus systems • Widely tested and proven • Client implementations in different languages • There are more choices in systems today. ETCd being an example. Service Discovery
main quorum. Usual size is 3,5,7 nodes. • Main quorum is mainly limited by write throughput • Observers are a non-voting member of the quorum. • Observers are a key part of the scaling of the system. Roles in the system
availability zones (datacenters) • Observers located in each datacenter to proxy access to main quorum • Applications read/write to main quorum through the observers • Majority of the read traffic is serviced by observers • Running version 3.5.x in production (dynamic reconfiguration, scalability improvements). • Currently serving ~150,000 watches Observer US-East-1A US-East-1B US-East-1C 1 2 3 4 5 6 7 10 11 12 13 14 15 16 17 18 19 20 21 app app app app app app app app app Participant
observers • Using 3.5.x for localSessions on observers. Removes a tremendous amount of load from the main quorum • If the main quorum experiences availability issues, clients may choose to read stale data from the observers • c3.2xlarge+ instance types (SSD) globalOutstandingLimit=[30k, 60k] localSessionsEnabled=true localSessionsUpgradingEnabled=true -Xmx12G -Xms12G -XX:+UseConcMarkSweepGC - XX:NewSize=4G -Dreadonlymode.enabled Scaling reads 1 2 3 4 5 6 7 10 11 12 13 14 15 16 17 18 19 20 21 app app Quorum Writes
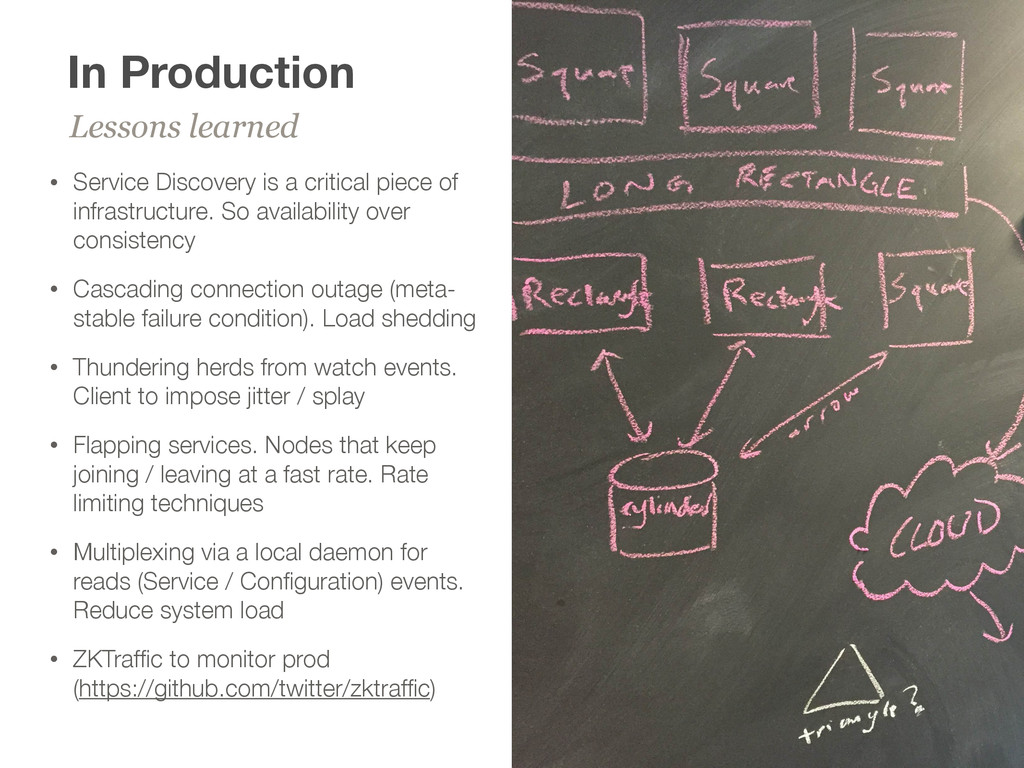
piece of infrastructure. So availability over consistency • Cascading connection outage (meta- stable failure condition). Load shedding • Thundering herds from watch events. Client to impose jitter / splay • Flapping services. Nodes that keep joining / leaving at a fast rate. Rate limiting techniques • Multiplexing via a local daemon for reads (Service / Configuration) events. Reduce system load • ZKTraffic to monitor prod (https://github.com/twitter/zktraffic)
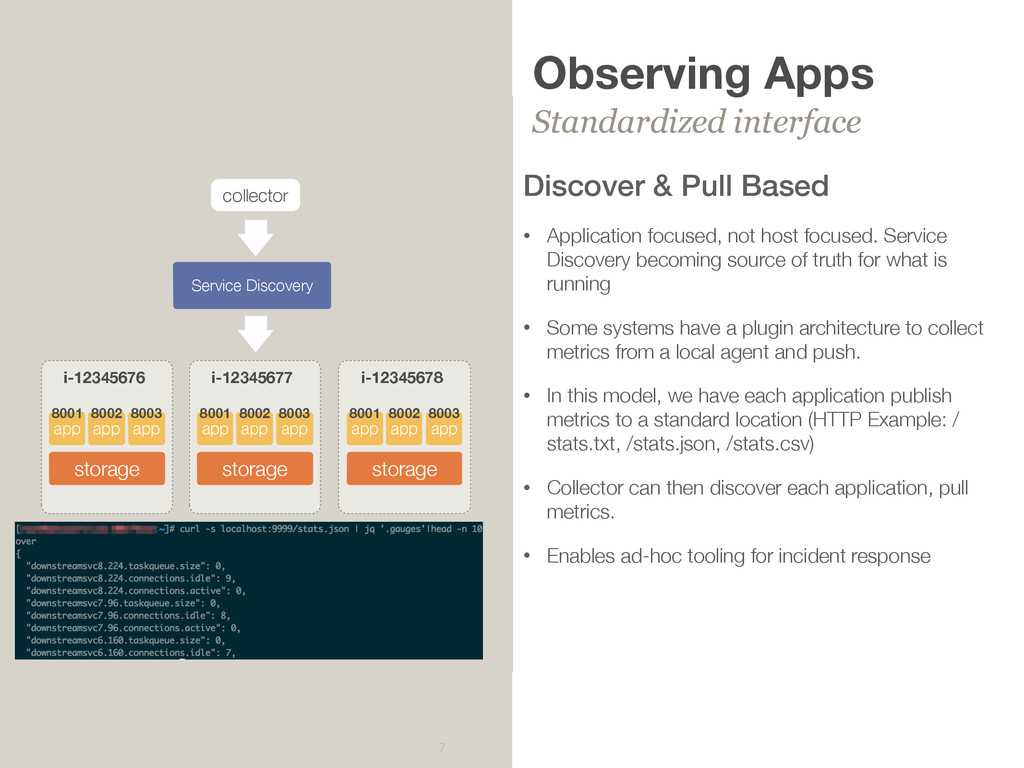
focused, not host focused. Service Discovery becoming source of truth for what is running • Some systems have a plugin architecture to collect metrics from a local agent and push. • In this model, we have each application publish metrics to a standard location (HTTP Example: / stats.txt, /stats.json, /stats.csv) • Collector can then discover each application, pull metrics. • Enables ad-hoc tooling for incident response app storage app app i-12345676 8001 8002 8003 Service Discovery app storage app app i-12345677 8001 8002 8003 app storage app app i-12345678 8001 8002 8003 collector
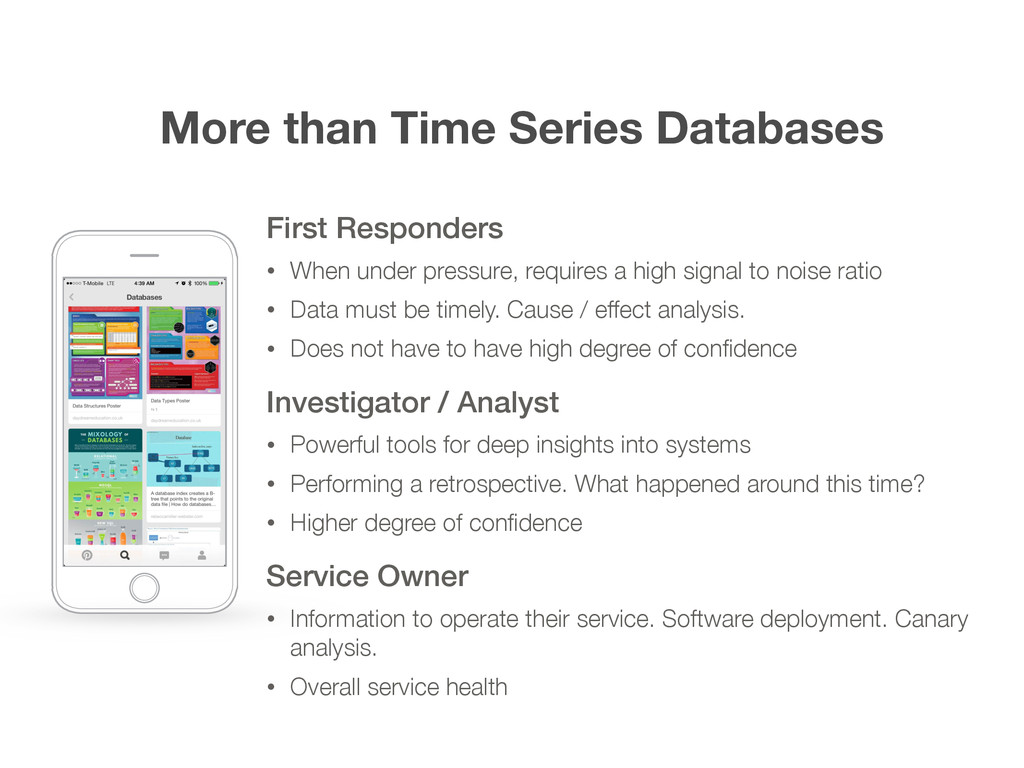
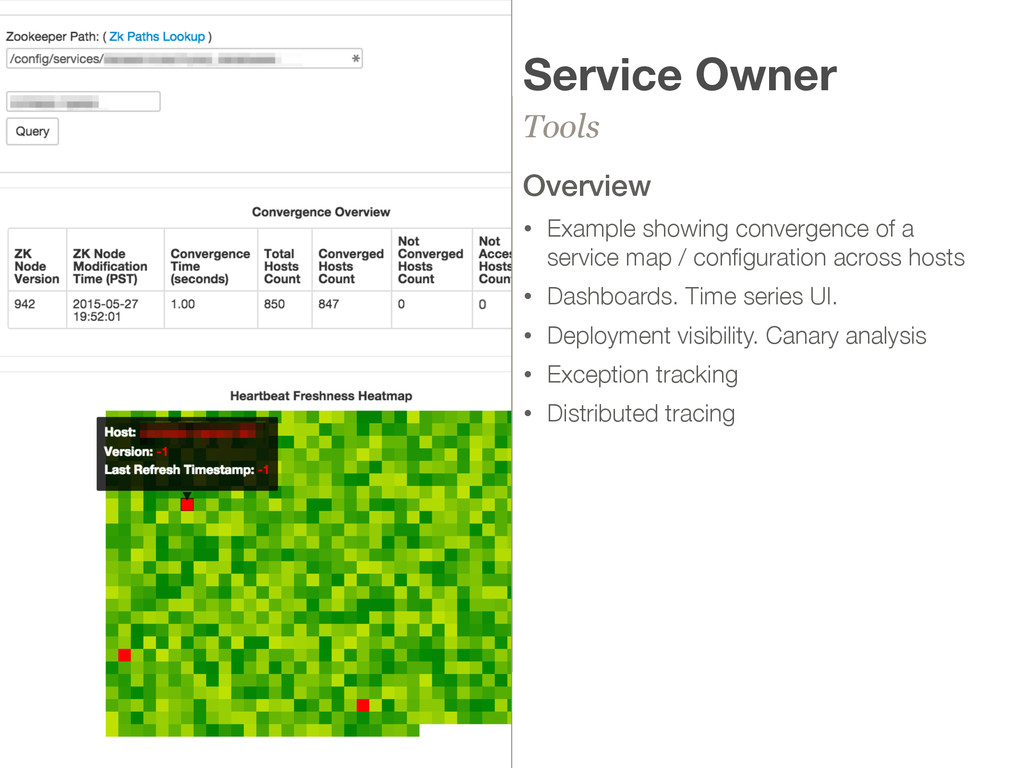
pressure, requires a high signal to noise ratio • Data must be timely. Cause / effect analysis. • Does not have to have high degree of confidence Investigator / Analyst • Powerful tools for deep insights into systems • Performing a retrospective. What happened around this time? • Higher degree of confidence Service Owner • Information to operate their service. Software deployment. Canary analysis. • Overall service health 2:50 PM 100%
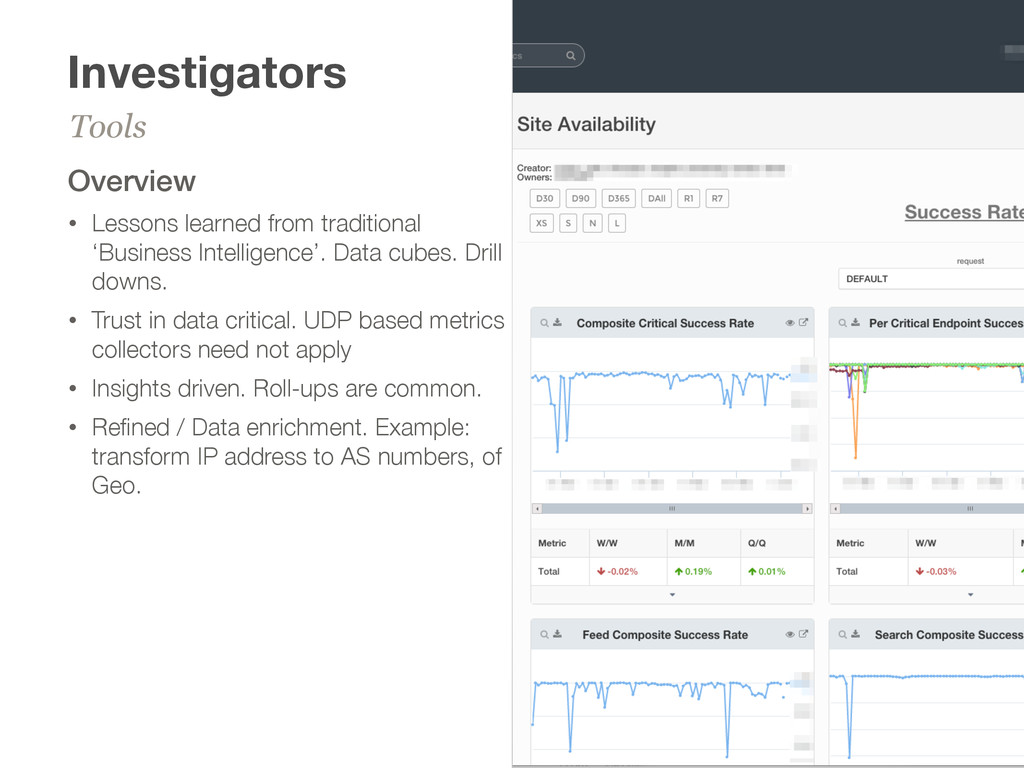
cubes. Drill downs. • Trust in data critical. UDP based metrics collectors need not apply • Insights driven. Roll-ups are common. • Refined / Data enrichment. Example: transform IP address to AS numbers, of Geo. Tools
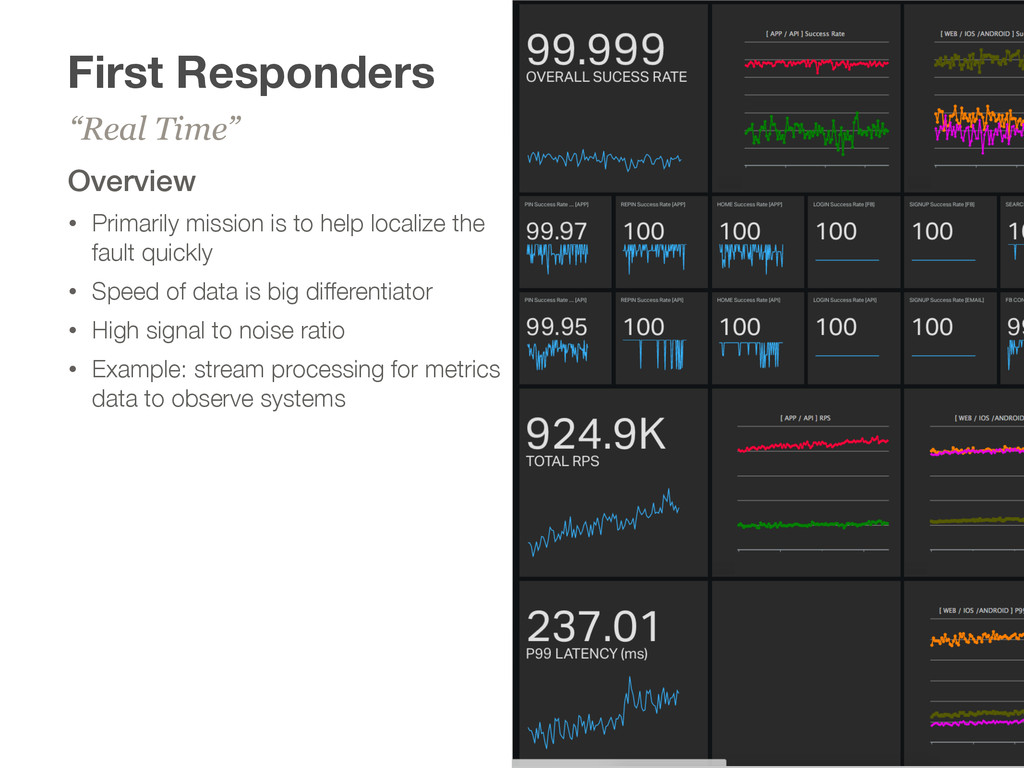
the fault quickly • Speed of data is big differentiator • High signal to noise ratio • Example: stream processing for metrics data to observe systems “Real Time”
Series UI’s” - Many of the same challenges in traditional ‘Big Data’ processing systems - Scalable back ends. Can grow with your data volume • Reliable delivery of data should be part of your observability system - If you lose trust and confidence in your service, adoption will suffer • “Containerization” will change a lot of things - Not many tools built to handle dynamic configuration of fleet - Handling ephemeral data & summarization. Ex: Host metrics that last for hours, then are seen no more • We are hiring. https://about.pinterest.com/en/careers thanks for listening