Internal code instrumented • Ostrich for Java processes • StatsD / Sentry / Kafka for Python • Distributed tracing system to log stream. • Logs to go S3 or Kafka for EMR / Hive jobs • Application metrics trapped • Varnish / MySQL / Nginx / Redis, etc. • Tools for certain products Wednesday, 15 May 13 Code that we produce, we instrument StopWatch (Distributed Tracing System) We use specialized tools for certian systems. A lot of the percona / box tools (RainGauge / pt-query-digest).
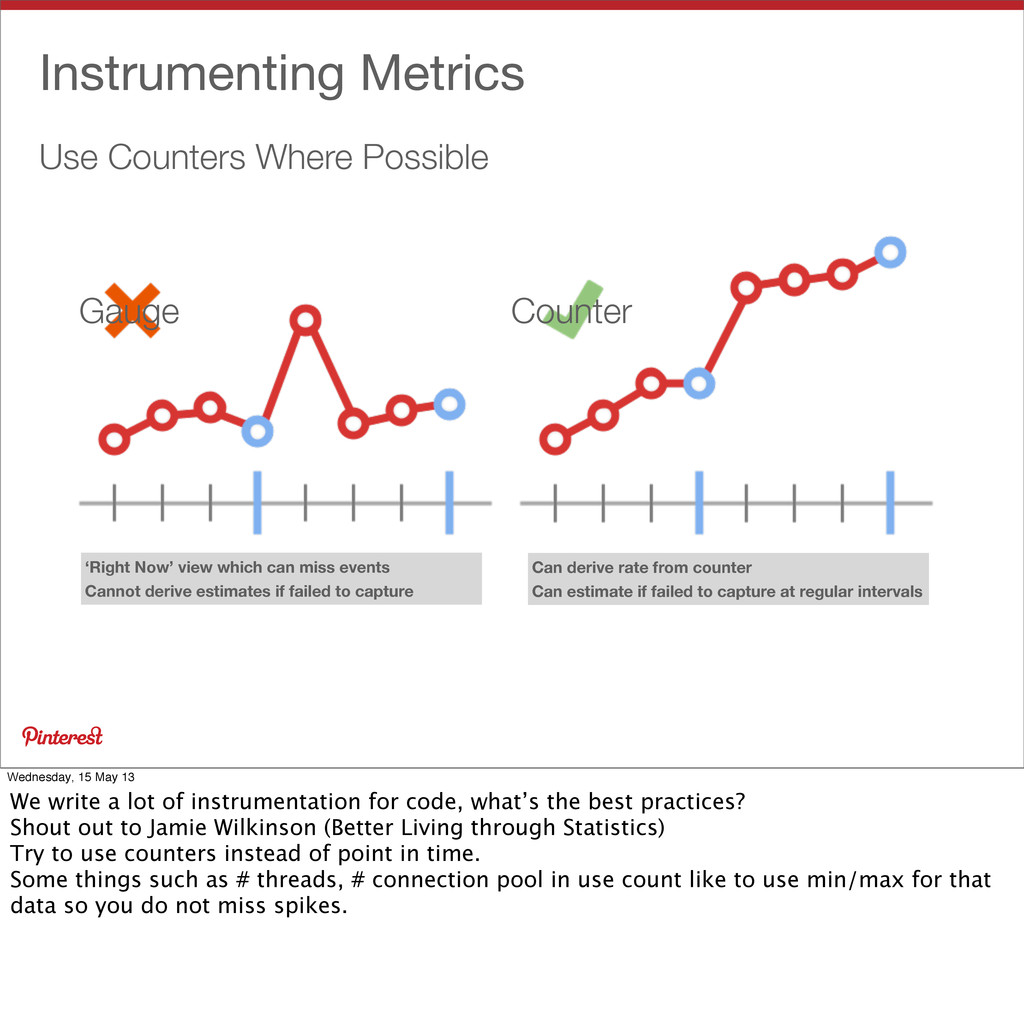
can miss events Cannot derive estimates if failed to capture Can derive rate from counter Can estimate if failed to capture at regular intervals Gauge Counter Wednesday, 15 May 13 We write a lot of instrumentation for code, what’s the best practices? Shout out to Jamie Wilkinson (Better Living through Statistics) Try to use counters instead of point in time. Some things such as # threads, # connection pool in use count like to use min/max for that data so you do not miss spikes.
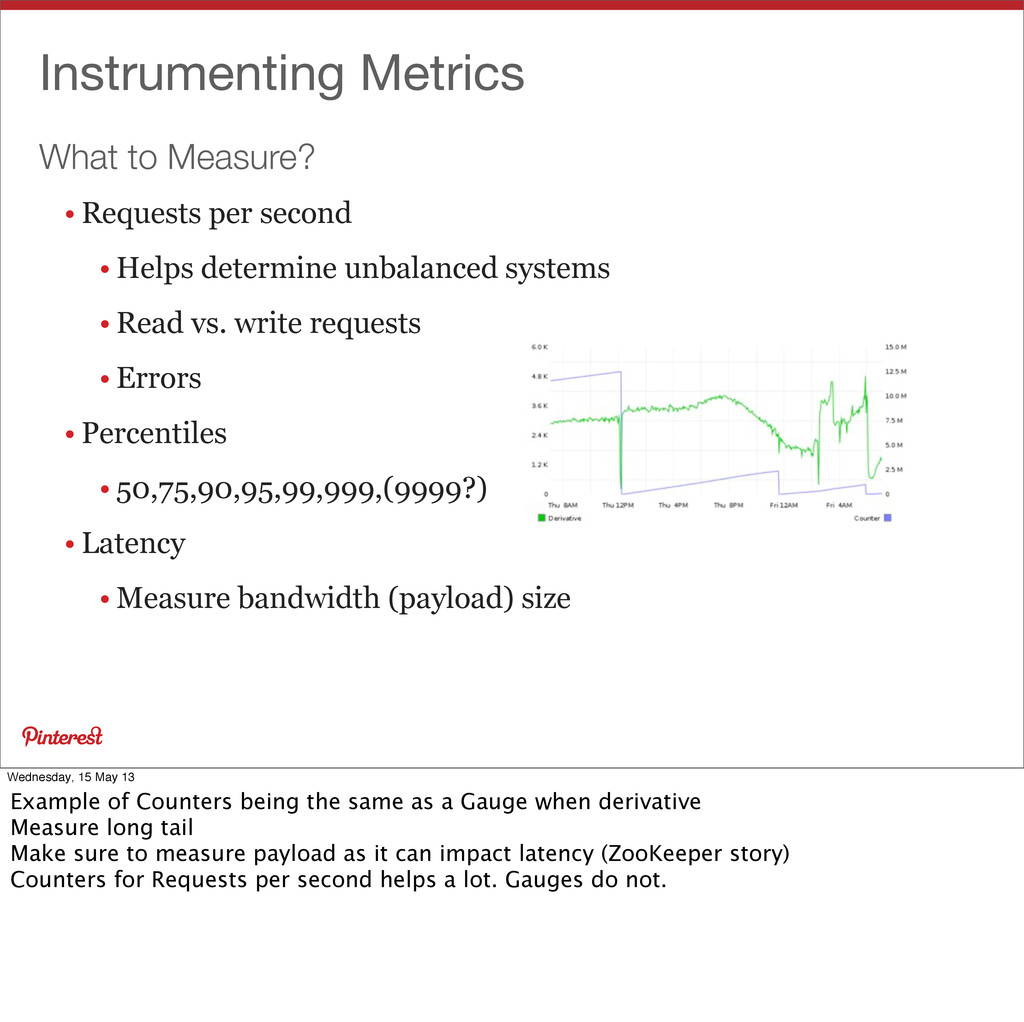
Helps determine unbalanced systems • Read vs. write requests • Errors • Percentiles • 50,75,90,95,99,999,(9999?) • Latency • Measure bandwidth (payload) size Wednesday, 15 May 13 Example of Counters being the same as a Gauge when derivative Measure long tail Make sure to measure payload as it can impact latency (ZooKeeper story) Counters for Requests per second helps a lot. Gauges do not.
Source Tools • Graphite • StatsD • Ganglia • Ostrich • OpenTSDB • Sentry • Kafka • and more ... Wednesday, 15 May 13 John Allspaw quote from the “Monitoring with Ganglia”. Never one tool that’s best at anything. One dashboard / tool to rule them all does not work. Embrace diversity.
Since there is no one tool that can do them all, how do we choose where to store metrics? Ganglia great for node / host / cluster view. OpenTSDB considered almost a ‘analytical TSD’ as it can store amazing amount of metrics Kafka since we need the raw logs. Talk about S3 as a light weight Kafka with copy jobs Graphite for application metrics. StatsD to give power to Devs to create any metric on the fly
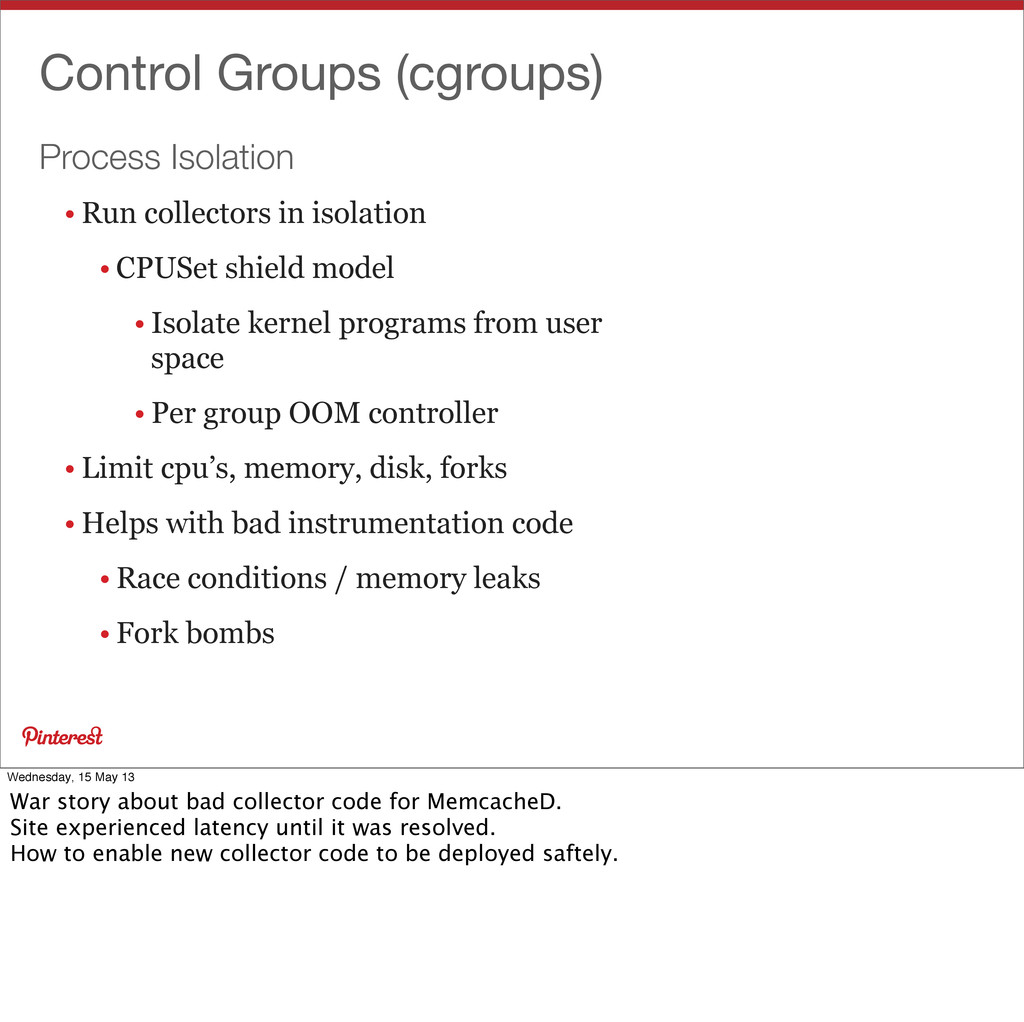
• CPUSet shield model • Isolate kernel programs from user space • Per group OOM controller • Limit cpu’s, memory, disk, forks • Helps with bad instrumentation code • Race conditions / memory leaks • Fork bombs Wednesday, 15 May 13 War story about bad collector code for MemcacheD. Site experienced latency until it was resolved. How to enable new collector code to be deployed saftely.
Great scalability • RRDCached • High Availability • Multiple Datastores (GMETAD) • Multiple Collectors (GMOND) Wednesday, 15 May 13 Why Ganglia? Scalable Collection via Leaf / Node system Custom metrics with gmetric through scripting. Or python processes as gmond plugins Best practice setup with RRDcached buffering disk. Non SSD installation.
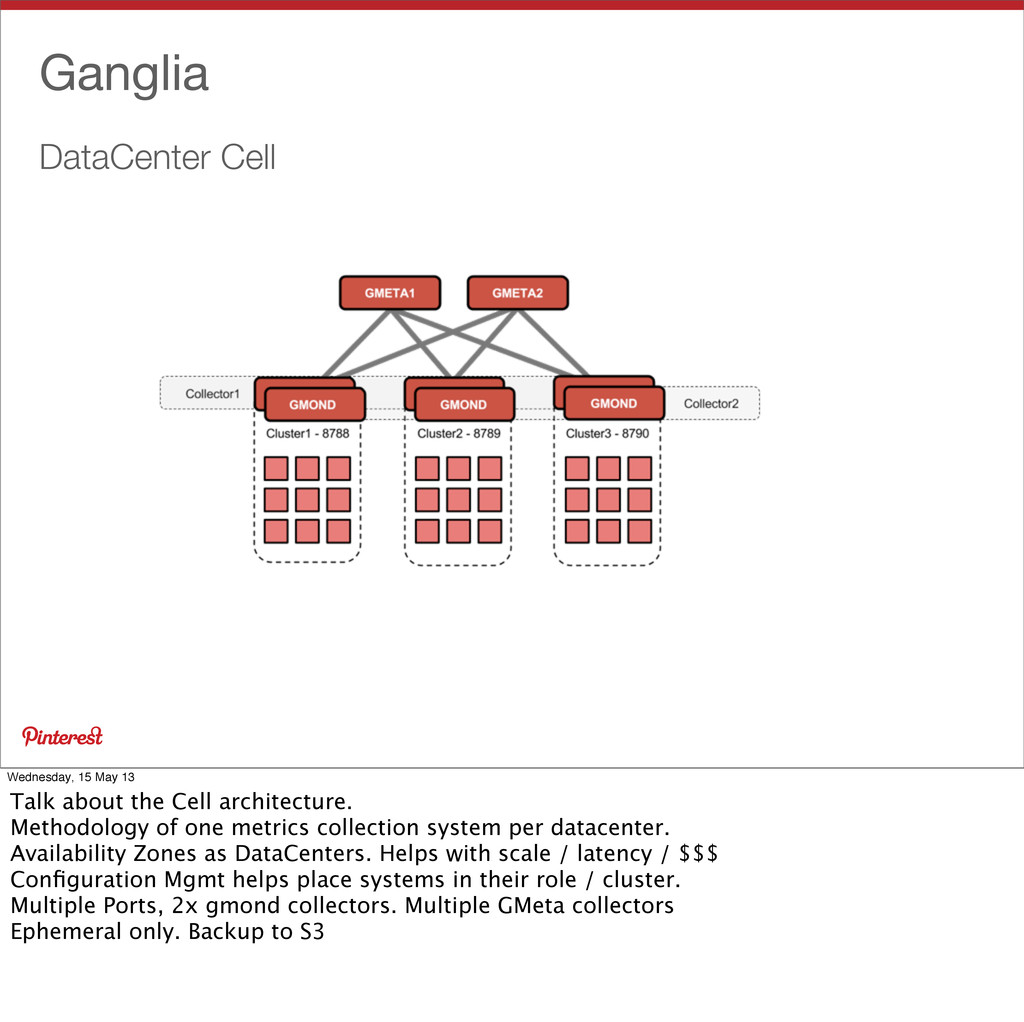
Cell architecture. Methodology of one metrics collection system per datacenter. Availability Zones as DataCenters. Helps with scale / latency / $$$ Configuration Mgmt helps place systems in their role / cluster. Multiple Ports, 2x gmond collectors. Multiple GMeta collectors Ephemeral only. Backup to S3
May 13 Now we have multiple datacenters. All with a lot of metrics. Front-end Nginx as a reverse proxy to a datacenters ganglia installation. two gmetas as backend nodes. Round robin. max_fails=1. Friendly CNames point to the NGinx pool. Gagnlia-us-east-1a, etc.. Have not seen the need at this time to do per-cluster gmeta. But an option to scale.
system and ganglia scaled great. Forgot about the end users during this time. Lesson learned. Usability of a metrics system is very important. Dashboards now became a problem. Launched 50 more web servers. - Where did they get placed? Dashboards broke. Where do I pull my host metrics from?
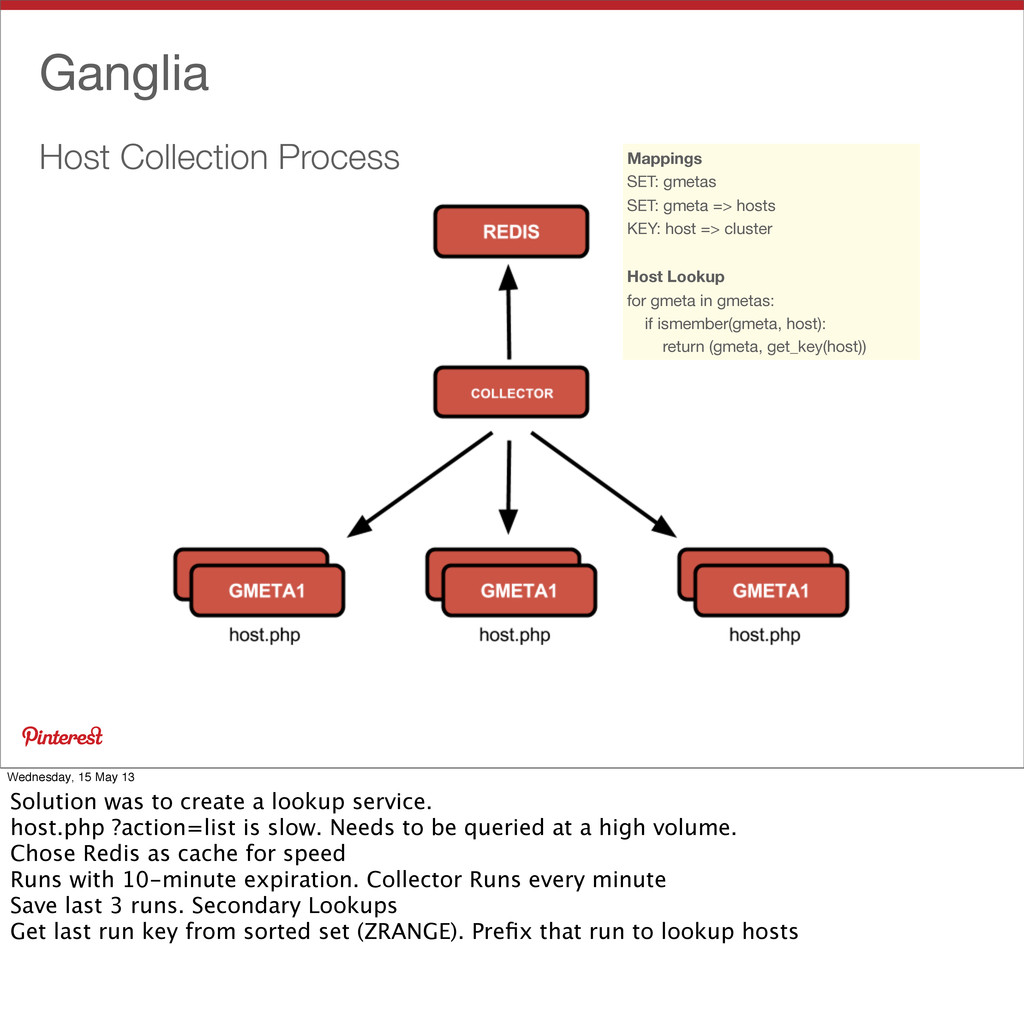
hosts KEY: host => cluster Host Lookup for gmeta in gmetas: if ismember(gmeta, host): return (gmeta, get_key(host)) Wednesday, 15 May 13 Solution was to create a lookup service. host.php ?action=list is slow. Needs to be queried at a high volume. Chose Redis as cache for speed Runs with 10-minute expiration. Collector Runs every minute Save last 3 runs. Secondary Lookups Get last run key from sorted set (ZRANGE). Prefix that run to lookup hosts
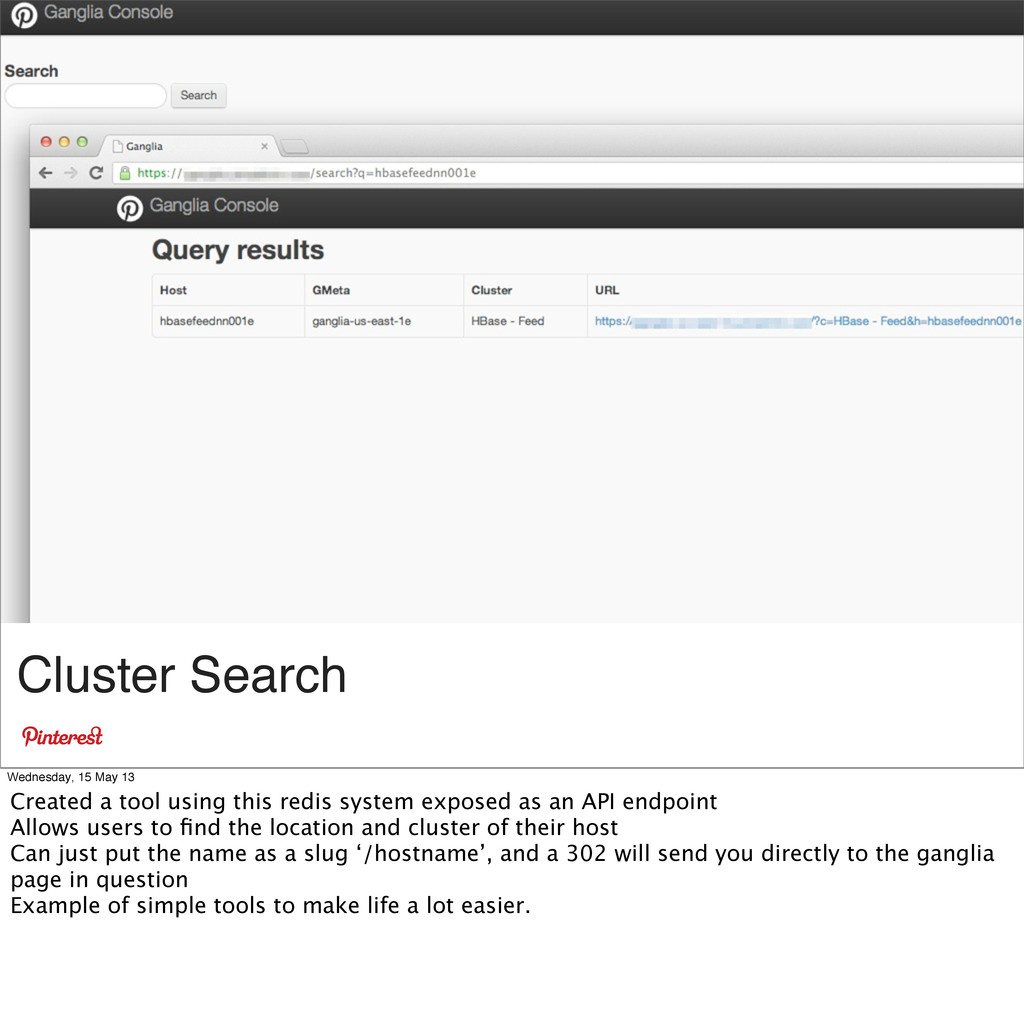
this redis system exposed as an API endpoint Allows users to find the location and cluster of their host Can just put the name as a slug ‘/hostname’, and a 302 will send you directly to the ganglia page in question Example of simple tools to make life a lot easier.
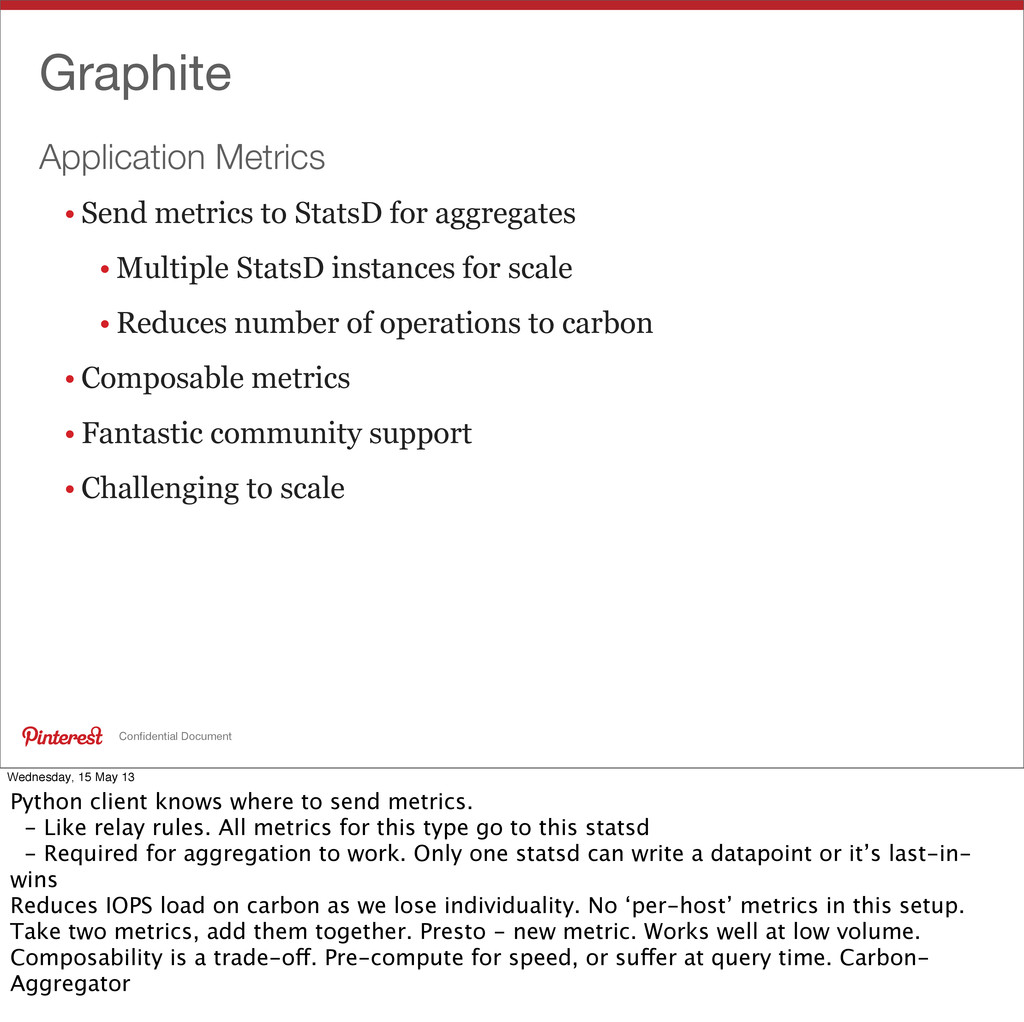
for aggregates • Multiple StatsD instances for scale • Reduces number of operations to carbon • Composable metrics • Fantastic community support • Challenging to scale Wednesday, 15 May 13 Python client knows where to send metrics. - Like relay rules. All metrics for this type go to this statsd - Required for aggregation to work. Only one statsd can write a datapoint or it’s last-in- wins Reduces IOPS load on carbon as we lose individuality. No ‘per-host’ metrics in this setup. Take two metrics, add them together. Presto - new metric. Works well at low volume. Composability is a trade-off. Pre-compute for speed, or suffer at query time. Carbon- Aggregator
From one host to this. CPU on the relays is the first to go. Then IOPS on the Whisper hosts How to scale to add a new host? Not very clear. - Some ppl pre-shard then move data. - Replication factor=1 for high availability Flow Control / Queues to prevent cascading failure. Hard to tune. Carbon is very performant. Disqus at 1.8million metrics/s (900k IOPS). Scale is the question. 26 SSD hosts.
unique metrics • Over 60 billion points on 10 node cluster • MemcacheD ketama ring / slab stats • HBase dynamic metrics • Network performance data • Low storage cost per metric • ~8bytes / data point w/Snappy • Scales to handle additional load Wednesday, 15 May 13 Not a simple system. But neither is Carbon at scale. Does not summarize data -- ever. Carbon / RRD summarize data by default. Have to store nulls (Fixed cell). Getting better all the time. Community is coming around. Lots of new development Have to learn HDFS / HBase. Currently at a 10 node (Non-SSD) cluster for testing. working very well. Currently around 20-billion data points.
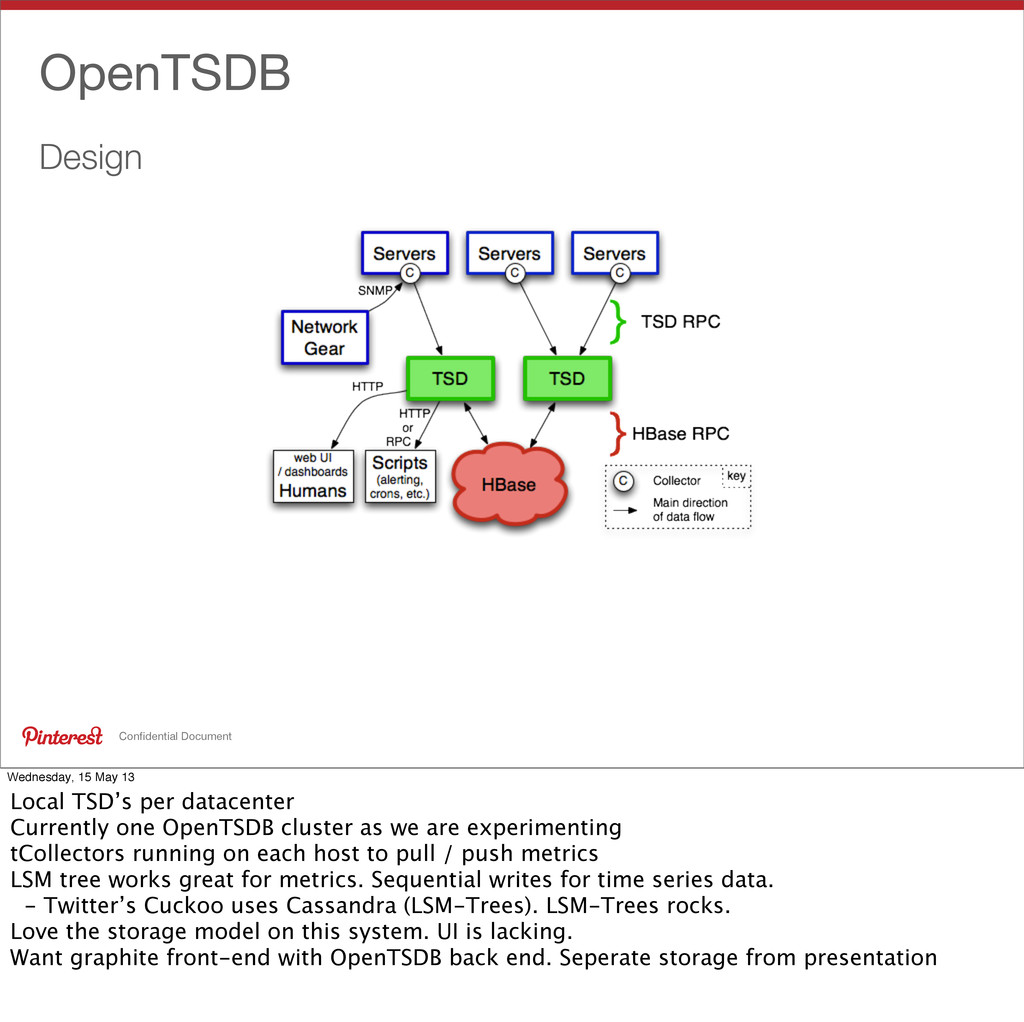
per datacenter Currently one OpenTSDB cluster as we are experimenting tCollectors running on each host to pull / push metrics LSM tree works great for metrics. Sequential writes for time series data. - Twitter’s Cuckoo uses Cassandra (LSM-Trees). LSM-Trees rocks. Love the storage model on this system. UI is lacking. Want graphite front-end with OpenTSDB back end. Seperate storage from presentation
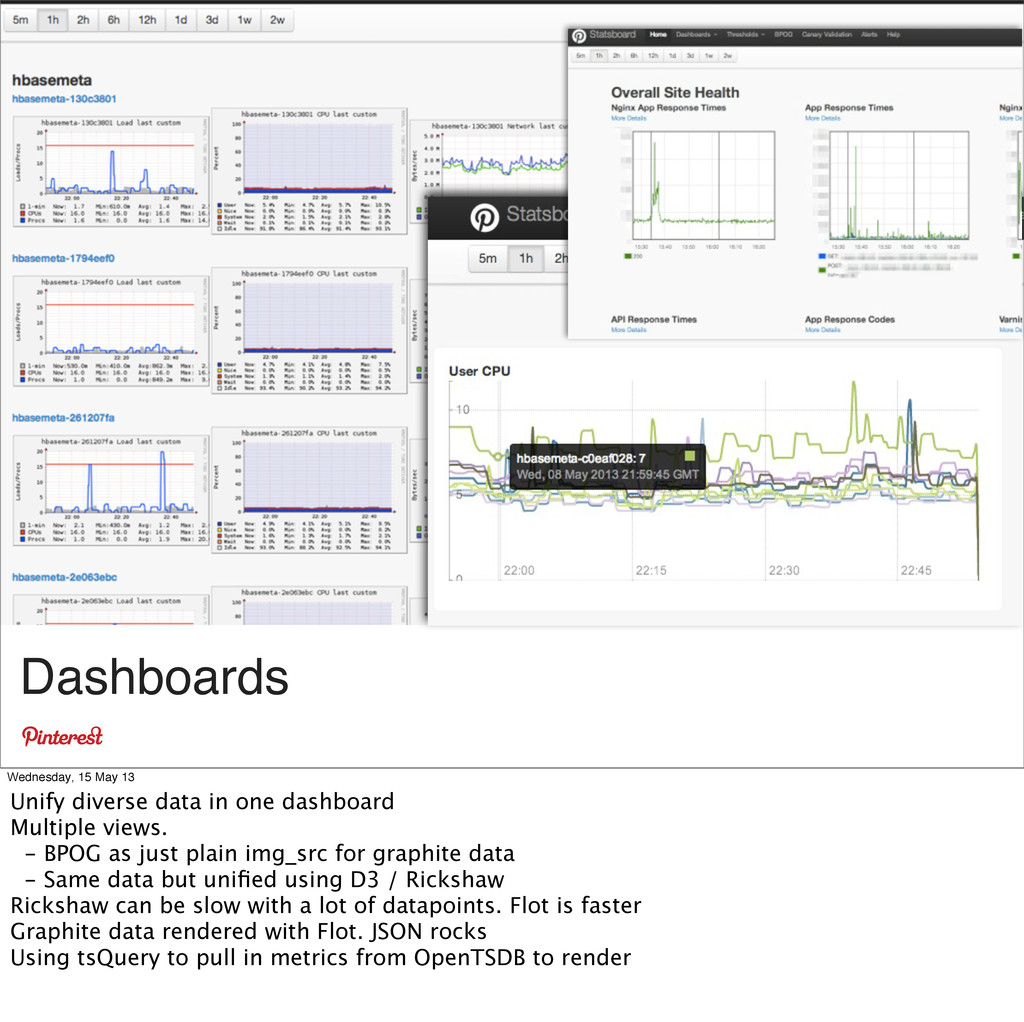
dashboard Multiple views. - BPOG as just plain img_src for graphite data - Same data but unified using D3 / Rickshaw Rickshaw can be slow with a lot of datapoints. Flot is faster Graphite data rendered with Flot. JSON rocks Using tsQuery to pull in metrics from OpenTSDB to render
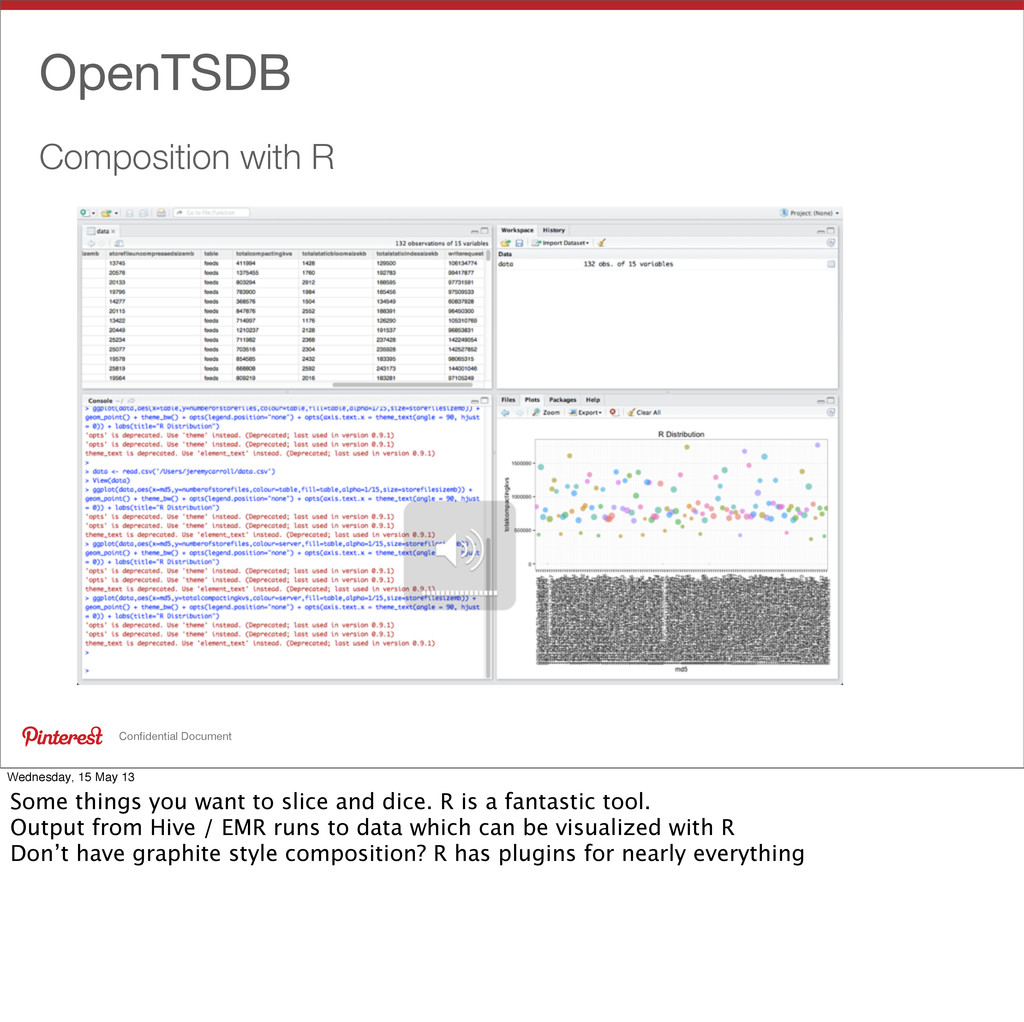
Some things you want to slice and dice. R is a fantastic tool. Output from Hive / EMR runs to data which can be visualized with R Don’t have graphite style composition? R has plugins for nearly everything