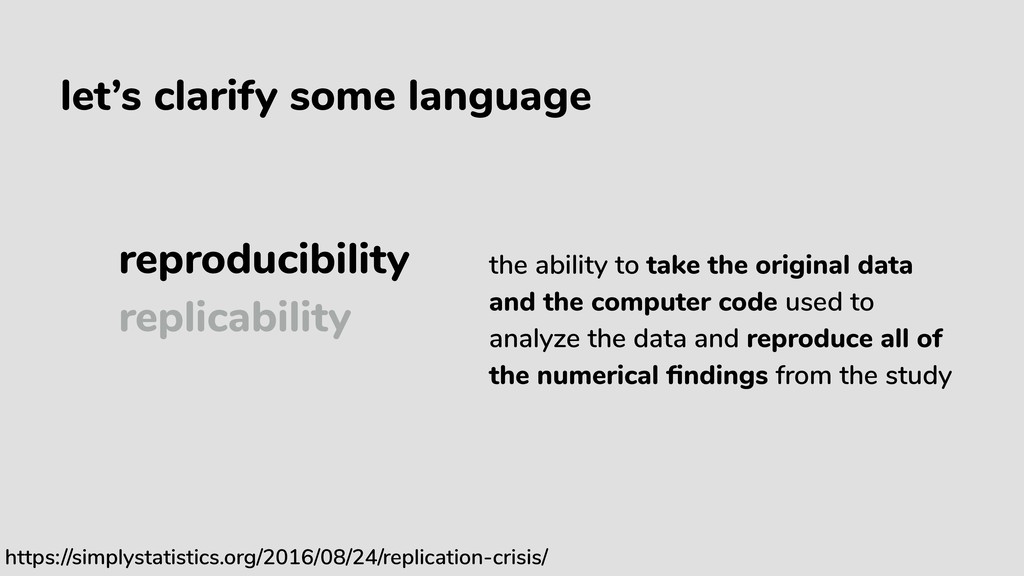
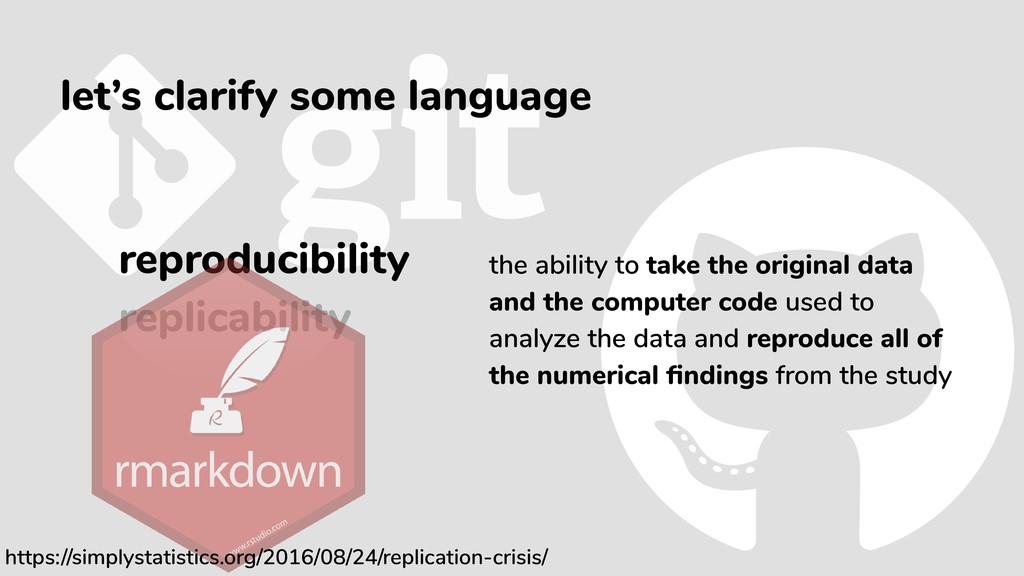
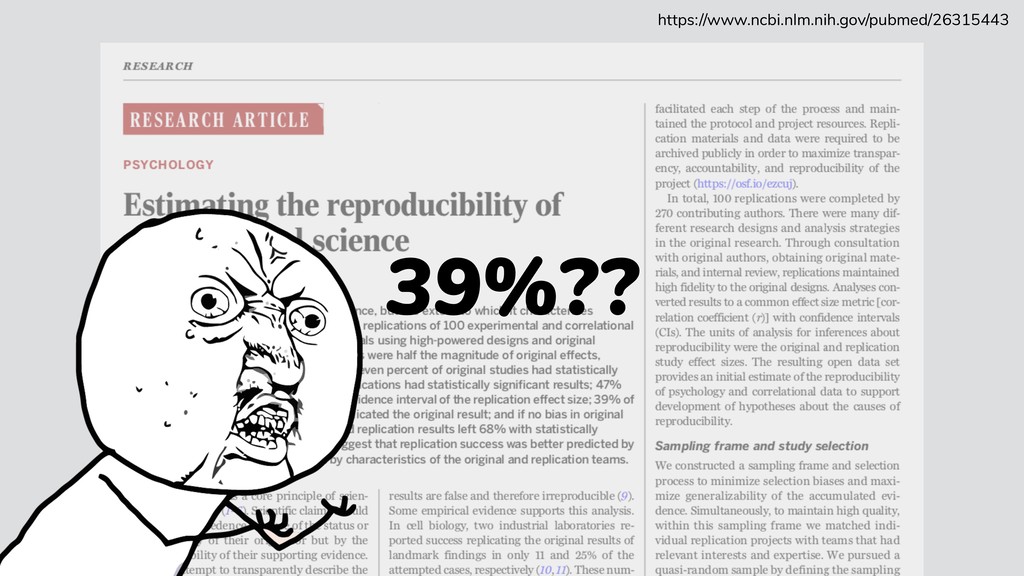
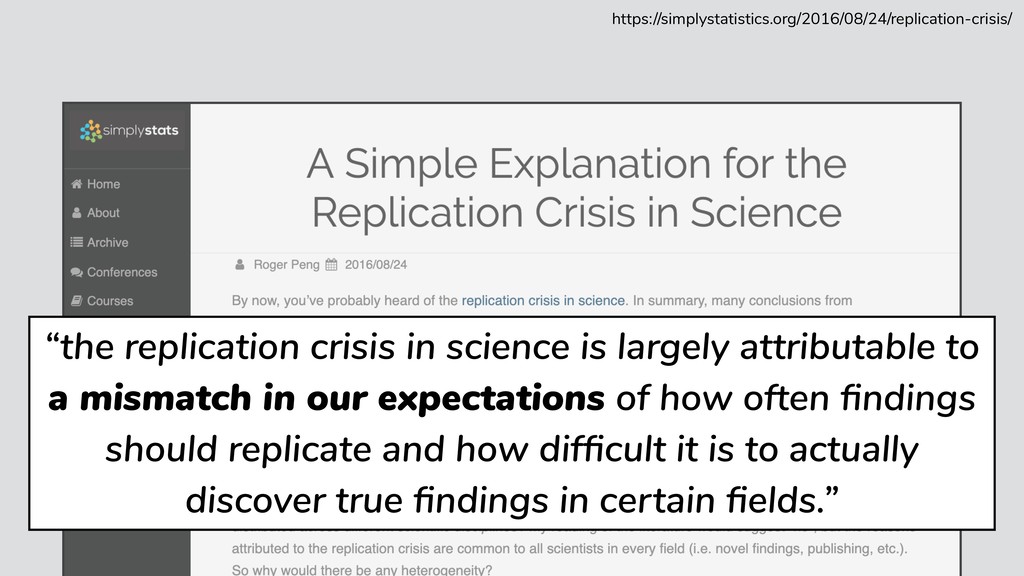
the original data and the computer code used to analyze the data and reproduce all of the numerical findings from the study https://simplystatistics.org/2016/08/24/replication-crisis/
the original data and the computer code used to analyze the data and reproduce all of the numerical findings from the study https://simplystatistics.org/2016/08/24/replication-crisis/
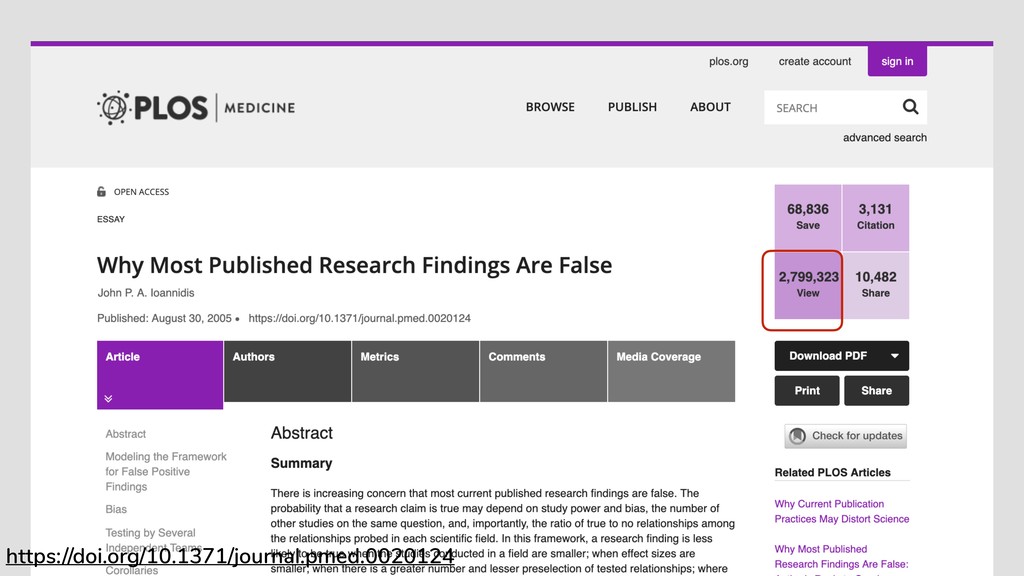
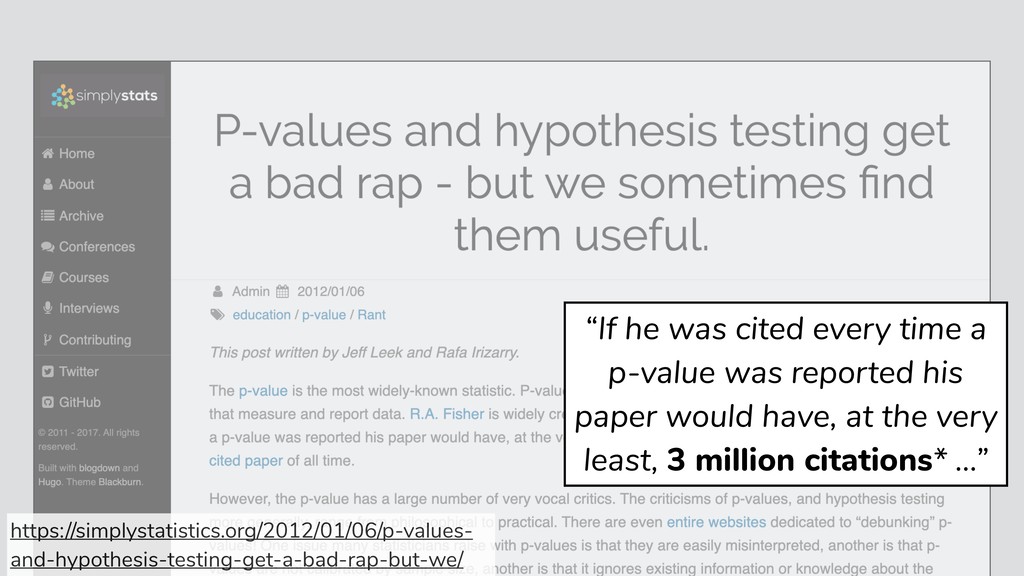
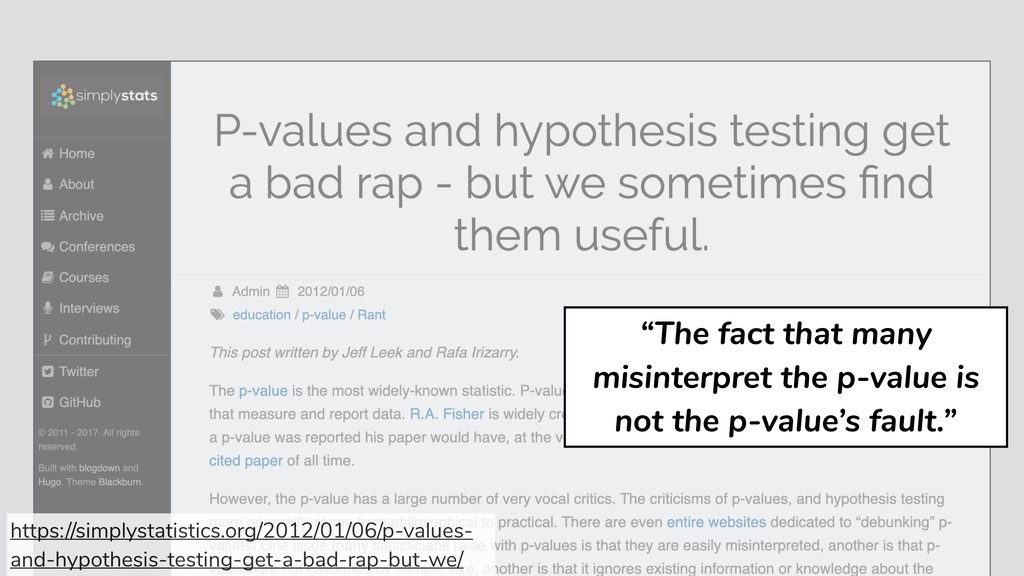
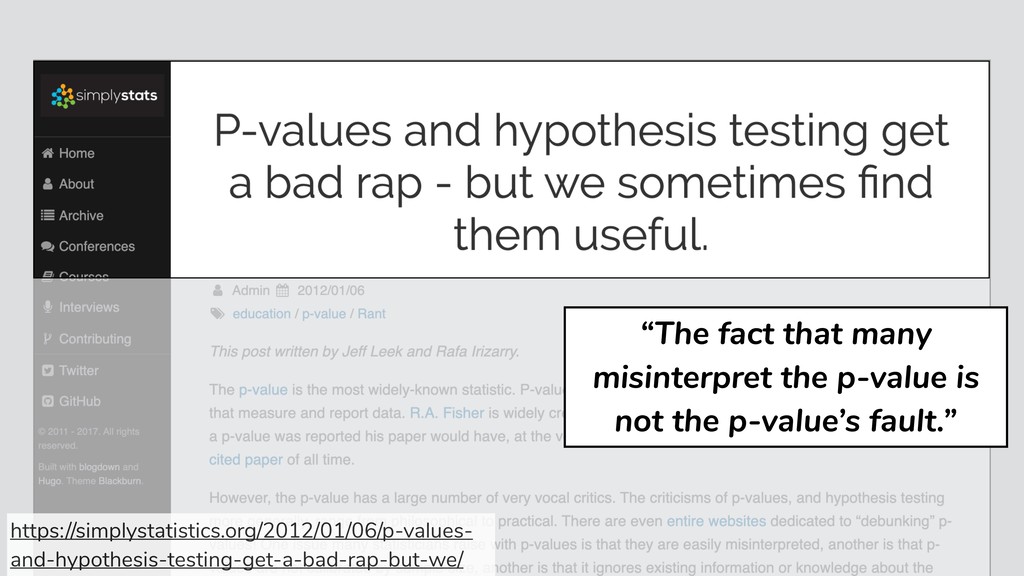
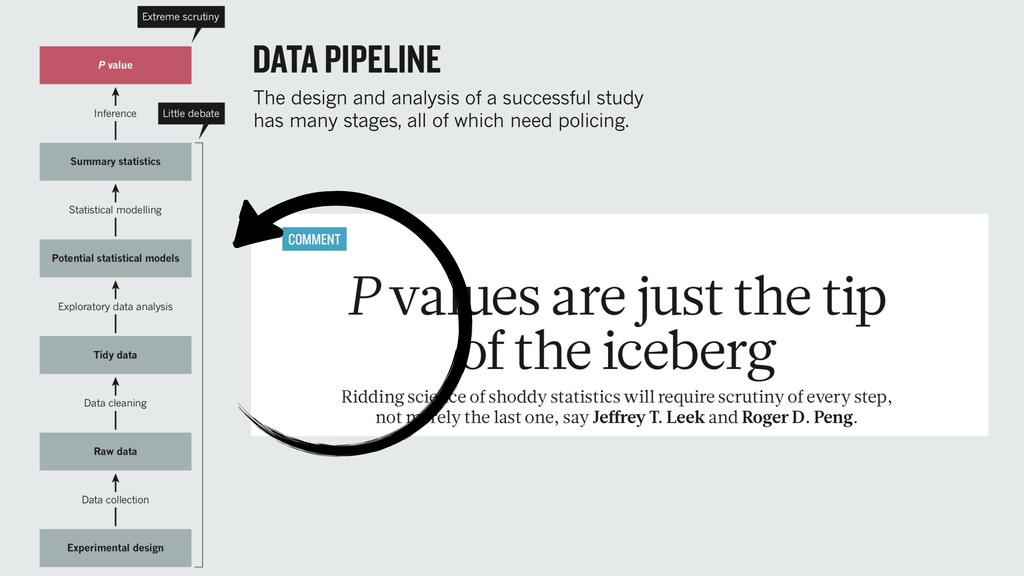
his paper would have, at the very least, 3 million citations* …” https://simplystatistics.org/2012/01/06/p-values- and-hypothesis-testing-get-a-bad-rap-but-we/
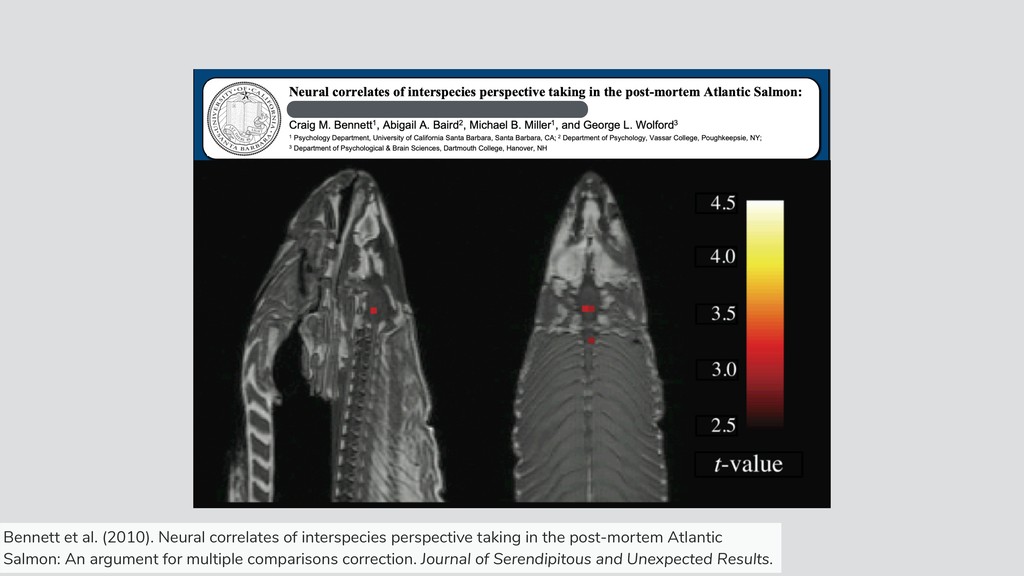
perspective taking in the post-mortem Atlantic Salmon: An argument for multiple comparisons correction. Journal of Serendipitous and Unexpected Results.
of interspecies perspective taking in the post-mortem Atlantic Salmon: An argument for multiple comparisons correction. Journal of Serendipitous and Unexpected Results.
perspective taking in the post-mortem Atlantic Salmon: An argument for multiple comparisons correction. Journal of Serendipitous and Unexpected Results.
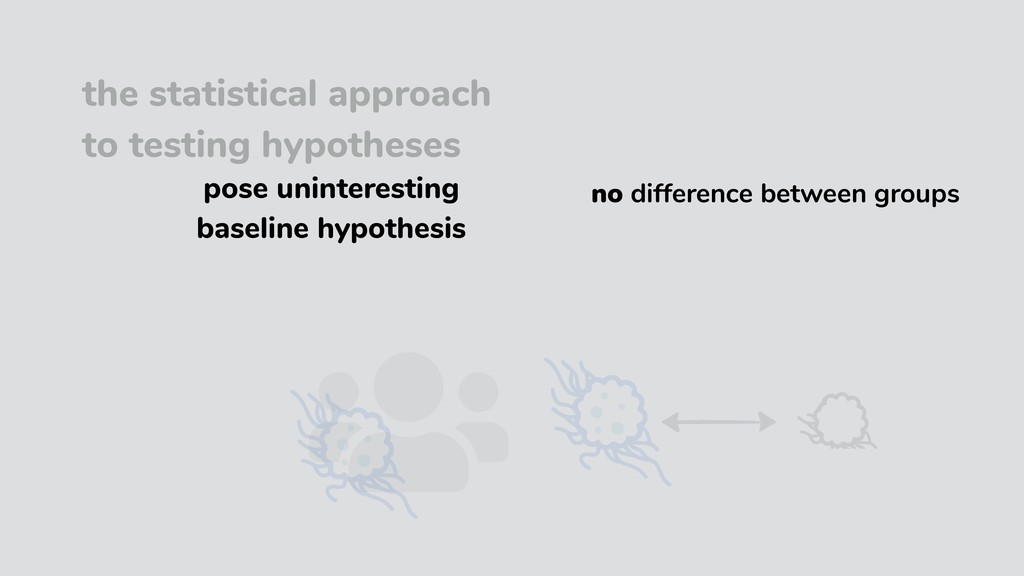
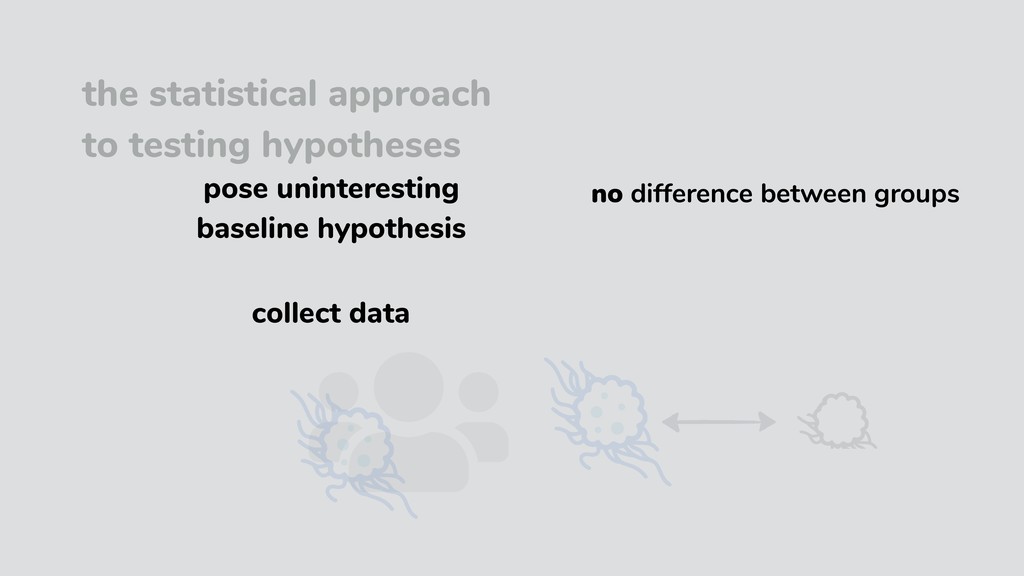
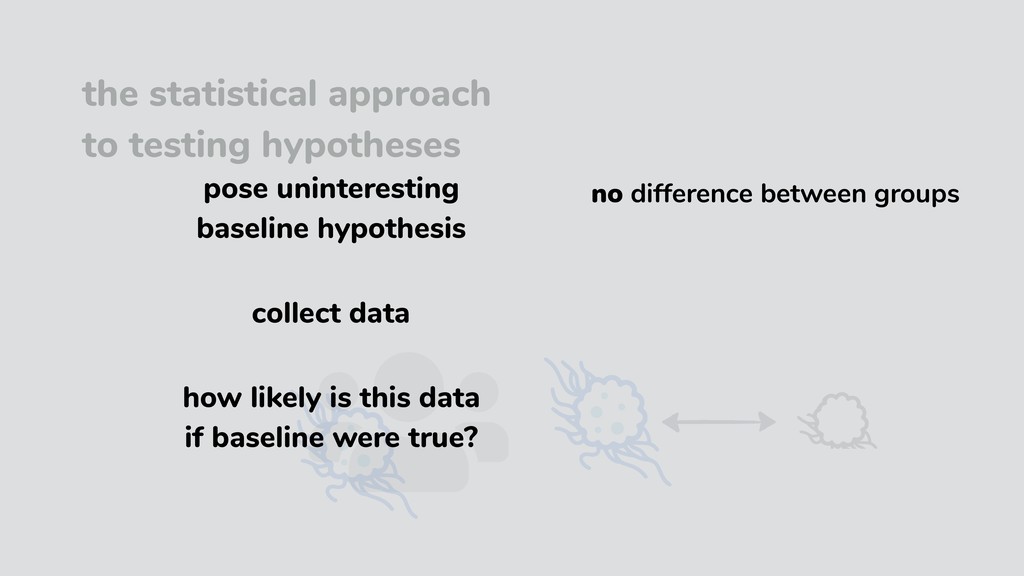
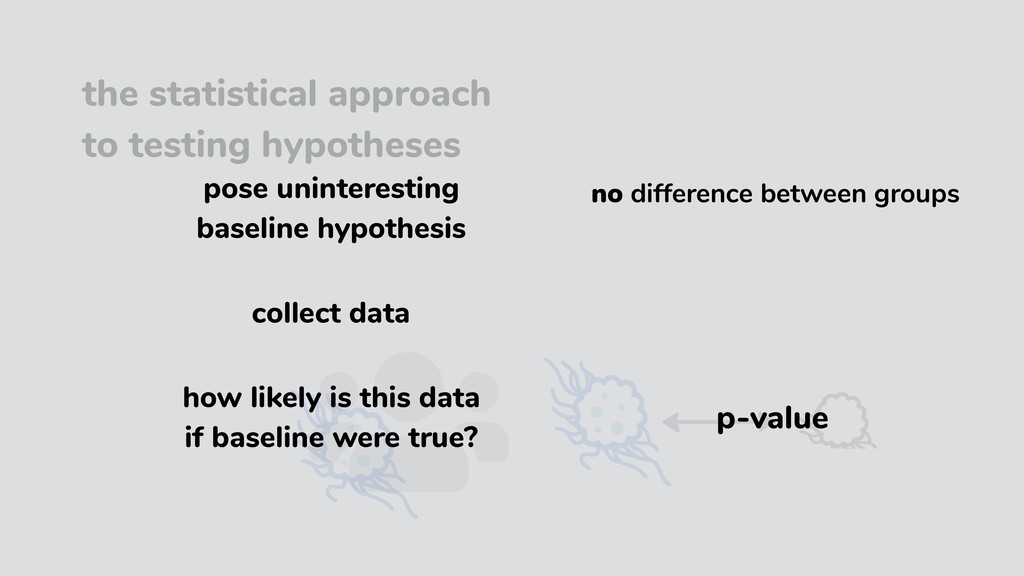
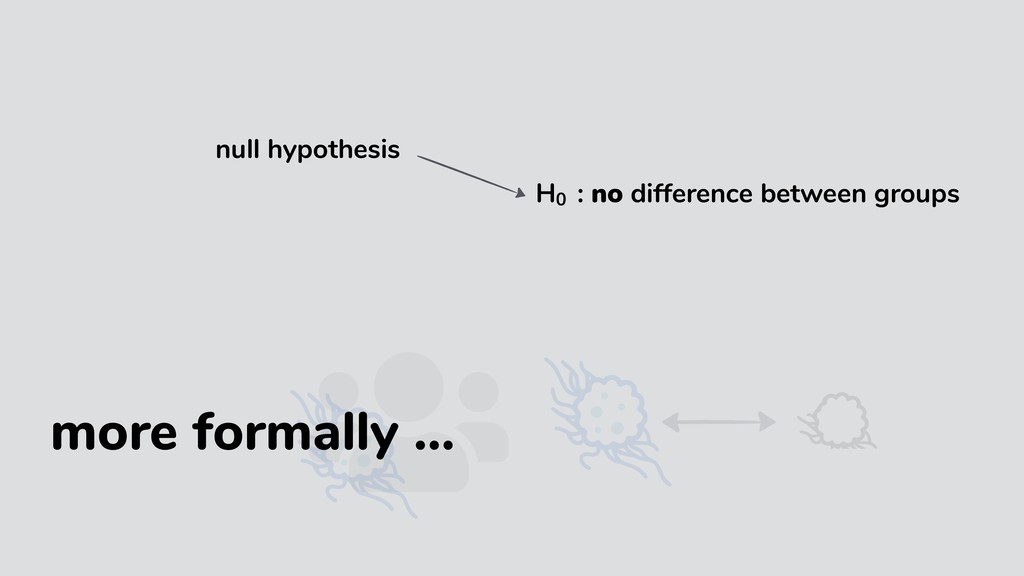
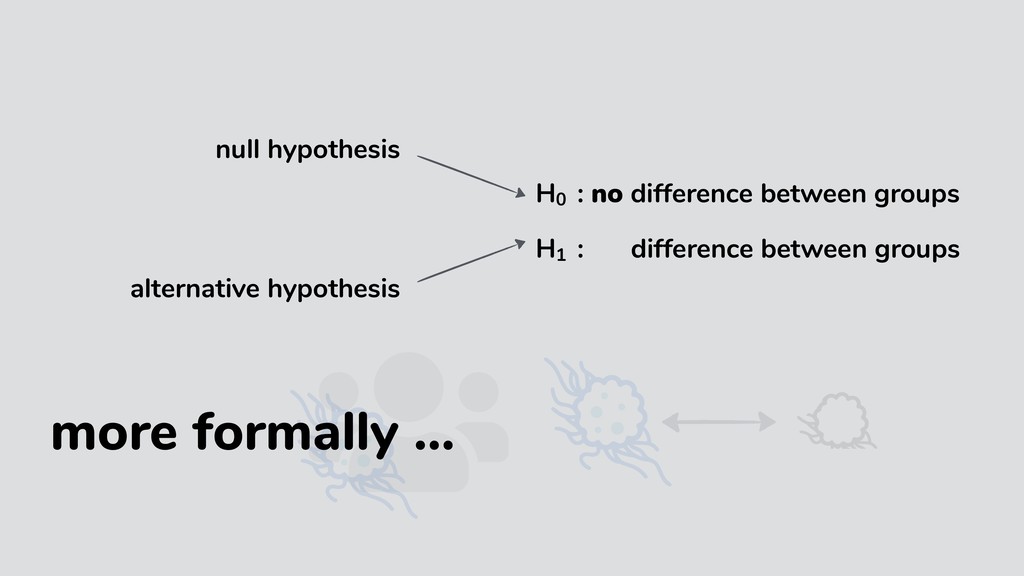
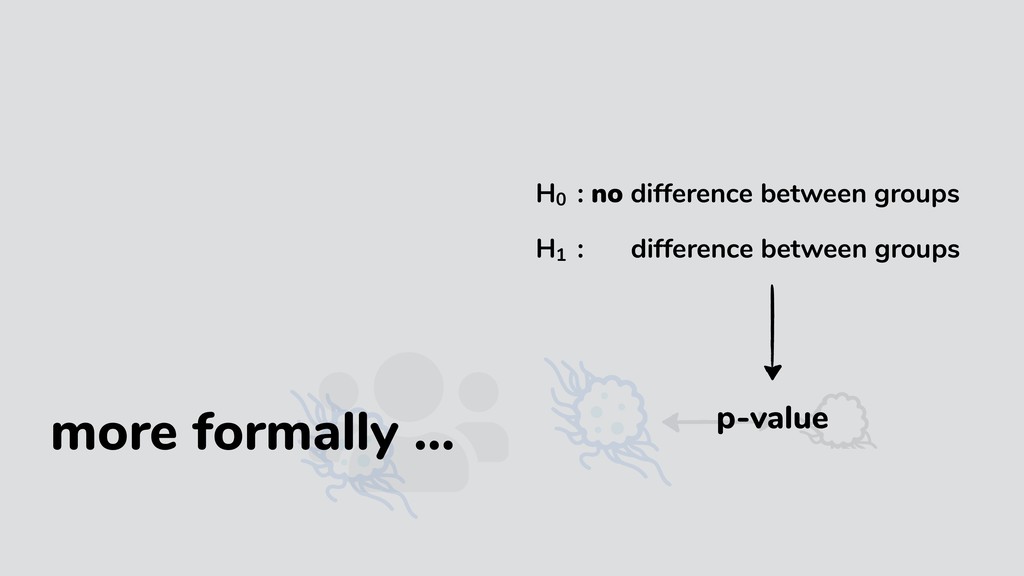
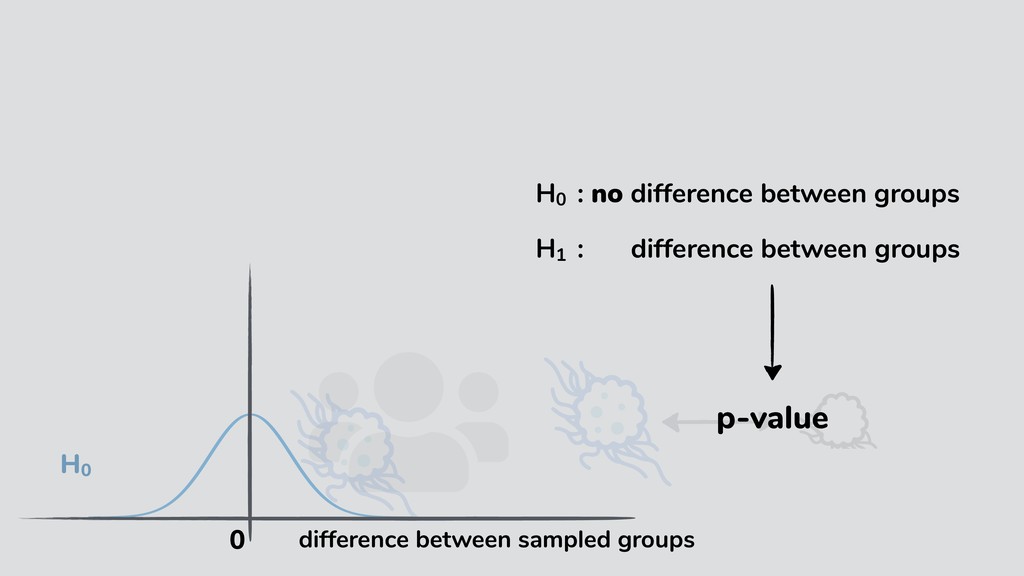
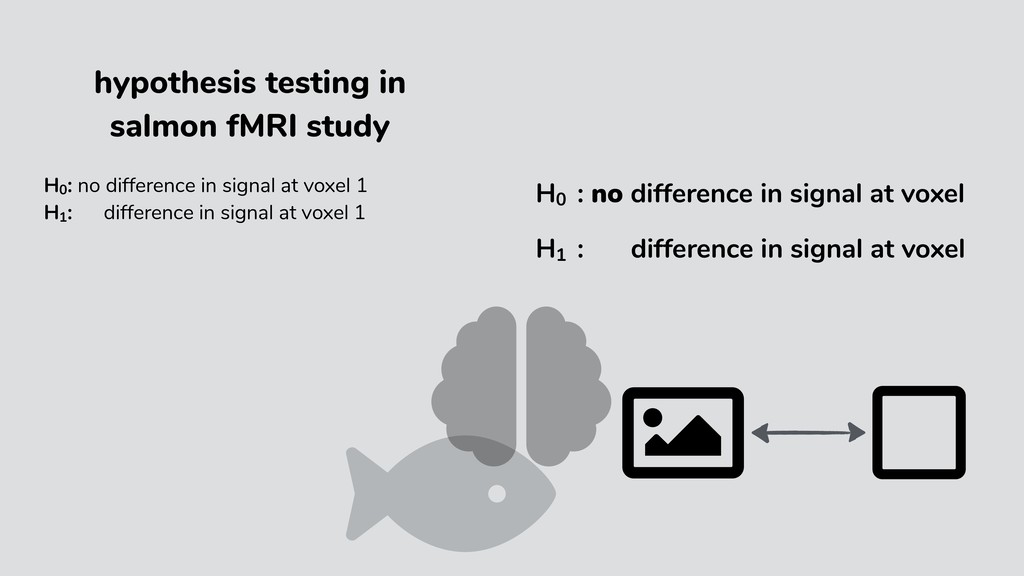
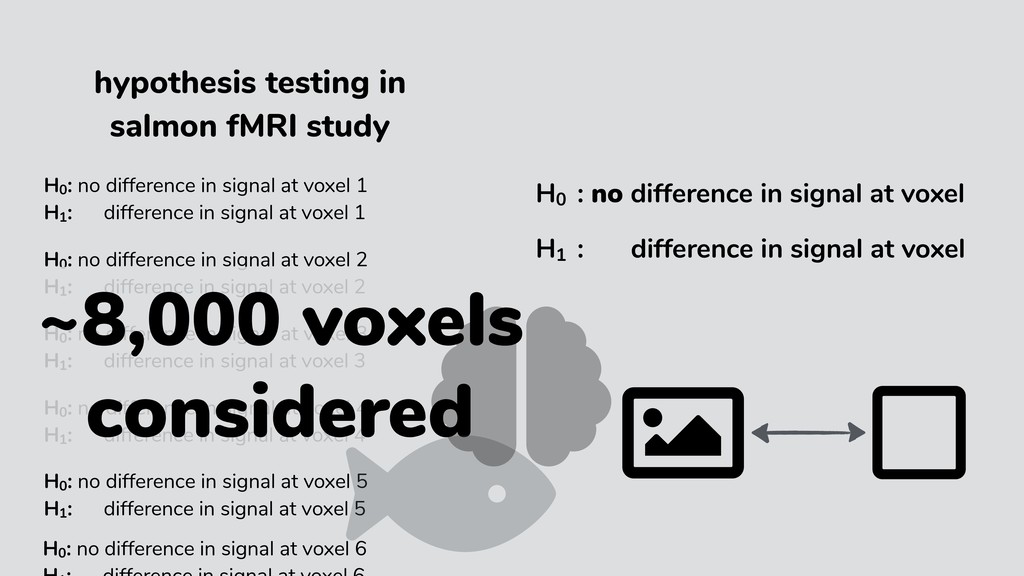
no difference in signal at voxel hypothesis testing in salmon fMRI study H0 : no difference in signal at voxel 1 H1 : difference in signal at voxel 1 H0 : no difference in signal at voxel 2 H1 : difference in signal at voxel 2 H0 : no difference in signal at voxel 3 H1 : difference in signal at voxel 3 H0 : no difference in signal at voxel 4 H1 : difference in signal at voxel 4 H0 : no difference in signal at voxel 5 H1 : difference in signal at voxel 5 H0 : no difference in signal at voxel 6
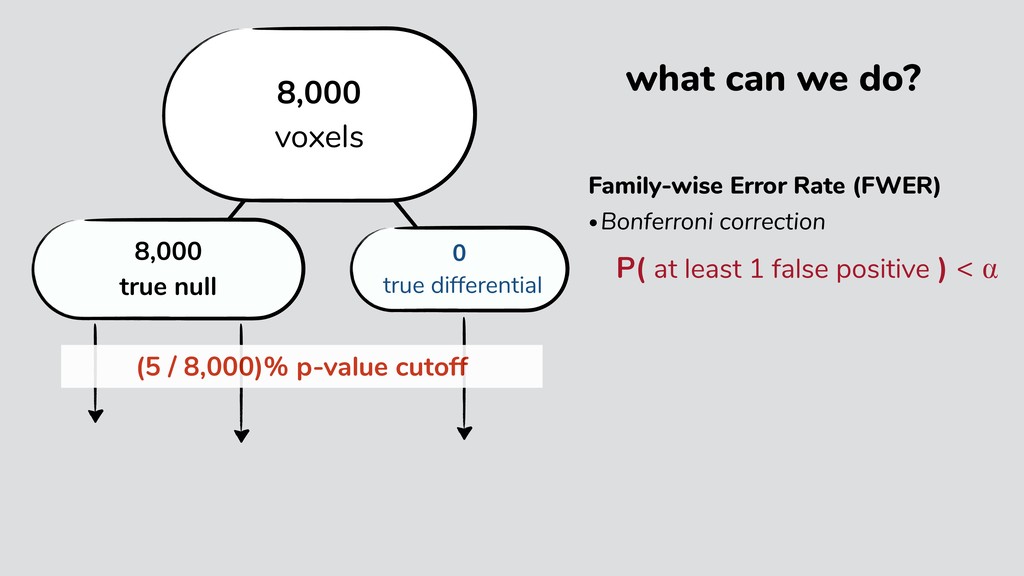
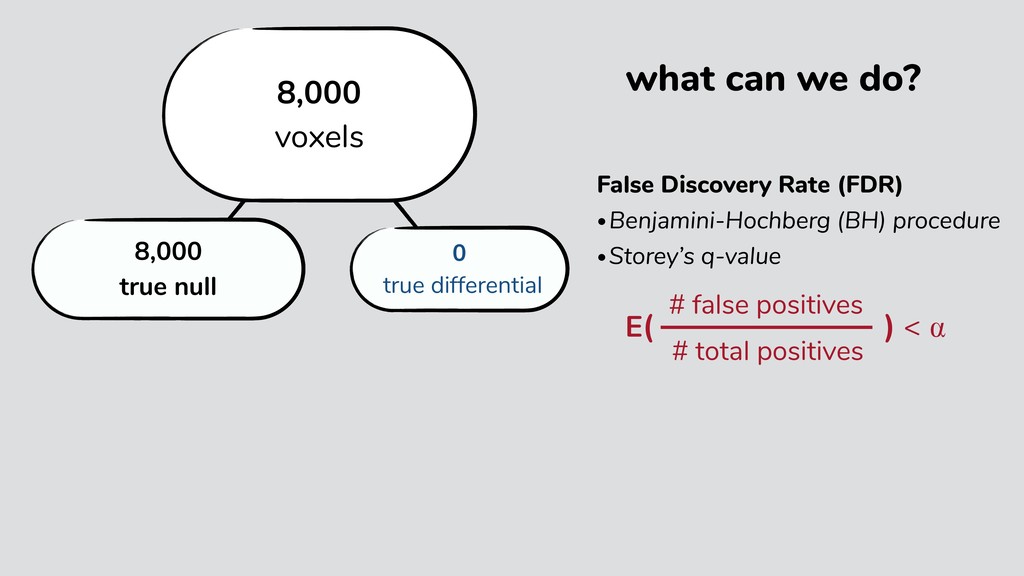
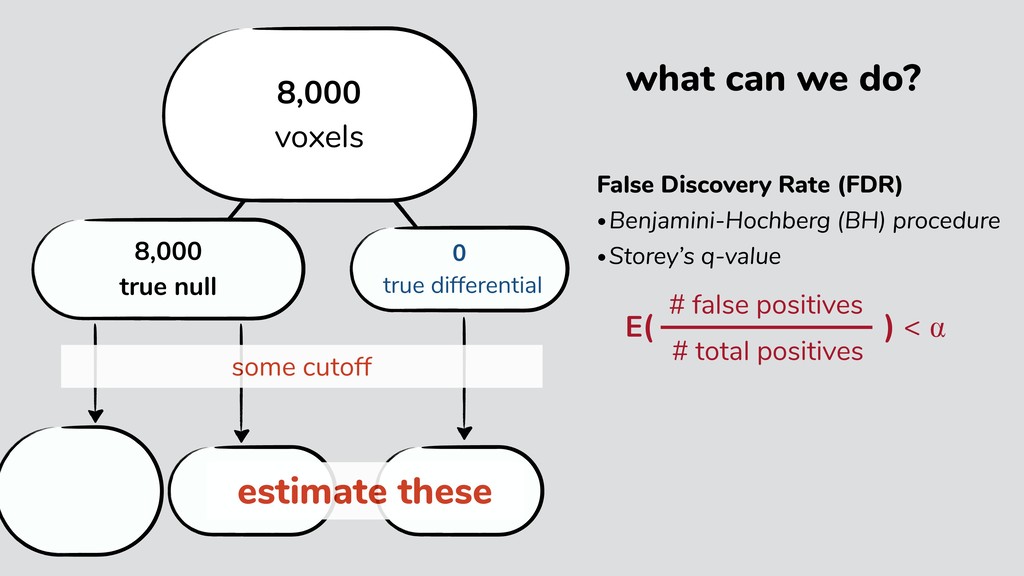
no difference in signal at voxel hypothesis testing in salmon fMRI study H0 : no difference in signal at voxel 1 H1 : difference in signal at voxel 1 H0 : no difference in signal at voxel 2 H1 : difference in signal at voxel 2 H0 : no difference in signal at voxel 3 H1 : difference in signal at voxel 3 H0 : no difference in signal at voxel 4 H1 : difference in signal at voxel 4 H0 : no difference in signal at voxel 5 H1 : difference in signal at voxel 5 H0 : no difference in signal at voxel 6 ~8,000 voxels considered
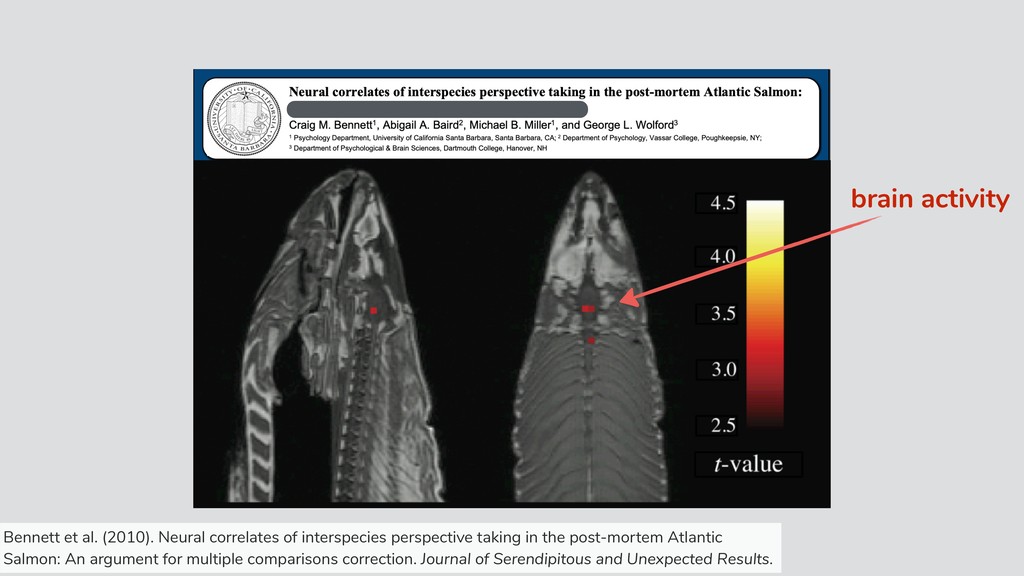
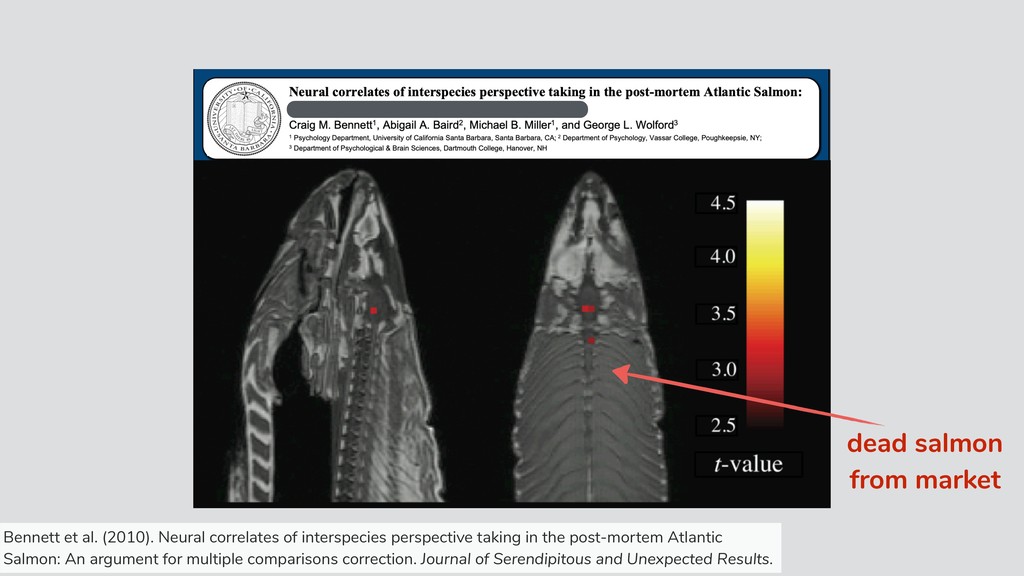
results if multiple comparisons are not controlled for …” Bennett et al. (2010). Neural correlates of interspecies perspective taking in the post-mortem Atlantic Salmon: An argument for multiple comparisons correction. Journal of Serendipitous and Unexpected Results.
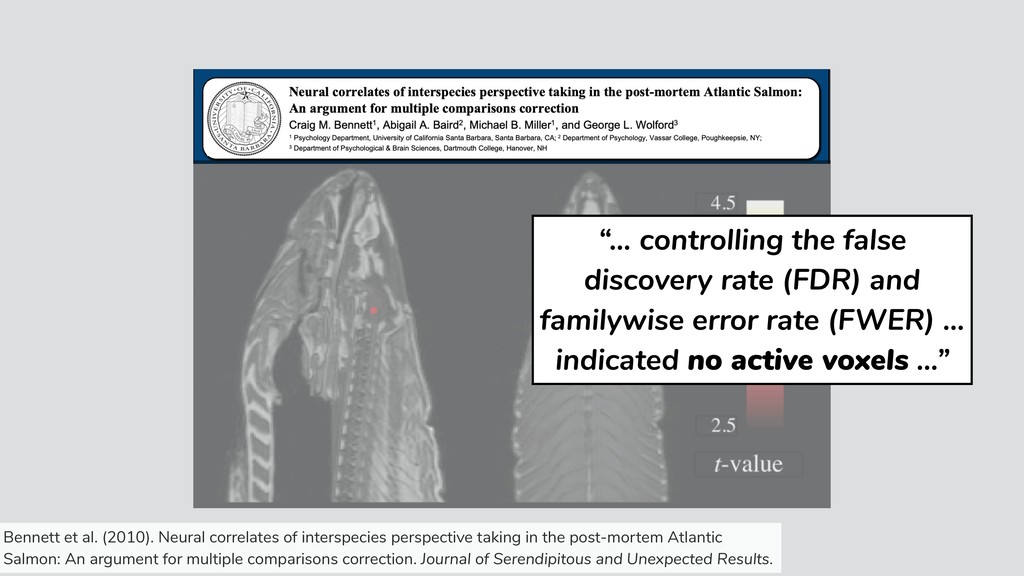
rate (FWER) … indicated no active voxels …” Bennett et al. (2010). Neural correlates of interspecies perspective taking in the post-mortem Atlantic Salmon: An argument for multiple comparisons correction. Journal of Serendipitous and Unexpected Results.
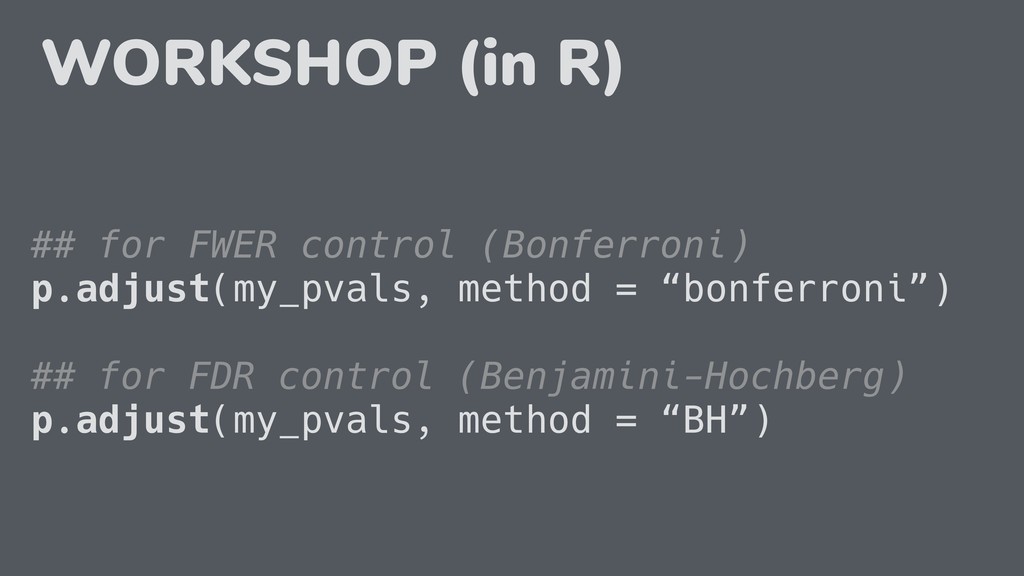
FWER control (Bonferroni) mt.multipletests(my_pvals, method = “bonferro ## for FDR control (Benjamini-Hochberg) mt.multipletests(my_pvals, method = “fdr_bh”) WORKSHOP (in Python)
in biomedical research than in physics. But, to achieve this higher true positive rate, biomedical research has to tolerate a higher false positive rate.”
medicine, but rather one of its strengths. “As an embryonic discipline, digital medicine has the chance to inculcate among its practitioners a healthier set of attitudes towards replication.”