Upgrade to Pro — share decks privately, control downloads, hide ads and more …

Demystifying Web Map Servers

Demystifying Web Map Servers

Shivashis Padhi

October 13, 2019
Tweet

More Decks by Shivashis Padhi

Other Decks in Programming

Transcript

  1. Geographic Information System? Maps, how are they generated? Yes, but

    what is the need to separate maps and map-servers? plant99_ CC-BY-SA 4.0
  2. What this talk would be about? ➔ Basic Geography and

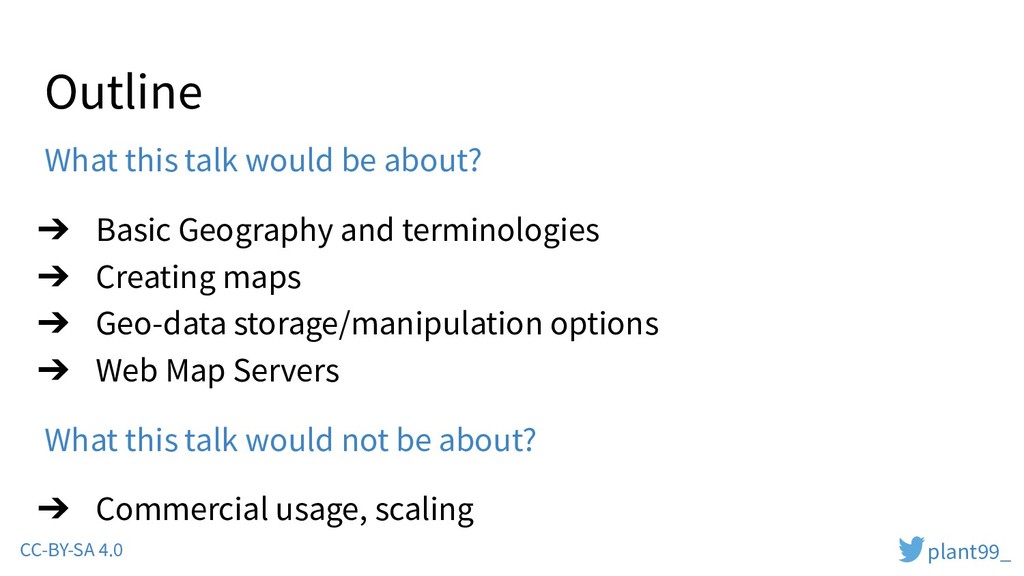
    terminologies ➔ Creating maps ➔ Geo-data storage/manipulation options ➔ Web Map Servers What this talk would not be about? ➔ Commercial usage, scaling Outline plant99_ CC-BY-SA 4.0
  3. ➔ Projections ➔ Coordinates Reference System ➔ Layers ➔ Type

    of view ➔ Legend plant99_ CC-BY-SA 4.0 Maps primer
  4. Coordinate Reference System ➔ Map projections try to portray the

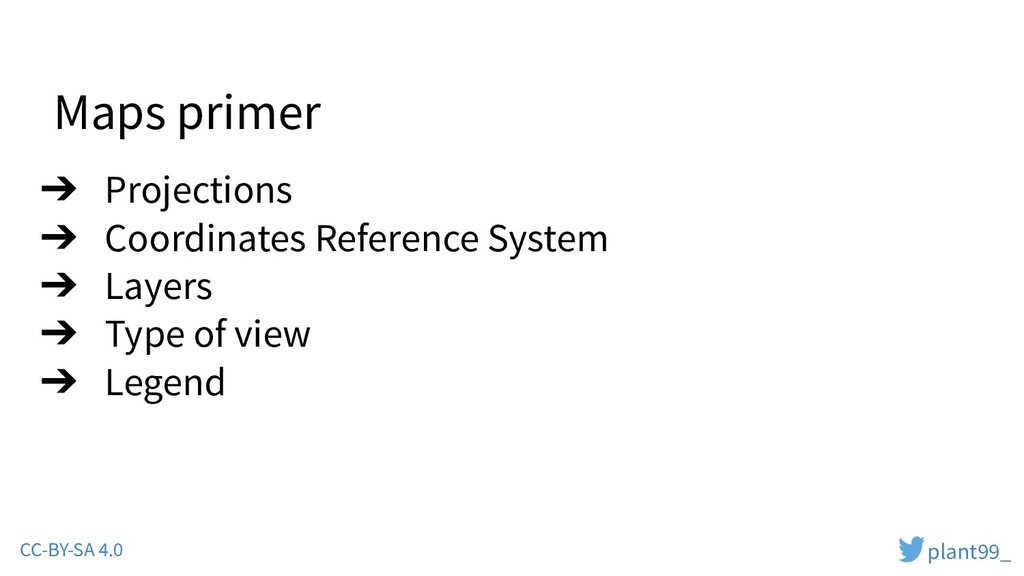
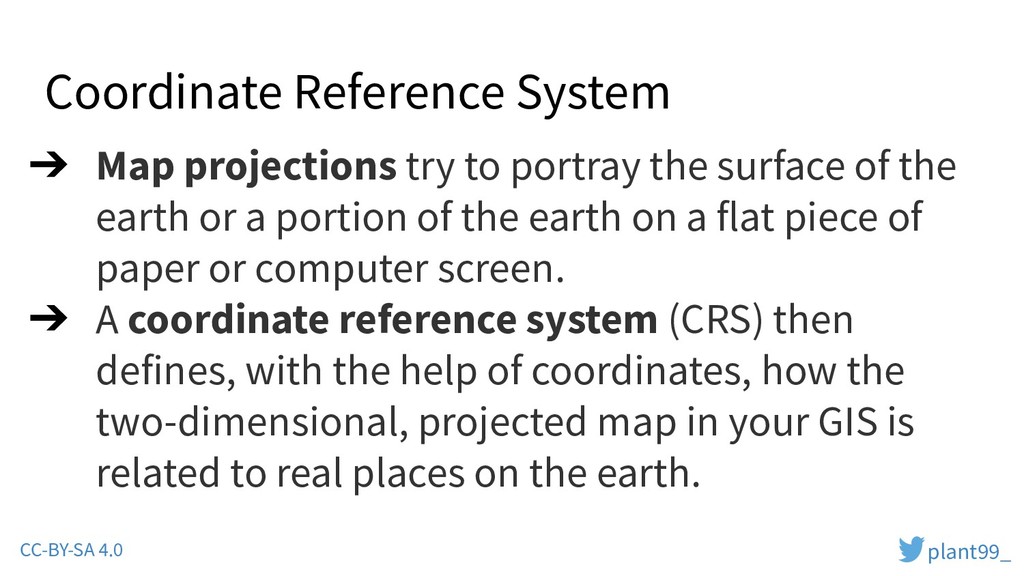
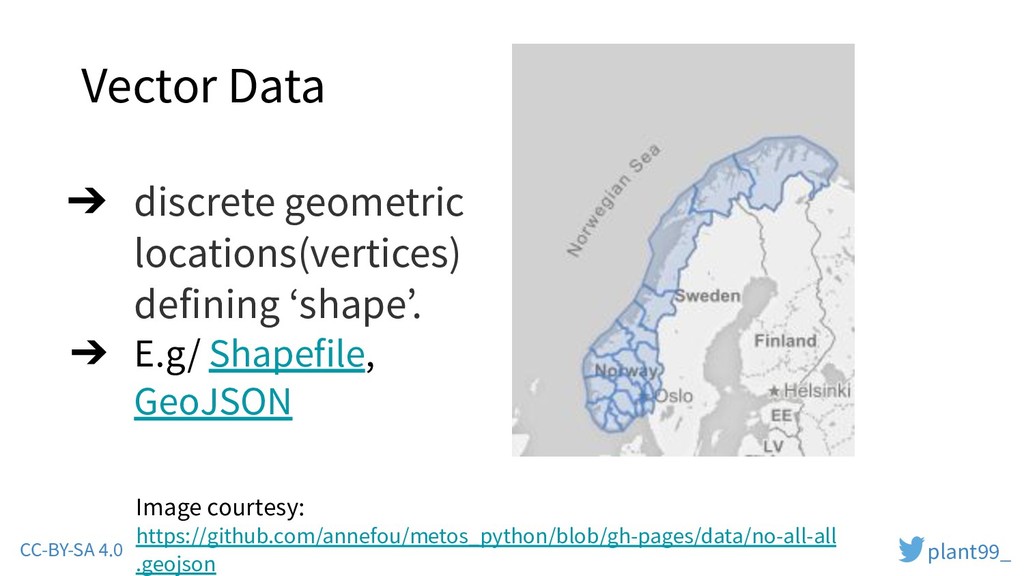
    surface of the earth or a portion of the earth on a flat piece of paper or computer screen. ➔ A coordinate reference system (CRS) then defines, with the help of coordinates, how the two-dimensional, projected map in your GIS is related to real places on the earth. plant99_ CC-BY-SA 4.0
  5. Layers ➔ Different types of data which can be represented

    by a map. ➔ Why do we need ‘layers’? To optimize queries. ➔ Example plant99_ CC-BY-SA 4.0
  6. Type of views ➔ Top view ➔ Side view How

    does this affect the image generation? Where are each used? plant99_ CC-BY-SA 4.0
  7. ➔ Gridded data ➔ Each grid represents a data-point ➔

    E.g/ NetCDF, GeoTIFF Raster Data Image courtesy: https://annefou.github.io/metos_python/fig/raster_concept.png plant99_ CC-BY-SA 4.0
  8. ➔ discrete geometric locations(vertices) defining ‘shape’. ➔ E.g/ Shapefile, GeoJSON

    Vector Data Image courtesy: https://github.com/annefou/metos_python/blob/gh-pages/data/no-all-all .geojson plant99_ CC-BY-SA 4.0
  9. ➔ 4D data in .csv ➔ A more efficient option

    ➔ Parallelization of data-access ➔ Identified by .nc extension NetCDF plant99_ CC-BY-SA 4.0
  10. ➔ https://bit.ly/merra2 ➔ ncview to visualize .nc files quickly ➔

    ncview on merra2 dataset, to visualize `t2m` variable. A small exercise plant99_ CC-BY-SA 4.0
  11. ➔ Projections, background ➔ Easy APIs drawoceans(), drawcontinents() ➔ drawlabels()

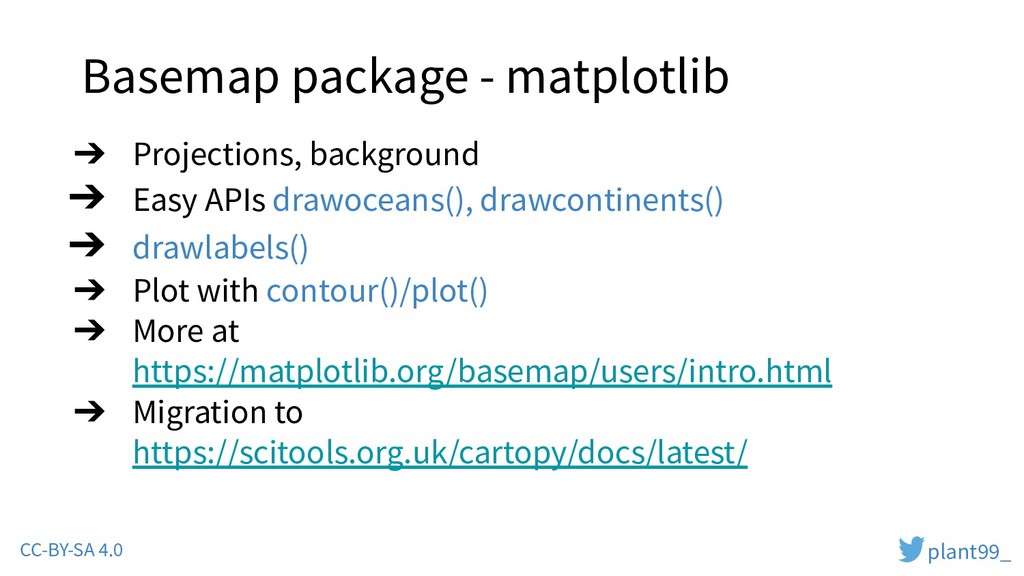
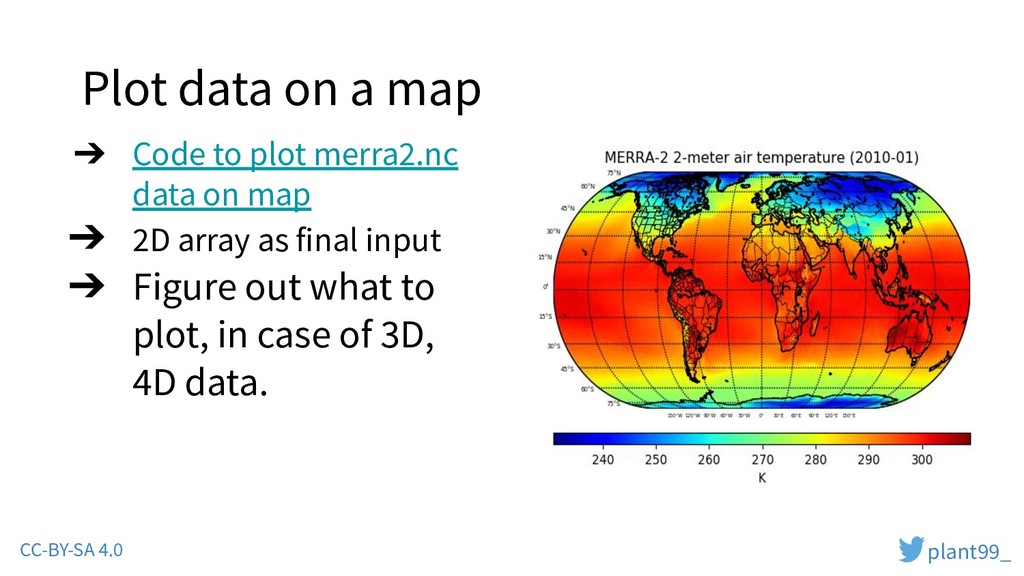
    ➔ Plot with contour()/plot() ➔ More at https://matplotlib.org/basemap/users/intro.html ➔ Migration to https://scitools.org.uk/cartopy/docs/latest/ Basemap package - matplotlib plant99_ CC-BY-SA 4.0
  12. ➔ Code to plot merra2.nc data on map ➔ 2D

    array as final input ➔ Figure out what to plot, in case of 3D, 4D data. Plot data on a map plant99_ CC-BY-SA 4.0
  13. ➔ Code to ecwmf data plot ➔ How is the

    map created? ➔ Raster/Vector basemap. Pressure dataset for a part of world map plant99_ CC-BY-SA 4.0
  14. GetMap ➔ What is GetMap request? ➔ Demo url for

    GetMap ➔ Code plant99_ CC-BY-SA 4.0
  15. GetVSecMap ➔ What is GetVSec request? ➔ Demo url for

    GetVSec ➔ Code plant99_ CC-BY-SA 4.0
  16. How does Python fare in this sector? ➔ Why should

    one need Python anyway to develop WMS? (extensible, easy) ➔ Why should you contribute? (give back) ➔ How can you contribute? ogc(standards), basemap, cartopy, mss, metpy, Open Street Map plant99_ CC-BY-SA 4.0