Upgrade to Pro — share decks privately, control downloads, hide ads and more …

Optimizing DESI for the Time-Domain Opportunities

Optimizing DESI for the Time-Domain Opportunities

Plenary talk at the July 2019 DESI Collaboration meeting, discussing ways in which the spectroscopic survey designed to measure dark energy could impact other astronomical fields.

Joshua Bloom

July 10, 2019
Tweet

More Decks by Joshua Bloom

Other Decks in Science

Transcript

  1. Josh Bloom Astronomy, LBNL @profjsb Optimizing DESI for the Time-Domain

    Opportunities DESI Collaboration Meeting 2019 Jul 10, Berkeley Data Driven Discovery Investigator
  2. Report from the Keck Time Domain Working Group (TDAWG) Authors:

    Joshua S. Bloom (UC Berkeley) Bob Goodrich (Keck/CARA) Aaron Barth (UC Irvine) Keith Matthews (California Institute of Technology) Henry Roe (Lowell Observatory) A Working Group Created by the Keck Science Steering Committee (SSC) 2006 (Report Delivered on 6 November 2006) LSST Whitepaper (2012) Science White Paper for LSST TOO Gravity-Wave and Particle Events: Targets Of Opportunity Authors: A. Becker (U Washington), J. S. Bloom (UC Berkeley), K. Cook (LLNL), Z. Ivezic (U Washington), Mansi Kasliwal (Carnegie), A. Mahabal (Caltech), Samaya Nissanke (Caltech), L. M. Walkowicz (Princeton) Contact Information for Lead Author/Authors: 601 Campbell Hall, Berkeley, CA 94720; [email protected]; +1-510-643-3839 1 Science Goals 1.1 Concise List of Main Science Goals 1. Discover and characterize the electromagnetic counterparts to gravitational wave and astro- physical neutrino events. This will require breaking prescribed cadences of LSST at least a few times a year (perhaps up to a few times a month) for several hours over the course of 1–3 days. 2. Given that this Target of Opportunity Triggering & Cadencing channel should not impact LSST hardware, we think that opening up this channel for LSST should be seriously consid- ered. The total time commitment of LSST to such a strategy should be small (of order 1%) and should depend on the variety of GW/neutrino triggering facilities in existence at the time of the science commissioning. 1.2 Details of Main Science Goals The EM/gravity wave connection is an active area of theoretical pursuit and it is likely that in the next several years, the expected EM signatures from the panoply of events that gives rise to GW events will become more clear. However, at this stage, we feel it is important for LSST to build in the capability to 1) slew rapidly to a field with little to no prior notice and 2) build in a dynamic cadence capability – that could last intermittently for days or even weeks — for these high priority events. The total time commitment of LSST to such a strategy should be small (of order 1 - 3%) and should depend on the variety of GW/neutrino triggering facilities in existence at the time of the science commissioning. Aside from the scientific rationale for opening up these capabilities we see important programmatic reasons to do so. LSST is essential unique in connecting the GW universe to the EM universe. It could greatly enhance the returns of the NSF-funded LIGO. Given that this Target of Opportunity Triggering & Cadencing channel should not impact LSST hardware, we Keck Report (2006)
  3. • Era of Time-Domain Discovery & Bottlenecks • Scientific Motivation

    • Variable star science, Circumnuclear events, Unusual Supernovae, Multimessenger Astronomy • Implementation Thoughts Agenda
  4. 47 deg2 imager, 3750 deg2/hr 16 6k x 6x e2v

    CCDs >250 observation/field/yr Era of Variable Star & Transient Discovery & Alerts is Now ~1M alerts/nightly 1.3B light curves in the first year with 20+ obs r, g to 20.5 mag Zwicky Transient Facility (ZTF ) 8806 transient alerts 500k variables Holl+18 Bellm+18 Classif.: ALL SOS: Fig. 4: Sky source densities [count deg 2] in Galactic coordinates of th see Sect. 4.3) and SOS tables (right column, see Sect. 4.4). In the class by main type, as listed in parentheses. Galactic longitude increases to t Article number, page 14 of 22 ASAS-SN 4200 transients, 400k variables Jayasinghe+19 #/deg2 TESS 1B+ lightcurves to r~16 With 30 min cadence Gaia DR2
  5. Bottlenecked Follow-up Resources From SED Machine paper (P60, R~1000): Blagorodnova+18

    Develop or obtain access to a highly multiplexed, wide-field optical multi-object spectroscopic capability on an 8m-class telescope, preferably in the Southern Hemisphere. This high priority, high- demand capability is not currently available to the broad US community…Possibilities include implementing a new wide-field, massively multiplexed optical spectrograph…open access to the PFS instrument on the Subaru telescope in order to propose and execute new large surveys; and alternatively, joining an international effort to implement a wide-field spectroscopic survey telescope Najita+16 (1610.01661)
  6. Bottlenecked Follow-up Resources From SED Machine paper (P60, R~1000): Blagorodnova+18

    Develop or obtain access to a highly multiplexed, wide-field optical multi-object spectroscopic capability on an 8m-class telescope, preferably in the Southern Hemisphere. This high priority, high- demand capability is not currently available to the broad US community…Possibilities include implementing a new wide-field, massively multiplexed optical spectrograph…open access to the PFS instrument on the Subaru telescope in order to propose and execute new large surveys; and alternatively, joining an international effort to implement a wide-field spectroscopic survey telescope Najita+16 (1610.01661)
  7. LBV Stars AGN Stars Asteroids Rotation Eclipse Microlensing Cataclysmic Eruptive

    Pulsation Secular Novae (DAV) H-WDs Variability Tree Extrinsic Intrinsic N Supernovae SN Symbiotic ZAND Dwarf novae UG Eclipse Asteroid occultation Eclipsing binary Planetary transits EA EB EW Rotation ZZ Ceti PG 1159 Solar-like (PG1716+426 / Betsy) long period sdB V1093 Her (W Vir / BL Her) Type II Ceph. δ Cepheids RR Lyrae Credit: Eyer et al. (2018) Adapted from: Eyer & Mowlavi (2008) δ Scuti γ Doradus Slowly pulsating B stars α Cygni β Cephei λ Eri SX Phoenicis SXPHE Hot OB Supergiants ACYG BCEP SPB SPBe GDOR DST PMS δ Scuti roAp Miras Irregulars Semi- regulars M SR L Small ampl. red var. (DO,V GW Vir) He/C/O-WDs PV Tel He star Be stars RCB GCAS FU UV Ceti Binary red giants α2 Canum Venaticorum MS (B8-A7) with strong B fields SX Arietis MS (B0-A7) with strong B fields Red dwarfs (K-M stars) ACV BY Dra ELL FKCOM Single red giants WR SXA β Per / α Vir RS CVn PMS S Dor Eclipse (DBV) He-WDs V777 Her (EC14026) short period sdB V361 Hya RV Tau Photom. Period DY Per BLAP LPV OSARG SARV CEP RR RV CW
  8. 50k variables, 810 with known labels (timeseries, colors) Also, Amstrong+16

    (10k K2 stars) Richards+11, 12 Variable Star Science
  9. Probabilistic Classification Of Variable Stars Shivvers,JSB,Richards MNRAS,2014 106 “DEB” candidates

    12 new mass-radii 15 “RCB/DYP”
 candidates 8 new discoveries Triple # of Galactic DYPer Stars Miller, Richards, JSB,..ApJ 2012 Local Distance Ladder: Spectroscopic Metallicity measurements for RRL, Cepheids, Mira…
  10. Turning Imagers into Spectrographs Data: MMT/Hectospec spectra of 5825 variables

    in SDSS Stripe 82 ~80 dimensional regression with Random Forest Time variability + colors → fundamental stellar parameters Miller, JSB, Richards,..ApJ 2015 temperature surface gravity Metallicity
  11. exhibit the behavior shown in Figure 8.7 (case B). We

    will call these “on-axis” afterglows with unknown parentage. Figure 8.6: Discovery space for cosmic transients. Peak absolute r-band magnitude is plotted vs. decay timescale LSST Science Book (via Rau 2008) The Transient Sky
  12. Spectra 6 weeks after discovery was sufficient for TDE identification

    Circumnuclear Events Tidal Disruption Event
 - Massive BH swallows star - temporary brightening - study disk/jet interaction, BH growth, BH mass+spin galaxies (Stone & van Velzen 2016). The TDE rate can also be an important probe of MBH demographics, with a potential dependence on the mass of the MBH (Wang & Merritt 2004), the presence of a binary MBH (Chen et al. 2011) or recoiling coalesced MBH (Stone & Loeb 2011), and the MBH occupation fraction (Stone & Metzger 2016). With a statistically significant sample of TDEs from ZTF, we can measure the rates of TDEs as a function of black hole mass and host galaxy type, and look for these theoretically predicted dependencies. 7.2. Active Galactic Nuclei Variability is a ubiquitous property of unobscured active galactic nuclei. In particular, Sesar et al. (2007) showed that >90% of type 1 quasars showed optical variability above a level of 2% in the 290 deg2 SDSS Stripe 82 survey on a timescale of several years. Scaling up to the area of the ZTF public survey, which has a comparable depth of r∼20.5 mag, we should detect ∼half a million variable AGN. About 1 in Figure 6. Cumulative discovery rate of tidal disruption events as a function of time, with the onset of new surveys labeled. Note the dramatic predicted jump in discovery rate from ∼2 TDEs per year, to ∼10 bright, early TDE discoveries by ZTF with SEDM spectroscopic classification per year. (A color version of this figure is available in the online journal.) Publications of the Astronomical Society of the Pacific, 131:078001 (23pp), 2019 July Graham et al. Graham+19
  13. Circumnuclear Events Binary Black Hole Candidates
 - Study BH growth,

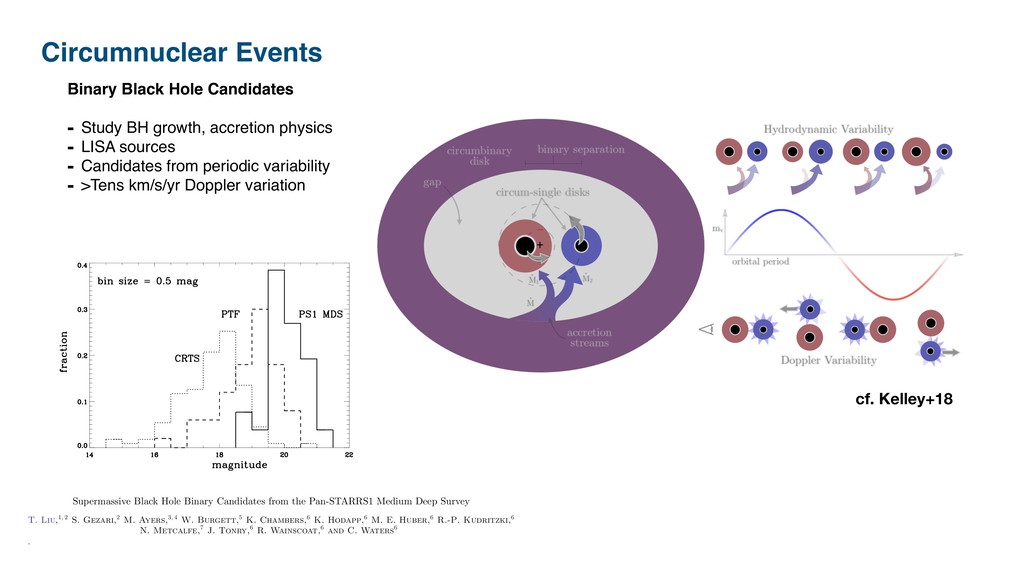
    accretion physics - LISA sources - Candidates from periodic variability - >Tens km/s/yr Doppler variation Draft version June 21, 2019 Typeset using L A TEX twocolumn style in AASTeX62 Supermassive Black Hole Binary Candidates from the Pan-STARRS1 Medium Deep Survey T. Liu,1, 2 S. Gezari,2 M. Ayers,3, 4 W. Burgett,5 K. Chambers,6 K. Hodapp,6 M. E. Huber,6 R.-P. Kudritzki,6 N. Metcalfe,7 J. Tonry,6 R. Wainscoat,6 and C. Waters6 1Center for Gravitation, Cosmology and Astrophysics, Department of Physics, University of Wisconsin-Milwaukee, P.O. Box 413, Milwaukee, WI 53201, USA 2Department of Astronomy, University of Maryland, College Park, MD 20742, USA dates from PS1 MDS 15 of n k i- i- g- M- 6 O r nt x- l. t of n al r- Figure 8. Dotted histogram: V band magnitude distribu- tion of the candidates from CRTS (G15). Dashed histogram: the R magnitude distribution of the candidates from PTF (C16). Solid histogram: the g P1 magnitude distribution of candidates from this work. cf. Kelley+18 MBH Binaries as Variable AGN 7 Figure 5. Schematic representation of the binary, disk, and accretion geometries assumed in our models; informed from the results of hydrodynamic simulations (e.g. Farris et al. 2014). Left: between the binary and the circumbinary disk is a ‘gap’ with a radius roughly twice the binary separation. Around each MBH is a ‘circum-single’ disk, fed by time-variable accretion streams extending from the circumbinary disk. Because the secondary MBH is farther from the center-of-mass, and closer to the circumbinary disk, it tends to receive a disproportionate share of the accretion rate. Right: the hydrodynamic and Doppler mechanisms for producing photometric variability are depicted on the top and bottom respectively. The circumbinary disk orbits at longer periods than the circum-single disks that it feeds, causing periodic variations in accretion rate, and thus luminosity. For observers oriented near the orbital plane, Doppler boosting of the faster moving, and typically more luminous, secondary MBH can also produce brightness variations. binary we calculate the SNR based on the un-boosted flux, F⌫ , and determine the minimum observable inclination imin , such that the variability is observable. The fraction of solid- angles at which the system is observable, which, for ran- domly oriented inclinations is cos(imin ), then contributes lin- almost always in the GW-dominated regime in which the hardening timescale—the duration a given binary spends at that separation—decreases rapidly with decreasing orbital period. Thus, if a given variational timescale is probing bi- naries at shorter periods, the number of observable systems
  14. Unusual Supernovae Table 2 A New Classification System for Supernovae

    Old Class Physical Peak Peak Expansion New Class Origina R-band Velocity [mag] [km s 1] SN Ia WD -18.67 11000 SNIa(2) SN Ia (91T-like) WD? -19.15 11000 SNIa2 m-0.5 SN Ia (91bg-like) WD -17.55 11000 SNIa2 m+1.1 SN Ia (Super-C) WD? ⇠-19.5 8000 SNIa2 m-1 v0 SN Ia (02cx-like) WD? -17 < 8000 SNIa2 m+1.6 SN Ia-CSM WD? -20.2 SNIa2i0 m-1. SN Ib Massive star -17.9 10000 SNCC0.9 SN 2005bf Massive star? -18 7000 SNCC1 v0.7 Ca-rich Ib ? -16 10000 SN??1 m+2 SN Ibn Massive star -19 SNCC2 i1 SN Ibn/IInb Massive star SNCC2 i0.5 SN Ic Massive star -18.3 10000 SNCC2 SN Ic-BL Massive star -19 19000 SNCC2 m-0.7 Long-rising Ic Massive star SNCC2 r35 Late interacting Icc Massive star? SNCC2 i0 SN 2010mbd Massive star? SNCC2 d0 Rapid declinerse Massive star? SNCC2 d2.5 Regular SNe II Massive star 17.1 10000 SNCC0 SNe II-P Massive star SNCC0 d0 SNe II-L Massive star SNCC0 d0.3 Long-rising IIf Massive star SNCC0 r80 Faint IIg Massive star -15 5000 SNCC0 m+1. SN IIb Massive star -18 8500 SNCC0.5 SN IIn Massive star -18.8 SNCC0 i0 SLSN-I Massive star? -21.5 SNCC2 m-3.2 SLSN-II Massive star? SNCC0 m-2 SLSN-IIn Massive star? SNCC0 i0 m- a Values with “?” attempt to reflect the consensus in the literature, even thoug Gal-Yam 16 Huge industry studying the end-states of massive stars in a growing potpourri of SN events 10 Avishay Gal-Yam luminosity suggest their volumetric rate is low, probably below 1% of the SN Ia rate. 3500 4000 4500 5000 5500 6000 6500 7000 7500 8000 8500 Rest wavelength [Ang] 0 0.5 1 1.5 2 2.5 Scaled F 6 [erg/s/cm2/Ang] #10-12 SN 2011fe, peak-2d SN 2009dc, peak+2.5d SN 2005hk, -2d PTF11kx, -1d C II S II Si II C II S II Si II C II Ca II (CSM) H, (CSM) Fig. 5 Peak spectra of peculiar SNe Ia compared to the normal SN 2011fe (top). The “Super- Chandra” event SN 2009dc (from Taubenberger et al. 2011) shows the hallmark Si II and SII lines, Light curves and colors alone do not tell the story: need spectrosco py
  15. Unusual Supernovae ral evolution of the effective s, and photospheric

    velocity. nd velocity declined very rap- d recession of the photosphere elope. We estimated the mass g the scaling relation that ties heric velocity and rise time ,2 (8). This scaling assumes The luminosity and short rise time of SN 2002bj translate to 0.15 to 0.25 M⊙ of 56Ni when using Arnett's law (8, 9), if the light curve is solely powered by radioactive 56Ni and its decay product 56Co. Under this same assumption, the rapid decline we measured requires a sharp drop of the gamma-ray deposition efficiency of an order of magnitude in less than 3 weeks. ly fast light curve. Recently, a mechanism has been proposed (10) by which binary white dwarfs of the AM CVn class may undergo a thermo- nuclear explosion of the He accreted on the pri- mary star. Such a scenario will produce roughly 10% of the luminosity of a SN Ia, for about 10% of the typical time; hence, these objects were dubbed W.IaW SNe. These SNe are expected to be faint (between −15 and −18 mag at peak in the V band) and rapidly evolving (1 to 6 days of rise time, with the brighter objects usually rising more slow- ly). The decline was not explicitly discussed by Bildsten et al. (10), but the low ejected mass implies a rapid decline. The short time scales of these events may allow the detection of the short- lived radioactive nuclei 52Fe or 48Cr, in addition to the standard 56Ni that drives SN Ia light curves. 48Cr decays to 48V within a day and then to 48Ti in a week. The decay of these nuclei may (par- tially) power the optical light curve. The rate of .Ia events is predicted to be roughly a few percent of the SN Ia rate per unit of local volume. The spectral signature was not predicted, but some properties seem to result naturally in that scenario. Because this is a thermonuclear He detonation on a white dwarf, we do not expect any H, but He does seem reasonable, as well as intermediate-mass elements that either survive the convective burning phase and detonation (11) or are produced in the explosion. Although other recent SNe have been pro- posed to be related to He detonations on a white dwarf [SN 2005E (12) and perhaps also SN 2008ha (12–14)], these events have more mas- sive ejecta (0.2 to 0.3 M ) and much slower on of f SN SNe (gray band o the imum quite for a , yet typi- I (21) WfastW (22) ed as Ne Ia; ) is a fast reed. icant- these. 005cf (24), and SN 2008D (25) are standard representatives of type IIn, Ia, and Ib SNe, are shown for reference. The dashed red line shows the slowest rise slope of SN the data. on July 9, 201 http://science.sciencemag.org/ Downloaded from SN .Ia: thermonuclear explosion of He accreted on an AM CVn (Bilsten+07) Th some scenar detona any H interm the co (11) or Alt posed dwarf 2008h sive e light c predic explain much Th predict than ex ejecta 48Cr or of mas scales. spectru daught the spe display light c ionized second is con detecti Bil will ha one of the fastest SNe Ia; and SN 2008ha (14) is a faint, peculiar, and fast SN of debated breed. SN 2002bj is significant- ly faster than any of these. SN 1998S (23), SN 2005cf (24), and SN 2008D (25) are standard representatives of type IIn, Ia, and Ib SNe, respectfully; they are shown for reference. The dashed red line shows the slowest rise slope of SN 2002bj allowed by the data. Fig. 2. The unique spectral features of SN 2002bj (shown in red; continuum removed) are difficult to identify a priori. Fl , flux per unit of wavelength. This spectrum, taken 7 March 2002 (7 days after discovery), is reminiscent of SNe Ia, with the notable exception of the prominent He and C lines, never seen before in such SNe. We show (in black) a typical SN Ia spectrum near maximum light (SN 2001bf), redshifted by 10,000 km s−1 in order to match ejecta velocities. The spectral features identified in black are present in both objects, and the ones in red are seen only in SN 2002bj. Poznanski+10
  16. Potential DESI Contributions 1. Rapid dissemination of all existing DESI

    galaxy redshifts within the GW localization volume 2. Spectroscopic redshift of top (e.g., by K-band mag) galaxies with only photo-z (~hours - day)
  17. Potential DESI Contributions coverage. After our night 1 observations were

    completed, a new LALInference skymap moved the highest probability re- gion away from the part of the sky observed on night 1. As Figure 1 shows, the new skymap instead favored a bulge located at RA⇠ 6 h, Dec⇠ 35 deg (The LIGO Scientific Collaboration and the Virgo Collaboration 2019c). This high probability region of sky had already set at CTIO when the merger occurred on night 1, so we could not use DECam to acquire early follow-up data. The refined skymap constrained the highest proba- bility region (90% and 50% integrated probability being included in 1166 deg2 and 31 deg2 respectively) to be vis- ible for ⇠ 1.6 h at the beginning on the Chilean night on 2019-05-10 UT. The template coverage in the sky area with top 50% priority was ⇠ 90% complete in all filters from Dark Energy Survey (DES) Data Release 1 (DR1) pre-imaging. On the second night (hereafter “night 2”) we commenced observations on 2019-05-10 22:51:57 and finished on 2019-05-11 00:31:40, when the field set. We performed blocks of observations in z-r-g bands using 40 s exposures in each band. We observed 75.04 deg2 of e↵ective sky area in z and r, covering 65% of the skymap integrated probability in each band. We then observed 64.32 deg2 in g band, covering 62.3% of the skymap integrated probability. Other viable observing options for night 2 (that we did not select) included: i) observing a larger sky area in 2 filters with the same exposure time; ii) increasing the exposure time for at least 1 filter; iii) performing a sec- No more DECam observations were planned on the following night(s). The total integrated probability of the LALInference skymap that we covered on the 2 ob- serving nights with DECam is 67%. The observations we report here are also summarized in Table 1. New Reference Subtraction DG19llhk DG19lcnl DG19bexl Figure 3. New image, reference image, and image sub- traction of some transient candidates discovered with our image-subtraction pipeline (Goldstein et al. 2019). The side of each squared “postage stamp” measures 13.2 arcsec. The complete poll of candidates selected by our program during Name IAU Name RA Dec Date (UT) Filter Magnitude (AB) DG19lcnl AT2019fln 87.146903 35.994405 2019-05-10 23:11:24 z 19.862 ± 0.039 2019-05-10 23:46:41 r 19.511 ± 0.057 2019-05-11 00:22:47 g 20.218 ± 0.028 DG19ukvo AT2019flo 89.211464 33.442484 2019-05-10 22:51:56 z > 20.51 2019-05-10 23:27:08 r 21.338 ± 0.049 2019-05-11 00:03:27 g 20.354 ± 0.121 DG19nanl AT2019flp 87.311394 35.955868 2019-05-10 23:11:24 z 20.872 ± 0.113 2019-05-10 23:46:41 r 19.987 ± 0.018 2019-05-11 00:22:47 g 20.400 ± 0.031 DG19qcso AT2019flq 88.208667 30.381390 2019-05-10 23:01:23 z > 20.92 2019-05-10 23:36:39 r 22.284 ± 0.135 2019-05-11 00:12:56 g 21.545 ± 0.087 DG19zaxn AT2019flr 92.307956 35.149825 2019-05-10 23:00:07 z > 20.71 2019-05-10 23:35:20 r 20.835 ± 0.034 2019-05-11 00:11:37 g 20.791 ± 0.039 DG19etsk AT2019fls 89.100929 30.473990 2019-05-10 23:04:59 z 20.900 ± 0.126 2019-05-10 23:40:18 r 20.712 ± 0.036 2019-05-11 00:16:32 g 20.581 ± 0.037 DG19yhhm AT2019flt 91.937008 30.824789 2019-05-10 23:16:54 z > 21.64 2019-05-10 23:53:56 r 20.080 ± 0.019 2019-05-11 00:29:10 g 20.117 ± 0.023 DG19llhk AT2019flu 90.863155 32.385517 2019-05-10 23:02:36 z 20.826 ± 0.097 2019-05-10 23:37:52 r 21.019 ± 0.041 2019-05-11 00:14:08 g > 21.88 DG19fqqk AT2019flv 92.851450 36.517324 2019-05-10 23:08:56 z 20.425 ± 0.054 2019-05-10 23:44:17 r 20.413 ± 0.024 2019-05-11 00:20:26 g > 22.12 1. Rapid dissemination of all existing DESI galaxy redshifts within the GW localization volume 2. Spectroscopic redshift of top (e.g., by K-band mag) galaxies with only photo-z (~hours - day) Andreoni, Goldstein … JSB +19 (1906.00806) 3. Spectroscopy of the dozens of candidates we find can now find automatically (ZTF + DES) (~minutes to hours)
  18. LETTERS NATURE ASTRONOMY 60 55 50 45 Hydro-jet GW VLBI

    + LC GW + VLBI + LC 40 Distance (Mpc) 35 30 25 0 θ obs (°) 10 20 30 40 50 60 70 Fig. 1 | Distance and observing angle constraints to GW170817. Black 0.10 GW + VLBI + LC (PLJ) GW Planck SH0ES 0.08 0.06 0.04 0.02 0.00 50 60 70 80 H 0 (km s–1 Mpc–1) 90 100 110 120 p(H 0 ) LETTERS NATURE ASTRONOMY 60 55 50 45 Hydro-jet GW VLBI + LC GW + VLBI + LC 40 Distance (Mpc) 35 30 25 0 θ obs (°) 10 20 30 40 50 60 70 Fig. 1 | Distance and observing angle constraints to GW170817. Black dashed curves running from top to bottom depict the constraint of 0.10 GW + VLBI + LC (PLJ) GW Planck SH0ES 0.08 0.06 0.04 0.02 0.00 50 60 70 80 H 0 (km s–1 Mpc–1) 90 100 110 120 p(H 0 ) Fig. 2 | Posterior distributions for H 0 . The results of the GW-only analysis The Hubble constant (H 0 ) measures the current expansion rate of the Universe, and plays a fundamental role in cosmology. Tremendous effort has been dedicated over the past decades to measure H 0 (refs.1–10). Gravitational wave (GW) sources accompanied by electromagnetic (EM) counterparts offer an independent standard siren measurement of H 0 (refs.11–13), as demonstrated following the discovery of the neutron star merger, GW170817 (refs. 14–16). This measurement does not assume a cosmological model and is independent of a cosmic distance ladder. The first joint analysis of the GW signal from GW170817 and its EM localization led to a measurement of H = 74 km s Mpc 0 8 +16 1 1 − − − (median and symmetric 68% cred- ible interval)13. In this analysis, the degeneracy in the GW signal between the source distance and the observing angle dominated the H 0 measurement uncertainty. Recently, tight constraints on the observing angle using high angular reso- lution imaging of the radio counterpart of GW170817 have been obtained17. Here, we report an improved measurement H = 70 . 3 km s Mpc 0 5.0 +5.3 1 1 − − − by using these new radio observa- tions, combined with the previous GW and EM data. We esti- mate that 15 more GW170817-like events, having radio images and light curve data, as compared with 50–100GW events without such data18,19, will potentially resolve the tension between the Planck and Cepheid–supernova measurements. Radio images have recently been obtained of a narrowly colli- mated jet associated with GW170817 by using very-long-baseline interferometry (VLBI), comprising the Very Long Baseline Array, the Karl G. Jansky Very Large Array and the Robert C. Byrd Green constraints on the observing angle by combining the two (that is, the angle between our line-of-sight and the jet axis) independently of the GW analysis17. These constraints have some dependence on the exact jet modelling. To estimate this dependence and to see its effect in the measurement of H 0 , we constrain the angle using sev- eral different and complementary methods: analytic modelling, full hydrodynamic numerical simulations and semi-analytic calcula- tions of synthetic jet models. The analytic modelling and numerical simulations are described in ref. 17. The authors derive first rough analytic con- straints on the observing angle, θ obs , and then carry out a set of full hydrodynamical simulations of jets to find what geometries can fit the entire dataset. Their conclusion is that only models with θ θ . < < . < < ∘ ∘ ( ) ( ) ( ) 0 25 0 5 rad 15 29 d d obs 41 Mpc obs 41 Mpc can fit the entire dataset (see Methods for the details of the hydro-jet modelling assisted by the analytic modelling). The viewing angles outside this range are inconsistent with the measured offset by at least 2σ. To obtain the probability distribution of θ obs and d, and to estimate the effect of the jet modelling on the observational con- straints on the observing angle, we ran Markov chain Monte Carlo (MCMC) simulations with two synthetic jet models: a power-law jet (PLJ) model and a Gaussian jet (GJ) model (see Methods). While the hydrodynamics of the jet is not fully taken into account in the synthetic models, unlike the numerical simulations, they allow us to scan the entire parameter space. Therefore, this analysis and the estimate based on the hydrodynamic simulations17 are com- plementary. Figure 1 shows the posterior distribution for d A Hubble constant measurement from superluminal motion of the jet in GW170817 K. Hotokezaka 1*, E. Nakar 2*, O. Gottlieb2, S. Nissanke3,4,5, K. Masuda 1, G. Hallinan 6, K. P. Mooley 6,7 and A. T. Deller8,9
  19. Implementation: A Modest Proposal Build and test TD capabilities in

    time for SV - JIT fiber (re)allocation, prioritized by sky location, weather, …
 - rapid reduction pipeline, data staging for non-DESI access Run a Public Fiber Allocation Committee (PFAC) bi-yearly - non-ToO accepted projects submit prioritized lists - Bright time/bad weather projects - ToOs - Multiplex! Allow Director’s Discretionary Time for rare cases Establish clear data access policies for the public at large
  20. Fiber Allocation Process cost Depth: Scientific Impact DESI Core Science

    DESI Core Science + Time Domain DESIderata: Optimization Considerations - How many core science fibers can be allocated to TD? At what cost to the dark energy metrics? - How many “sky” fibers? - Is there actually long-term ultility (e.g. calibration) in getting spectra of non-QSOs/ LRGs? - What TD science across the US portfolio will be enabled/ enhanced/transformed by X% fiber allocation? - Does TD allocation increase the funding landscape for the out years (e.g., NSF)?
  21. Parting Thoughts ‣From ZTF alone: At least dozens of transients/variables

    in any given DESI FOV without spectroscopy ‣Loss of ε-percent fibers for core DESI science can be a big gain for the larger community. ‣Broad view of optimization will hopefully show this to be more win- win than zero-sum
 ‣ Advocate for a Fiber Allocation Committee for public observations
  22. Josh Bloom Astronomy, LBNL @profjsb Optimizing DESI for the Time-Domain

    Opportunities DESI Collaboration Meeting 2019 Jul 10, Berkeley Data Driven Discovery Investigator Thanks!