Upgrade to Pro — share decks privately, control downloads, hide ads and more …

Get Instrumented: How Prometheus Can Unify Your Metrics by Hynek Schlawack

Pycon ZA
October 07, 2016

Get Instrumented: How Prometheus Can Unify Your Metrics by Hynek Schlawack

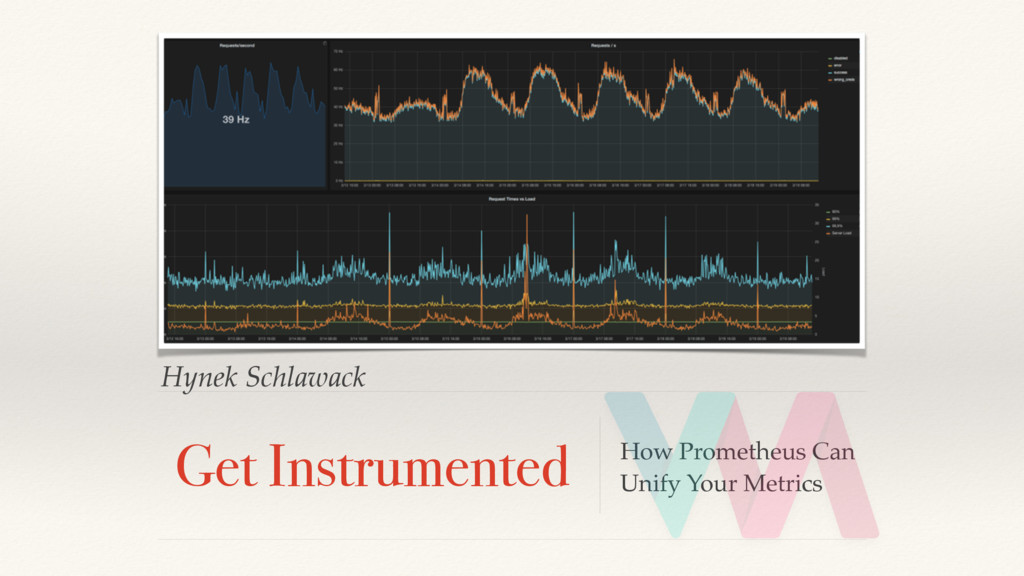
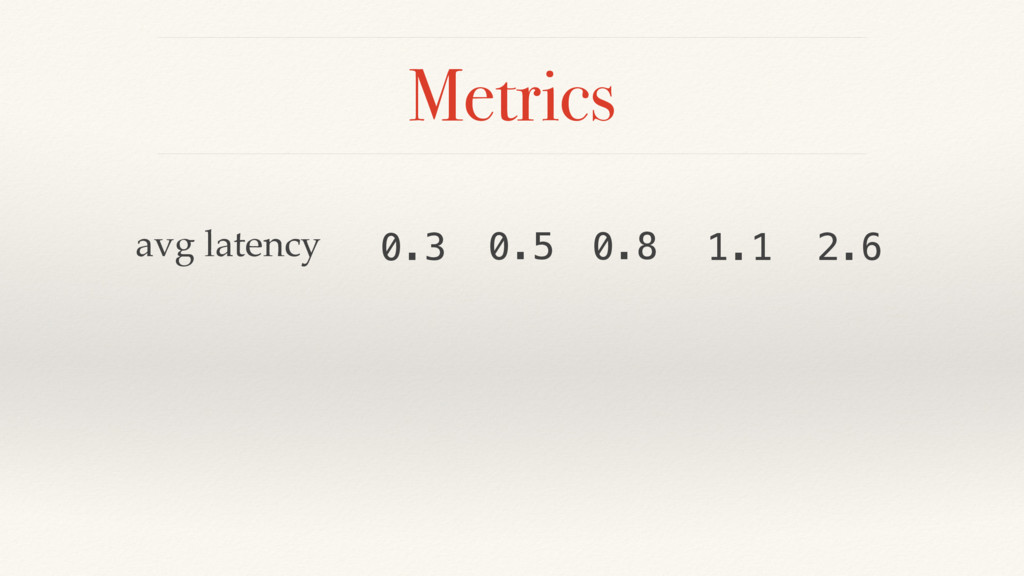
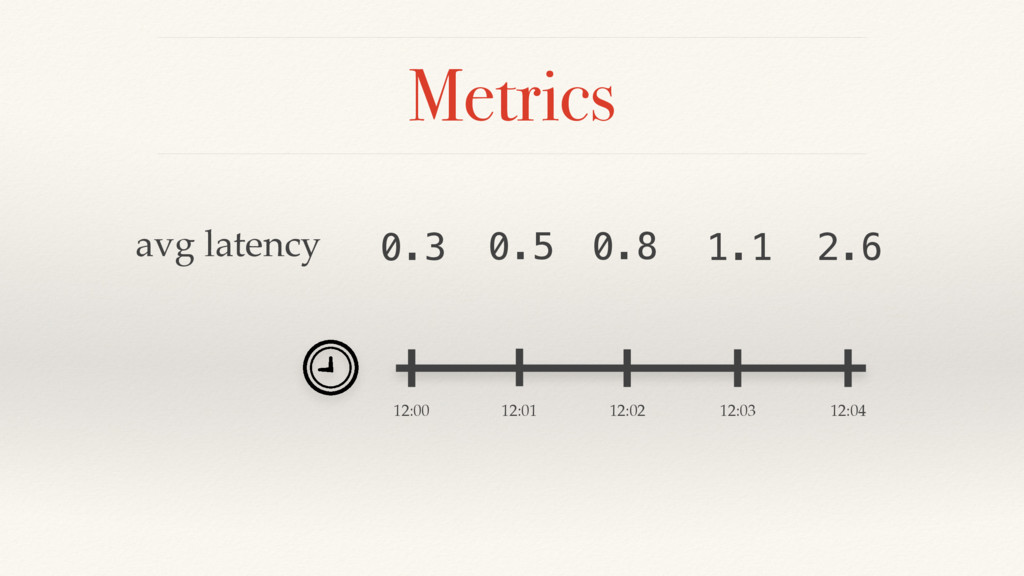
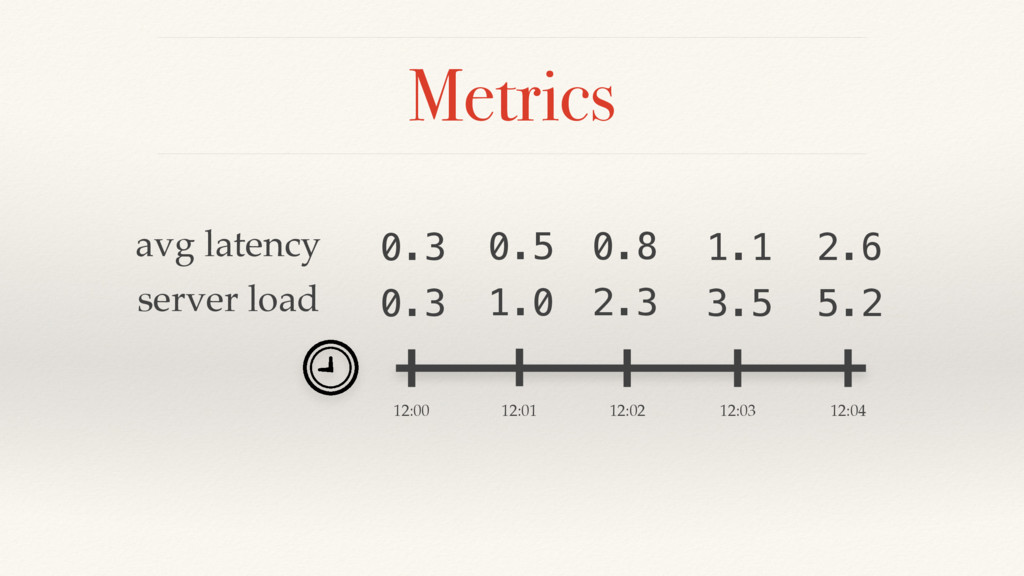
Metrics are highly superior to logging in regards of understanding the past, presence, and future of your applications and systems. They are cheap to gather (just increment a number!) but setting up a metrics system to collect and store them is a major task.

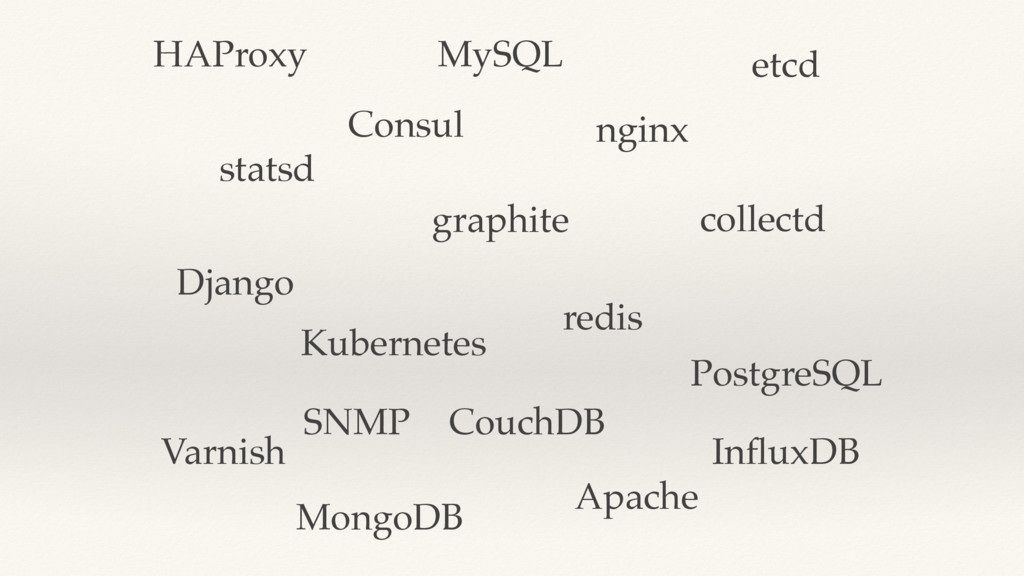
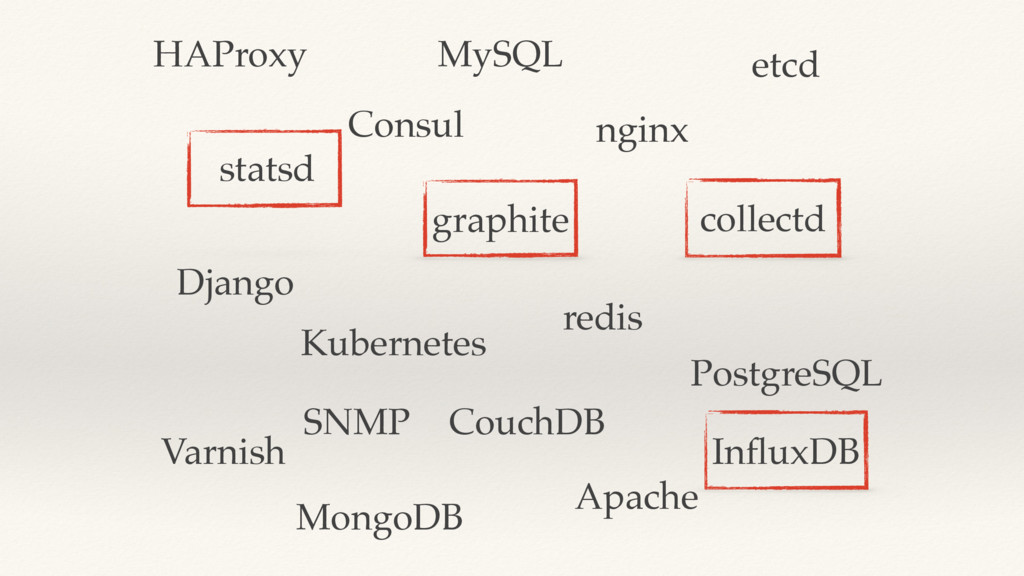
You may have heard of statsd, Riemann, Graphite, InfluxDB, or OpenTSB. They all look promising but on a closer look it’s apparent that some of those solutions are straight-out flawed and others are hard to integrate with each other or even to get up and running.

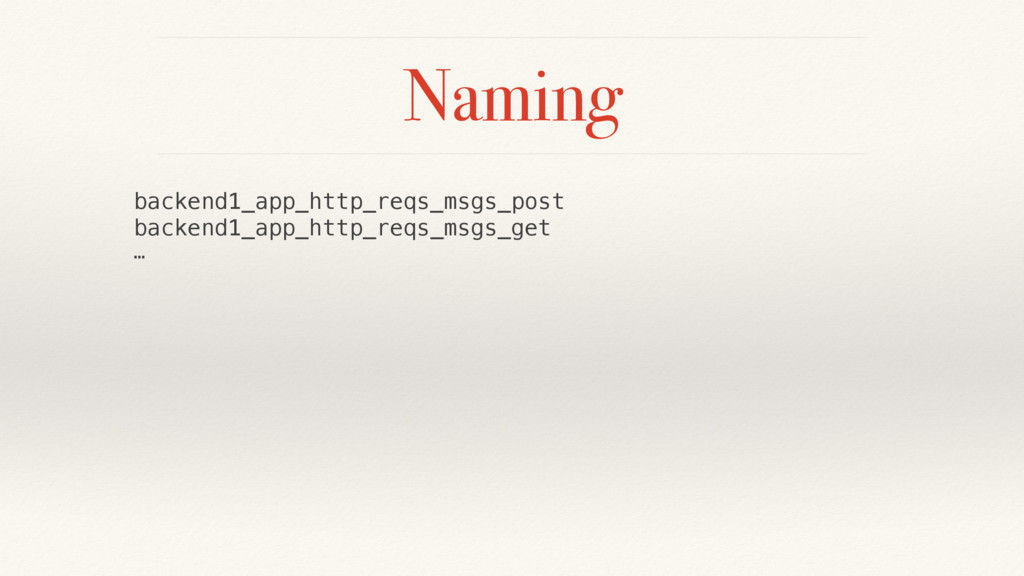
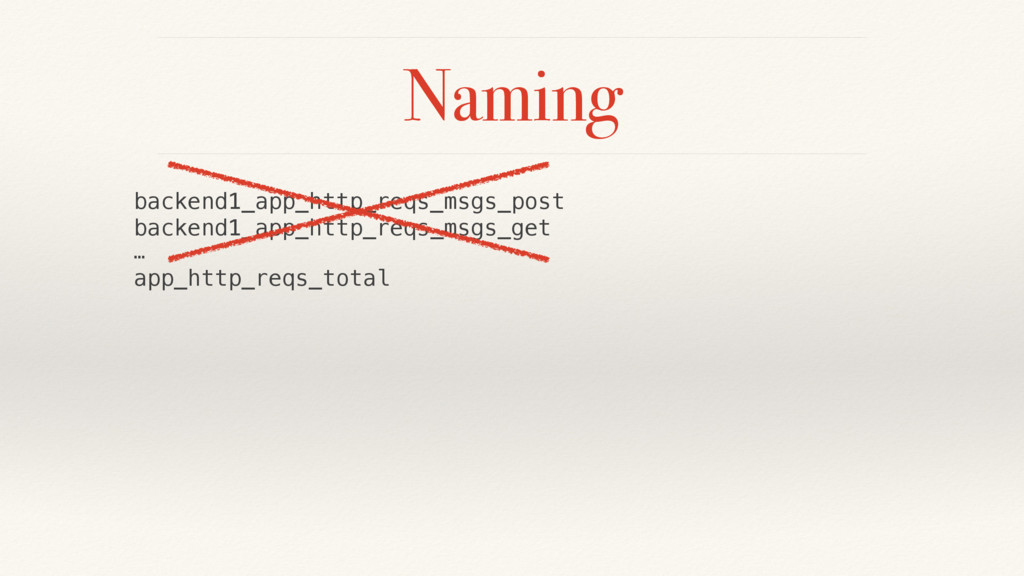
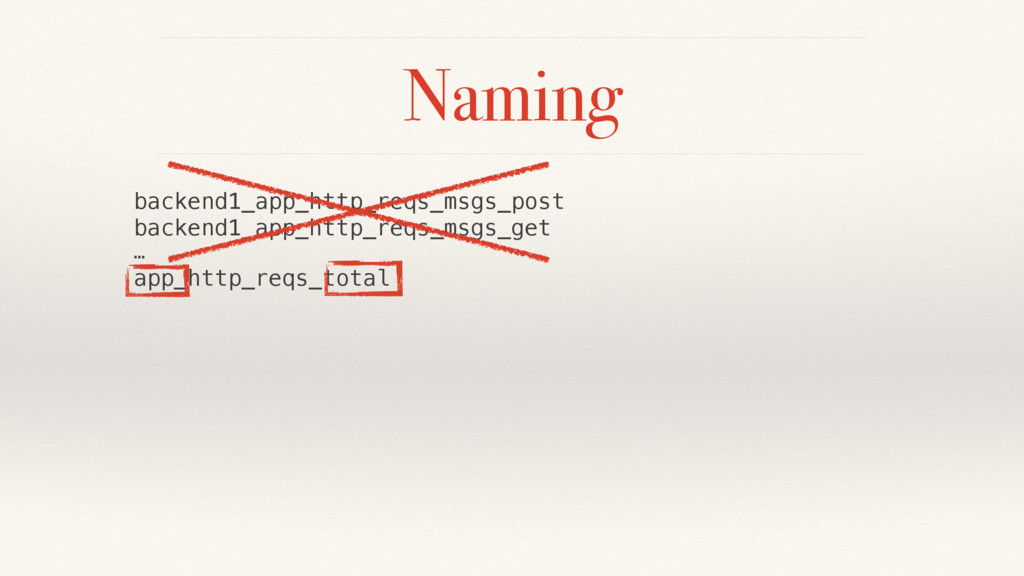
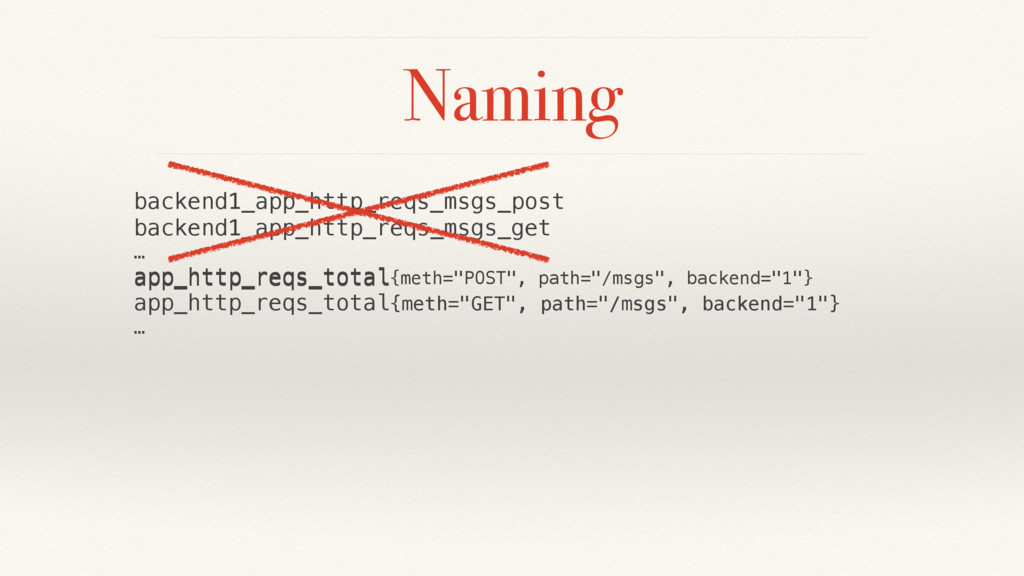
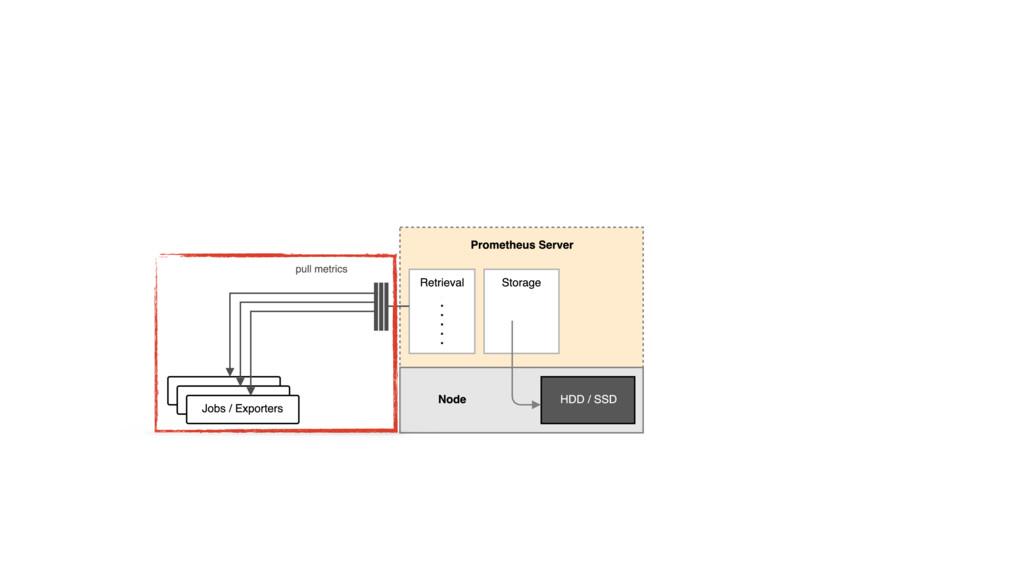
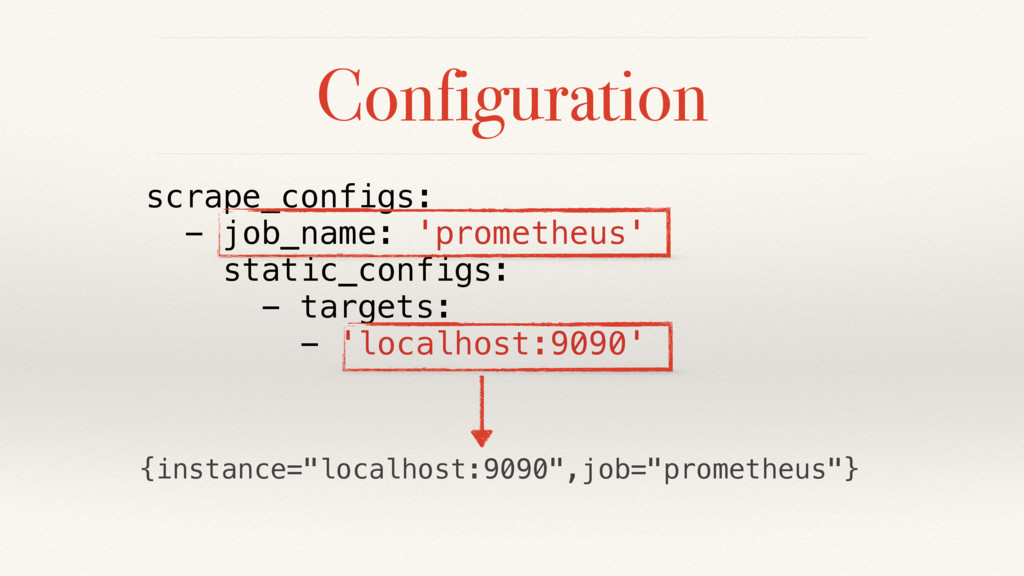
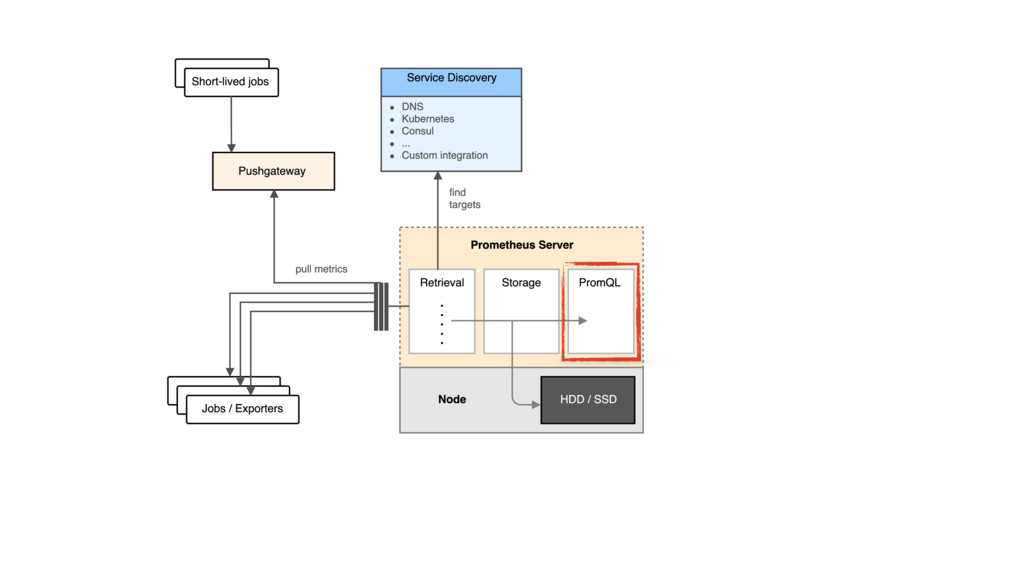
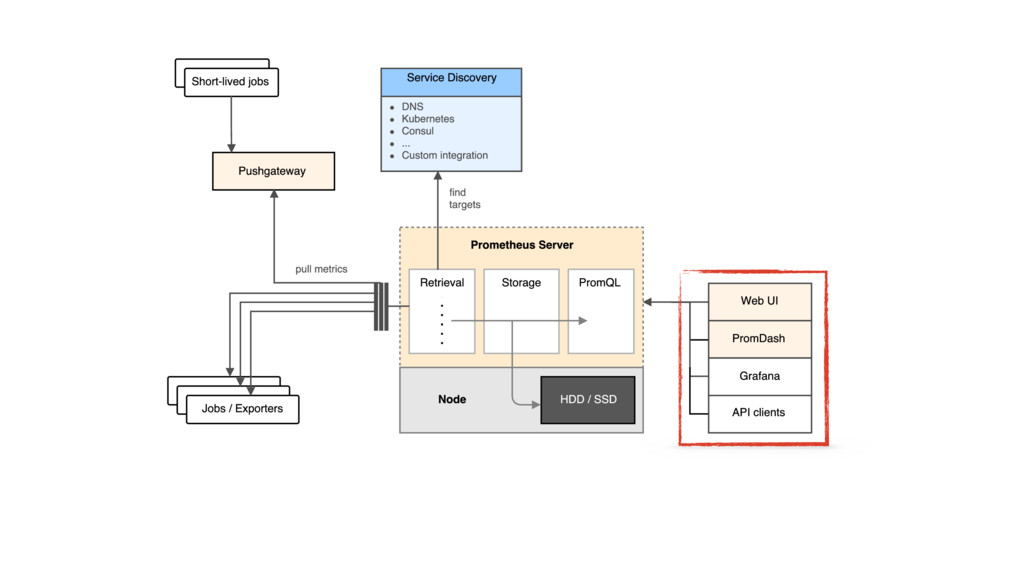
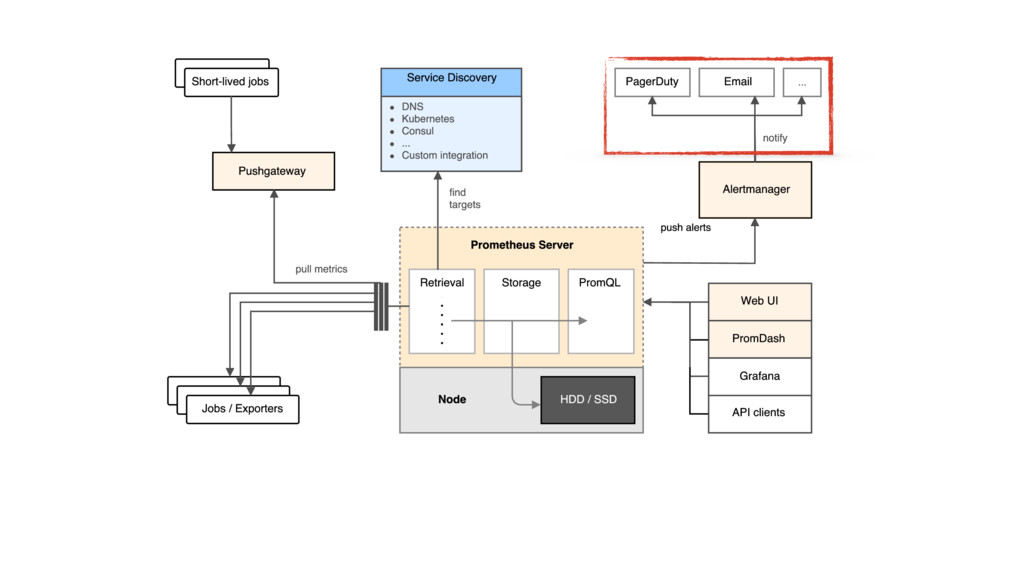
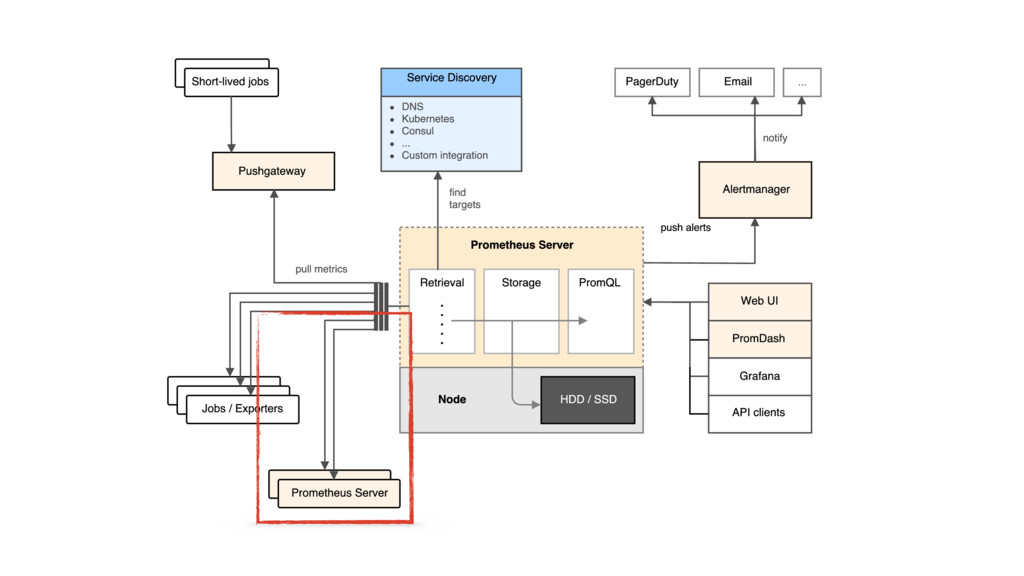
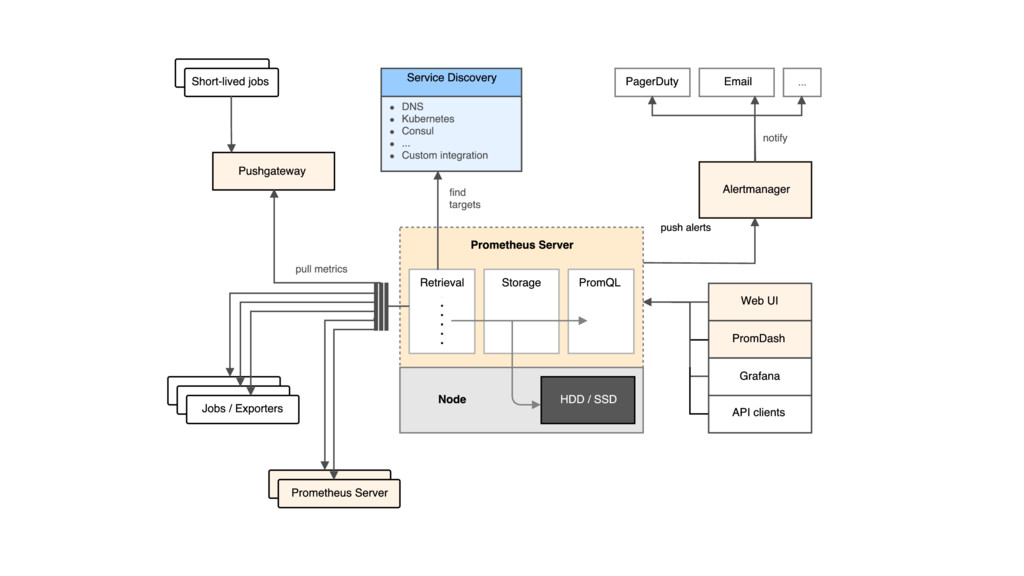
Then came Prometheus and gave us independence of UDP, no complex math in your application, multi-dimensional data by adding labels to values (no more server names in your metric names!), baked in monitoring capabilities, integration with many common systems, and official clients for all major programming languages. In short: a unified way to gather, process, and present metrics.

This talk will:

explain why you want to collect metrics,
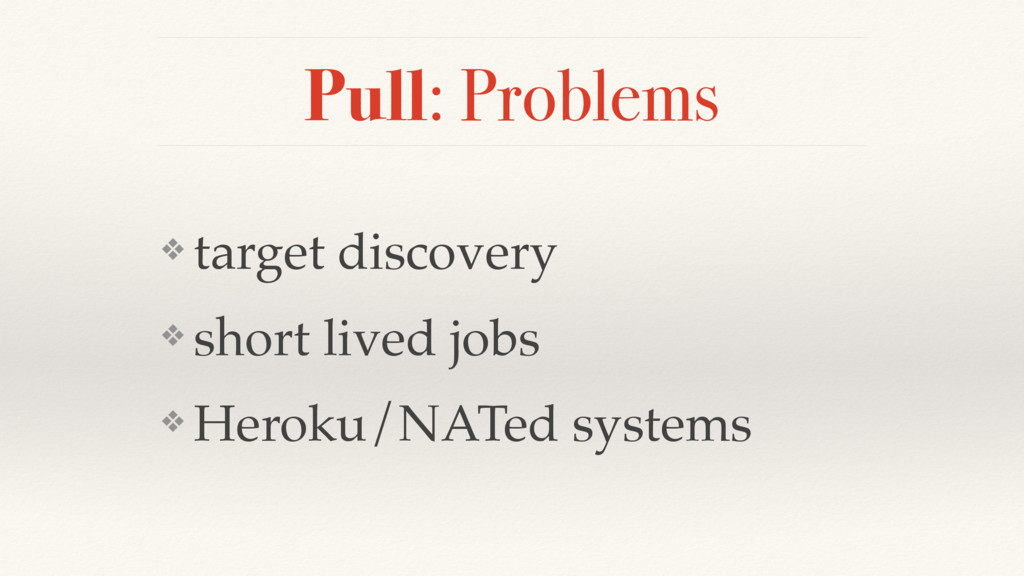
give an overview of the problems with existing solutions,
try to convince you that Prometheus may be what you’ve been waiting for,
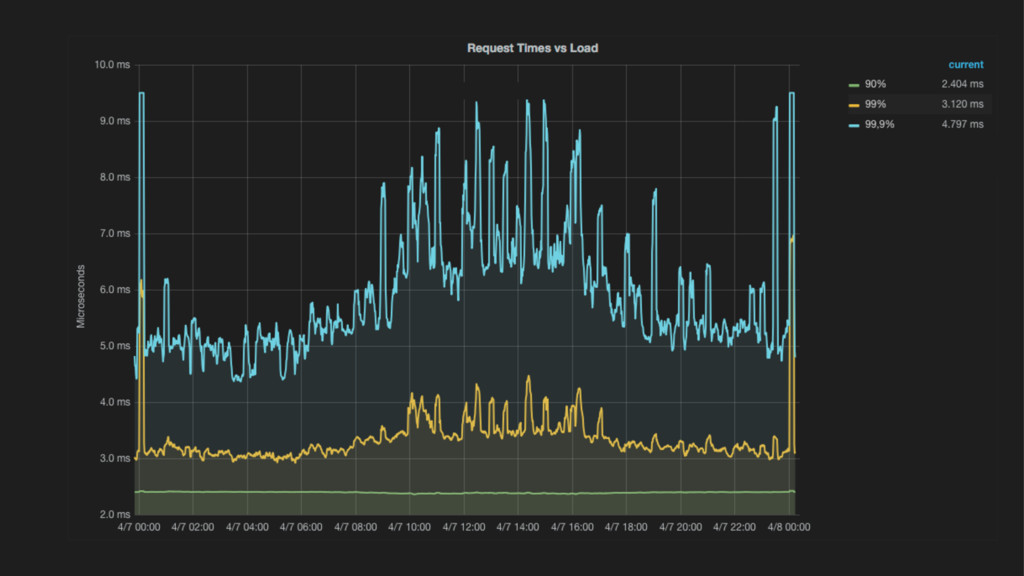
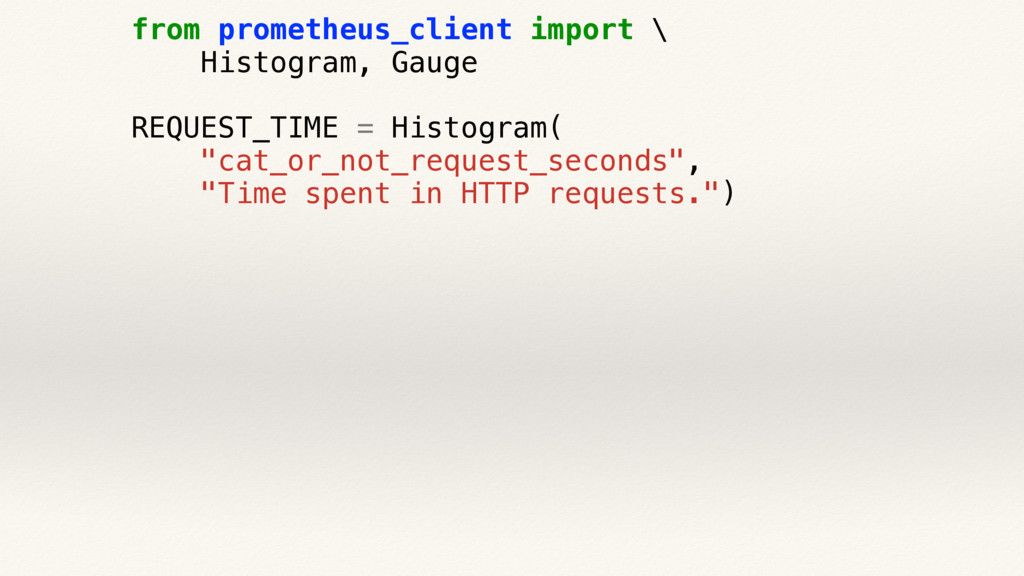
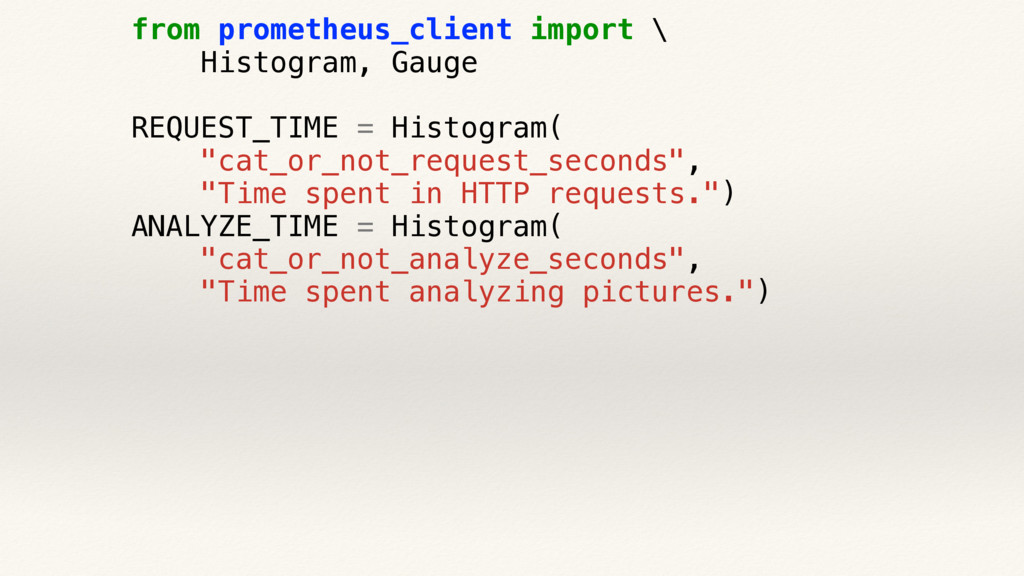
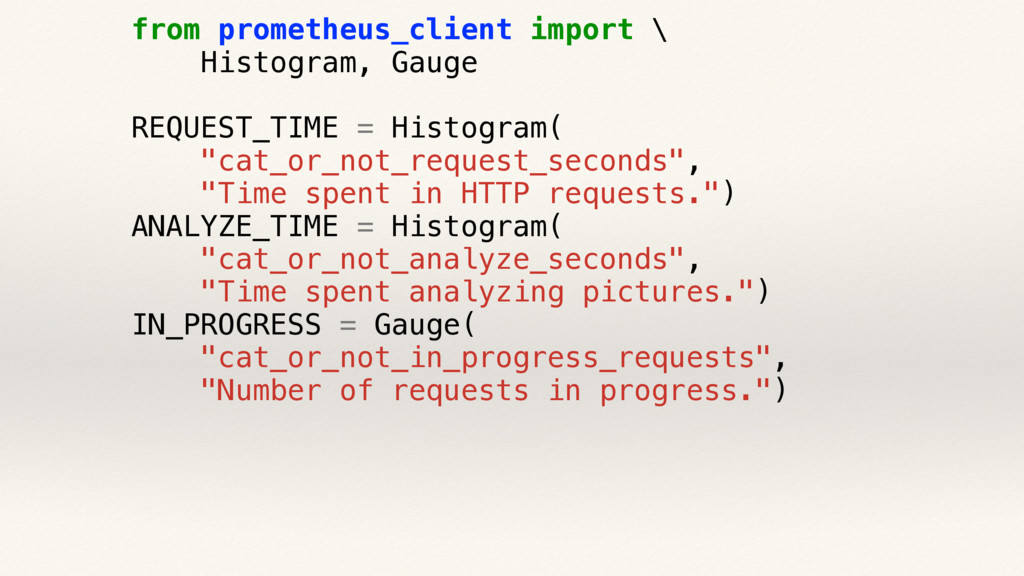
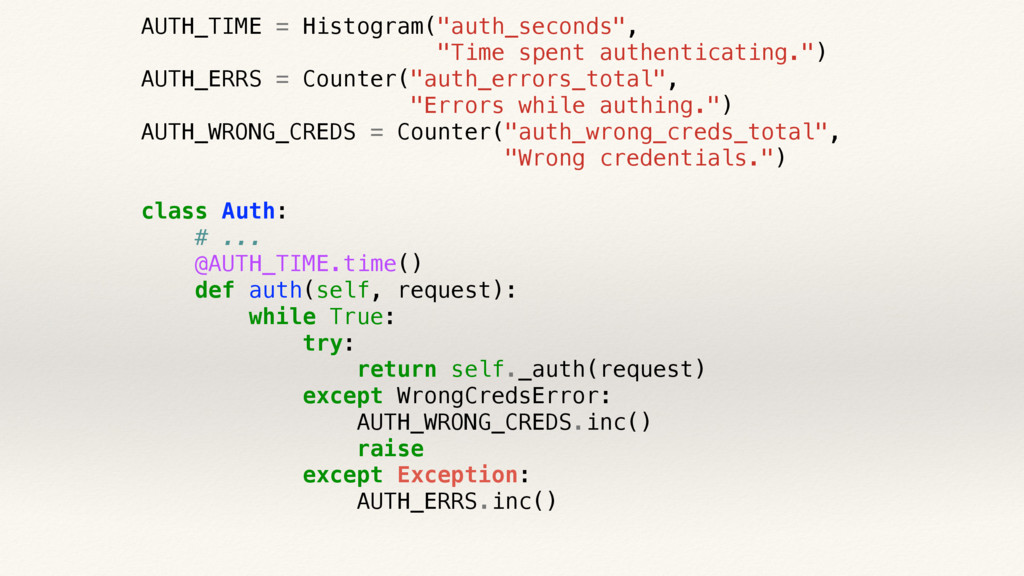
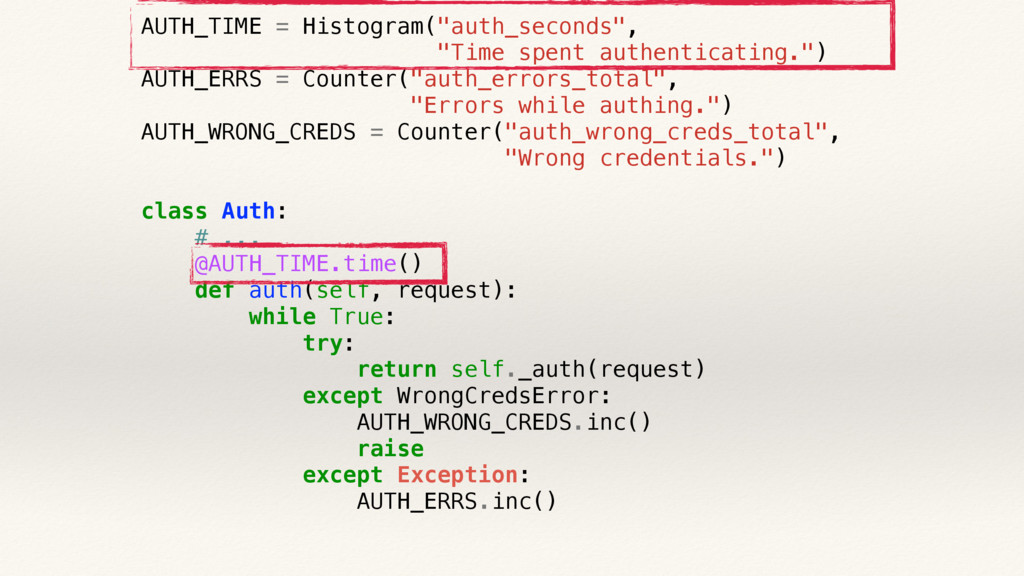
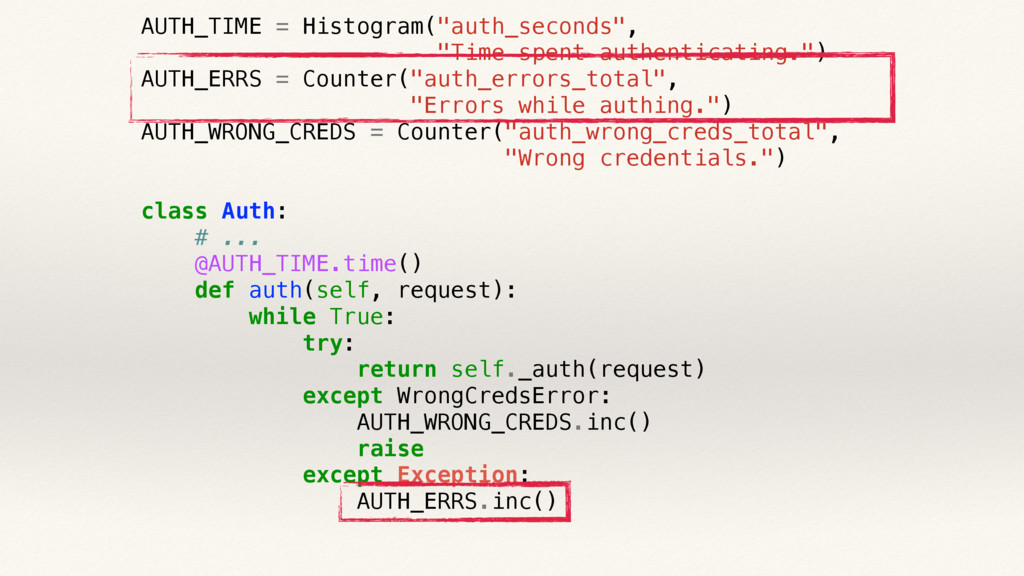
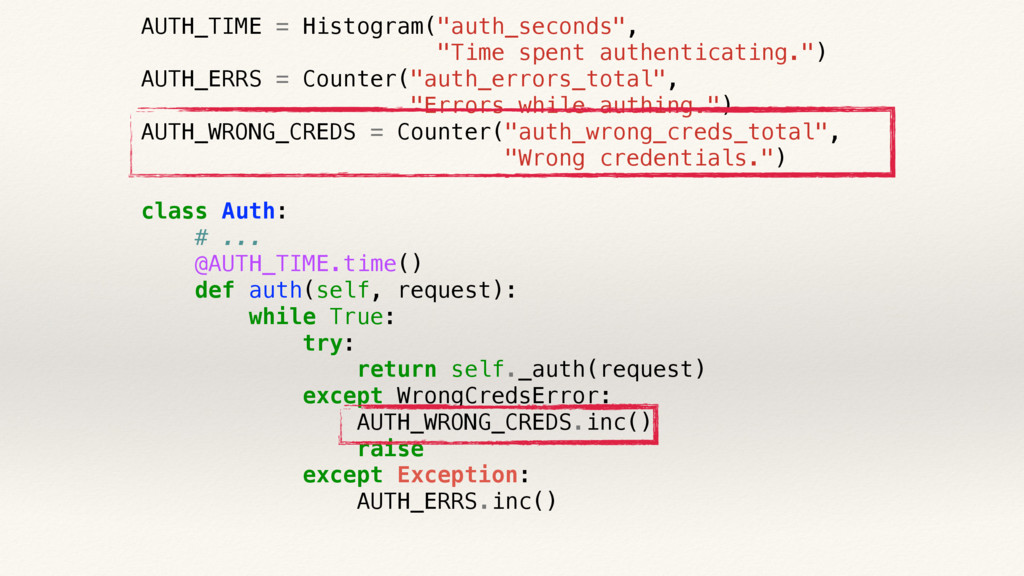
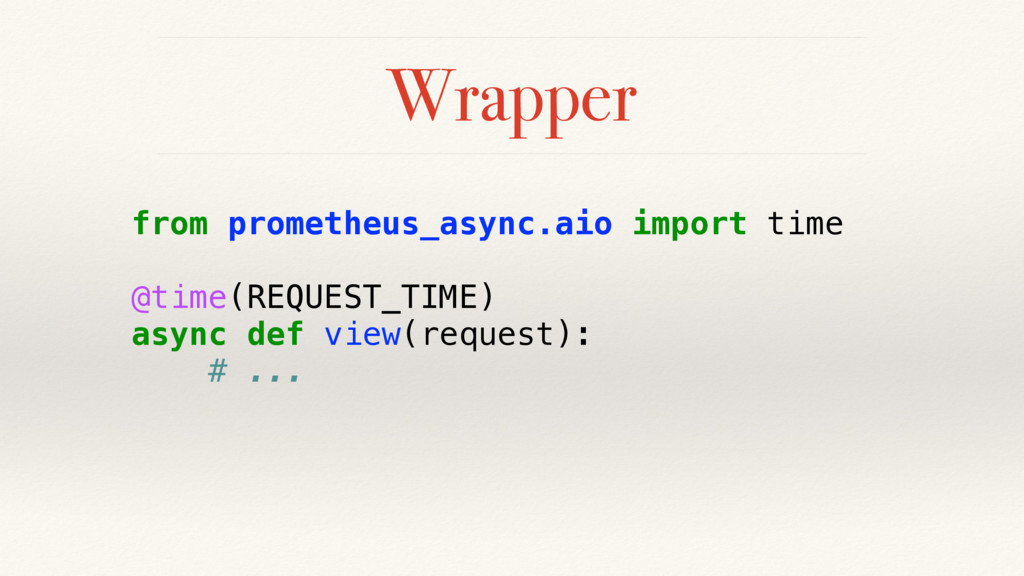
teach how to impress your co-workers with beautiful graphs and intelligent monitoring by putting a fully instrumented Python application into production,
and finally give you pointers on how to migrate an existing metrics infrastructure to Prometheus or how to integrate Prometheus therein.

Pycon ZA

October 07, 2016
Tweet

More Decks by Pycon ZA

Other Decks in Programming

Transcript

  1. Hynek Schlawack Get Instrumented How Prometheus Can Unify Your Metrics

  2. None
  3. Goals

  4. Goals

  5. Goals

  6. Goals

  7. Goals

  8. Metrics

  9. Metrics avg latency 0.3 0.5 0.8 1.1 2.6

  10. Metrics 12:00 12:01 12:02 12:03 12:04 avg latency 0.3 0.5

    0.8 1.1 2.6
  11. Metrics 12:00 12:01 12:02 12:03 12:04 avg latency 0.3 0.5

    0.8 1.1 2.6 server load 0.3 1.0 2.3 3.5 5.2
  12. None
  13. Instrument

  14. Instrument

  15. Instrument

  16. Instrument

  17. Instrument

  18. None
  19. None
  20. Metric Types

  21. Metric Types ❖ counter

  22. Metric Types ❖ counter ❖ gauge

  23. Metric Types ❖ counter ❖ gauge ❖ summary

  24. Metric Types ❖ counter ❖ gauge ❖ summary ❖ histogram

  25. Metric Types ❖ counter ❖ gauge ❖ summary ❖ histogram

    ❖ buckets (1s, 0.5s, 0.25, …)
  26. Percentiles

  27. Percentiles 50th percentile = 1 ms

  28. Percentiles 50th percentile = 1 ms 50% of requests done

    by 1 ms
  29. Naming

  30. Naming backend1_app_http_reqs_msgs_post backend1_app_http_reqs_msgs_get …

  31. Naming backend1_app_http_reqs_msgs_post backend1_app_http_reqs_msgs_get … app_http_reqs_total

  32. Naming backend1_app_http_reqs_msgs_post backend1_app_http_reqs_msgs_get … app_http_reqs_total

  33. Naming backend1_app_http_reqs_msgs_post backend1_app_http_reqs_msgs_get … app_http_reqs_total

  34. Naming backend1_app_http_reqs_msgs_post backend1_app_http_reqs_msgs_get … app_http_reqs_total{meth="POST", path="/msgs", backend="1"} app_http_reqs_total{meth="GET", path="/msgs", backend="1"}

    … app_http_reqs_total
  35. None
  36. None
  37. 1. resolution = scraping interval

  38. 1. resolution = scraping interval 2. missing scrapes = less

    resolution
  39. Pull: Problems ❖ short lived jobs

  40. None
  41. Pull: Problems ❖ short lived jobs ❖ target discovery

  42. Configuration scrape_configs: - job_name: 'prometheus' static_configs: - targets: - 'localhost:9090'

  43. Configuration scrape_configs: - job_name: 'prometheus' static_configs: - targets: - 'localhost:9090'

  44. Configuration scrape_configs: - job_name: 'prometheus' static_configs: - targets: - 'localhost:9090'

  45. Configuration scrape_configs: - job_name: 'prometheus' static_configs: - targets: - 'localhost:9090'

    {instance="localhost:9090",job="prometheus"}
  46. None
  47. Pull: Problems ❖ target discovery ❖ short lived jobs ❖

    Heroku/NATed systems
  48. Pull: Advantages

  49. Pull: Advantages ❖ multiple Prometheis easy

  50. Pull: Advantages ❖ multiple Prometheis easy ❖ outage detection

  51. Pull: Advantages ❖ multiple Prometheis easy ❖ outage detection ❖

    predictable; no self-DoS
  52. Pull: Advantages ❖ multiple Prometheis easy ❖ outage detection ❖

    predictable; no self-DoS ❖ easy to instrument 3rd parties
  53. Metrics Format # HELP req_seconds Time spent \ process a

    request in seconds. # TYPE req_seconds histogram req_seconds_count 390.0 req_seconds_sum 177.0319407
  54. Metrics Format # HELP req_seconds Time spent \ process a

    request in seconds. # TYPE req_seconds histogram req_seconds_count 390.0 req_seconds_sum 177.0319407
  55. Metrics Format # HELP req_seconds Time spent \ process a

    request in seconds. # TYPE req_seconds histogram req_seconds_count 390.0 req_seconds_sum 177.0319407
  56. Metrics Format # HELP req_seconds Time spent \ process a

    request in seconds. # TYPE req_seconds histogram req_seconds_count 390.0 req_seconds_sum 177.0319407
  57. Metrics Format # HELP req_seconds Time spent \ process a

    request in seconds. # TYPE req_seconds histogram req_seconds_count 390.0 req_seconds_sum 177.0319407
  58. Percentiles req_seconds_bucket{le="0.05"} 0.0 req_seconds_bucket{le="0.25"} 1.0 req_seconds_bucket{le="0.5"} 273.0 req_seconds_bucket{le="0.75"} 369.0 req_seconds_bucket{le="1.0"}

    388.0 req_seconds_bucket{le="2.0"} 390.0 req_seconds_bucket{le="+Inf"} 390.0
  59. Percentiles req_seconds_bucket{le="0.05"} 0.0 req_seconds_bucket{le="0.25"} 1.0 req_seconds_bucket{le="0.5"} 273.0 req_seconds_bucket{le="0.75"} 369.0 req_seconds_bucket{le="1.0"}

    388.0 req_seconds_bucket{le="2.0"} 390.0 req_seconds_bucket{le="+Inf"} 390.0
  60. Percentiles req_seconds_bucket{le="0.05"} 0.0 req_seconds_bucket{le="0.25"} 1.0 req_seconds_bucket{le="0.5"} 273.0 req_seconds_bucket{le="0.75"} 369.0 req_seconds_bucket{le="1.0"}

    388.0 req_seconds_bucket{le="2.0"} 390.0 req_seconds_bucket{le="+Inf"} 390.0
  61. None
  62. Aggregation

  63. Aggregation sum( rate( req_seconds_count[1m] ) )

  64. Aggregation sum( rate( req_seconds_count[1m] ) )

  65. Aggregation sum( rate( req_seconds_count[1m] ) )

  66. Aggregation sum( rate( req_seconds_count[1m] ) )

  67. Aggregation sum( rate( req_seconds_count{dc="west"}[1m] ) )

  68. Aggregation sum( rate( req_seconds_count[1m] ) ) by (dc)

  69. Percentiles histogram_quantile( 0.9, rate( req_seconds_bucket[10m] ))

  70. Percentiles histogram_quantile( 0.9, rate( req_seconds_bucket[10m] ))

  71. Percentiles histogram_quantile( 0.9, rate( req_seconds_bucket[10m] ))

  72. Percentiles histogram_quantile( 0.9, rate( req_seconds_bucket[10m] ))

  73. Percentiles histogram_quantile( 0.9, rate( req_seconds_bucket[10m] ))

  74. None
  75. None
  76. Internal

  77. Internal ❖ great for ad-hoc

  78. Internal ❖ great for ad-hoc ❖ 1 expr per graph

  79. Internal ❖ great for ad-hoc ❖ 1 expr per graph

    ❖ templating
  80. PromDash ❖ best integration ❖ former official ❖ now deprecated

    ❖ don’t bother
  81. PromDash ❖ best integration ❖ former official ❖ now deprecated

    ❖ don’t bother
  82. Grafana

  83. Grafana ❖ pretty & powerful

  84. Grafana ❖ pretty & powerful ❖ many integrations

  85. Grafana ❖ pretty & powerful ❖ many integrations ❖ mix

    and match!
  86. Grafana ❖ pretty & powerful ❖ many integrations ❖ mix

    and match! ❖ use this!
  87. None
  88. Alerts & Scrying

  89. Alerts & Scrying ALERT DiskWillFillIn4Hours IF predict_linear( node_filesystem_free[1h], 4*3600) <

    0 FOR 5m
  90. Alerts & Scrying ALERT DiskWillFillIn4Hours IF predict_linear( node_filesystem_free[1h], 4*3600) <

    0 FOR 5m
  91. Alerts & Scrying ALERT DiskWillFillIn4Hours IF predict_linear( node_filesystem_free[1h], 4*3600) <

    0 FOR 5m
  92. Alerts & Scrying ALERT DiskWillFillIn4Hours IF predict_linear( node_filesystem_free[1h], 4*3600) <

    0 FOR 5m
  93. Alerts & Scrying ALERT DiskWillFillIn4Hours IF predict_linear( node_filesystem_free[1h], 4*3600) <

    0 FOR 5m
  94. Alerts & Scrying ALERT DiskWillFillIn4Hours IF predict_linear( node_filesystem_free[1h], 4*3600) <

    0 FOR 5m
  95. None
  96. None
  97. None
  98. Environment

  99. None
  100. Apache nginx Django PostgreSQL MySQL MongoDB CouchDB redis Varnish etcd

    Kubernetes Consul collectd HAProxy statsd graphite InfluxDB SNMP
  101. Apache nginx Django PostgreSQL MySQL MongoDB CouchDB redis Varnish etcd

    Kubernetes Consul collectd HAProxy statsd graphite InfluxDB SNMP
  102. node_exporter

  103. node_exporter cAdvisor

  104. System Insight ❖ load ❖ procs ❖ memory ❖ network

    ❖ disk ❖ I/O
  105. Moar

  106. Moar ❖ Edges: web servers/HAProxy

  107. Moar ❖ Edges: web servers/HAProxy ❖ black box

  108. Moar ❖ Edges: web servers/HAProxy ❖ black box ❖ databases

  109. Moar ❖ Edges: web servers/HAProxy ❖ black box ❖ databases

    ❖ network
  110. So Far

  111. So Far ❖ system stats

  112. So Far ❖ system stats ❖ outside look

  113. So Far ❖ system stats ❖ outside look ❖ 3rd

    party components
  114. Code

  115. cat-or.not

  116. cat-or.not ❖ HTTP service

  117. cat-or.not ❖ HTTP service ❖ upload picture

  118. cat-or.not ❖ HTTP service ❖ upload picture ❖ meow!/nope meow!

  119. from flask import Flask, g, request from cat_or_not import is_cat

    app = Flask(__name__) @app.route("/analyze", methods=["POST"]) def analyze(): g.auth.check(request) return ("meow!" if is_cat(request.files["pic"]) else "nope!") if __name__ == "__main__": app.run()
  120. from flask import Flask, g, request from cat_or_not import is_cat

    app = Flask(__name__) @app.route("/analyze", methods=["POST"]) def analyze(): g.auth.check(request) return ("meow!" if is_cat(request.files["pic"]) else "nope!") if __name__ == "__main__": app.run()
  121. from flask import Flask, g, request from cat_or_not import is_cat

    app = Flask(__name__) @app.route("/analyze", methods=["POST"]) def analyze(): g.auth.check(request) return ("meow!" if is_cat(request.files["pic"]) else "nope!") if __name__ == "__main__": app.run()
  122. pip install prometheus_client

  123. from prometheus_client import \ start_http_server # … if __name__ ==

    "__main__": start_http_server(8000) app.run()
  124. process_virtual_memory_bytes 156393472.0 process_resident_memory_bytes 20480000.0 process_start_time_seconds 1460214325.21 process_cpu_seconds_total 0.169999999998 process_open_fds 8.0

    process_max_fds 1024.0
  125. process_virtual_memory_bytes 156393472.0 process_resident_memory_bytes 20480000.0 process_start_time_seconds 1460214325.21 process_cpu_seconds_total 0.169999999998 process_open_fds 8.0

    process_max_fds 1024.0
  126. process_virtual_memory_bytes 156393472.0 process_resident_memory_bytes 20480000.0 process_start_time_seconds 1460214325.21 process_cpu_seconds_total 0.169999999998 process_open_fds 8.0

    process_max_fds 1024.0
  127. process_virtual_memory_bytes 156393472.0 process_resident_memory_bytes 20480000.0 process_start_time_seconds 1460214325.21 process_cpu_seconds_total 0.169999999998 process_open_fds 8.0

    process_max_fds 1024.0
  128. process_virtual_memory_bytes 156393472.0 process_resident_memory_bytes 20480000.0 process_start_time_seconds 1460214325.21 process_cpu_seconds_total 0.169999999998 process_open_fds 8.0

    process_max_fds 1024.0
  129. process_virtual_memory_bytes 156393472.0 process_resident_memory_bytes 20480000.0 process_start_time_seconds 1460214325.21 process_cpu_seconds_total 0.169999999998 process_open_fds 8.0

    process_max_fds 1024.0
  130. None
  131. from prometheus_client import \ Histogram, Gauge REQUEST_TIME = Histogram( "cat_or_not_request_seconds",

    "Time spent in HTTP requests.")
  132. from prometheus_client import \ Histogram, Gauge REQUEST_TIME = Histogram( "cat_or_not_request_seconds",

    "Time spent in HTTP requests.") ANALYZE_TIME = Histogram( "cat_or_not_analyze_seconds", "Time spent analyzing pictures.")
  133. from prometheus_client import \ Histogram, Gauge REQUEST_TIME = Histogram( "cat_or_not_request_seconds",

    "Time spent in HTTP requests.") ANALYZE_TIME = Histogram( "cat_or_not_analyze_seconds", "Time spent analyzing pictures.") IN_PROGRESS = Gauge( "cat_or_not_in_progress_requests", "Number of requests in progress.")
  134. @app.route("/analyze", methods=["POST"]) @IN_PROGRESS.track_inprogress() @REQUEST_TIME.time() def analyze(): g.auth.check(request) with ANALYZE_TIME.time(): result

    = is_cat( request.files["pic"].stream) return "meow!" if result else "nope!"
  135. @app.route("/analyze", methods=["POST"]) @IN_PROGRESS.track_inprogress() @REQUEST_TIME.time() def analyze(): g.auth.check(request) with ANALYZE_TIME.time(): result

    = is_cat( request.files["pic"].stream) return "meow!" if result else "nope!"
  136. AUTH_TIME = Histogram("auth_seconds", "Time spent authenticating.") AUTH_ERRS = Counter("auth_errors_total", "Errors

    while authing.") AUTH_WRONG_CREDS = Counter("auth_wrong_creds_total", "Wrong credentials.") class Auth: # ... @AUTH_TIME.time() def auth(self, request): while True: try: return self._auth(request) except WrongCredsError: AUTH_WRONG_CREDS.inc() raise except Exception: AUTH_ERRS.inc()
  137. AUTH_TIME = Histogram("auth_seconds", "Time spent authenticating.") AUTH_ERRS = Counter("auth_errors_total", "Errors

    while authing.") AUTH_WRONG_CREDS = Counter("auth_wrong_creds_total", "Wrong credentials.") class Auth: # ... @AUTH_TIME.time() def auth(self, request): while True: try: return self._auth(request) except WrongCredsError: AUTH_WRONG_CREDS.inc() raise except Exception: AUTH_ERRS.inc()
  138. AUTH_TIME = Histogram("auth_seconds", "Time spent authenticating.") AUTH_ERRS = Counter("auth_errors_total", "Errors

    while authing.") AUTH_WRONG_CREDS = Counter("auth_wrong_creds_total", "Wrong credentials.") class Auth: # ... @AUTH_TIME.time() def auth(self, request): while True: try: return self._auth(request) except WrongCredsError: AUTH_WRONG_CREDS.inc() raise except Exception: AUTH_ERRS.inc()
  139. AUTH_TIME = Histogram("auth_seconds", "Time spent authenticating.") AUTH_ERRS = Counter("auth_errors_total", "Errors

    while authing.") AUTH_WRONG_CREDS = Counter("auth_wrong_creds_total", "Wrong credentials.") class Auth: # ... @AUTH_TIME.time() def auth(self, request): while True: try: return self._auth(request) except WrongCredsError: AUTH_WRONG_CREDS.inc() raise except Exception: AUTH_ERRS.inc()
  140. @app.route("/analyze", methods=["POST"]) def analyze(): g.auth.check(request) with ANALYZE_TIME.time(): result = is_cat(

    request.files["pic"].stream) return "meow!" if result else "nope!"
  141. pip install prometheus_async

  142. Wrapper from prometheus_async.aio import time @time(REQUEST_TIME) async def view(request): #

    ...
  143. Goodies

  144. Goodies ❖ aiohttp-based metrics export

  145. Goodies ❖ aiohttp-based metrics export ❖ also in thread!

  146. Goodies ❖ aiohttp-based metrics export ❖ also in thread! ❖

    Consul Agent integration
  147. Wrap Up

  148. Wrap Up ✓

  149. Wrap Up ✓ ✓

  150. Wrap Up ✓ ✓ ✓

  151. ox.cx/p @hynek vrmd.de