Upgrade to Pro — share decks privately, control downloads, hide ads and more …

profile-guided code analysis

profile-guided code analysis

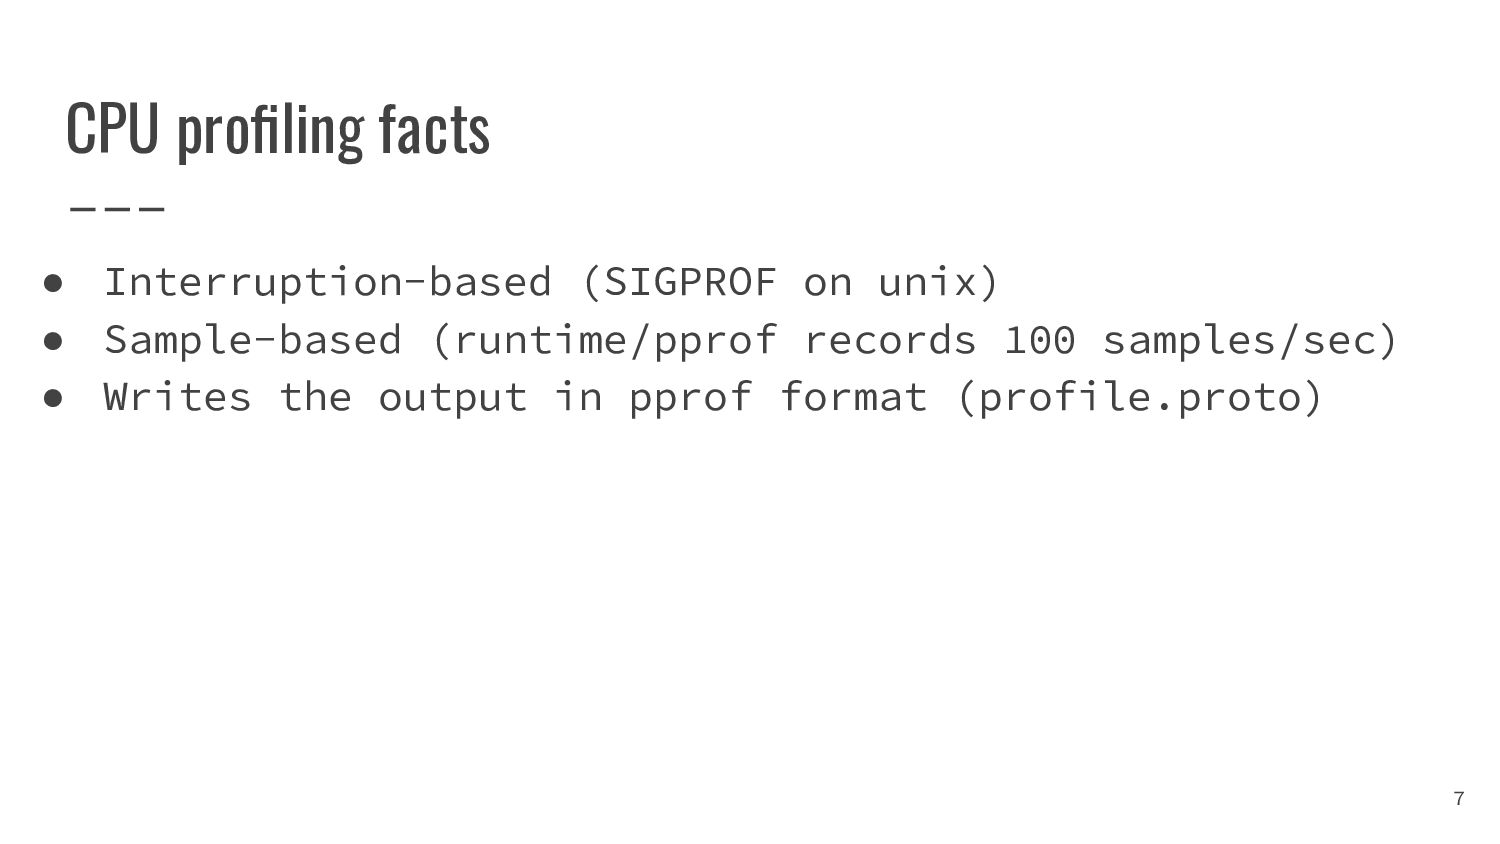
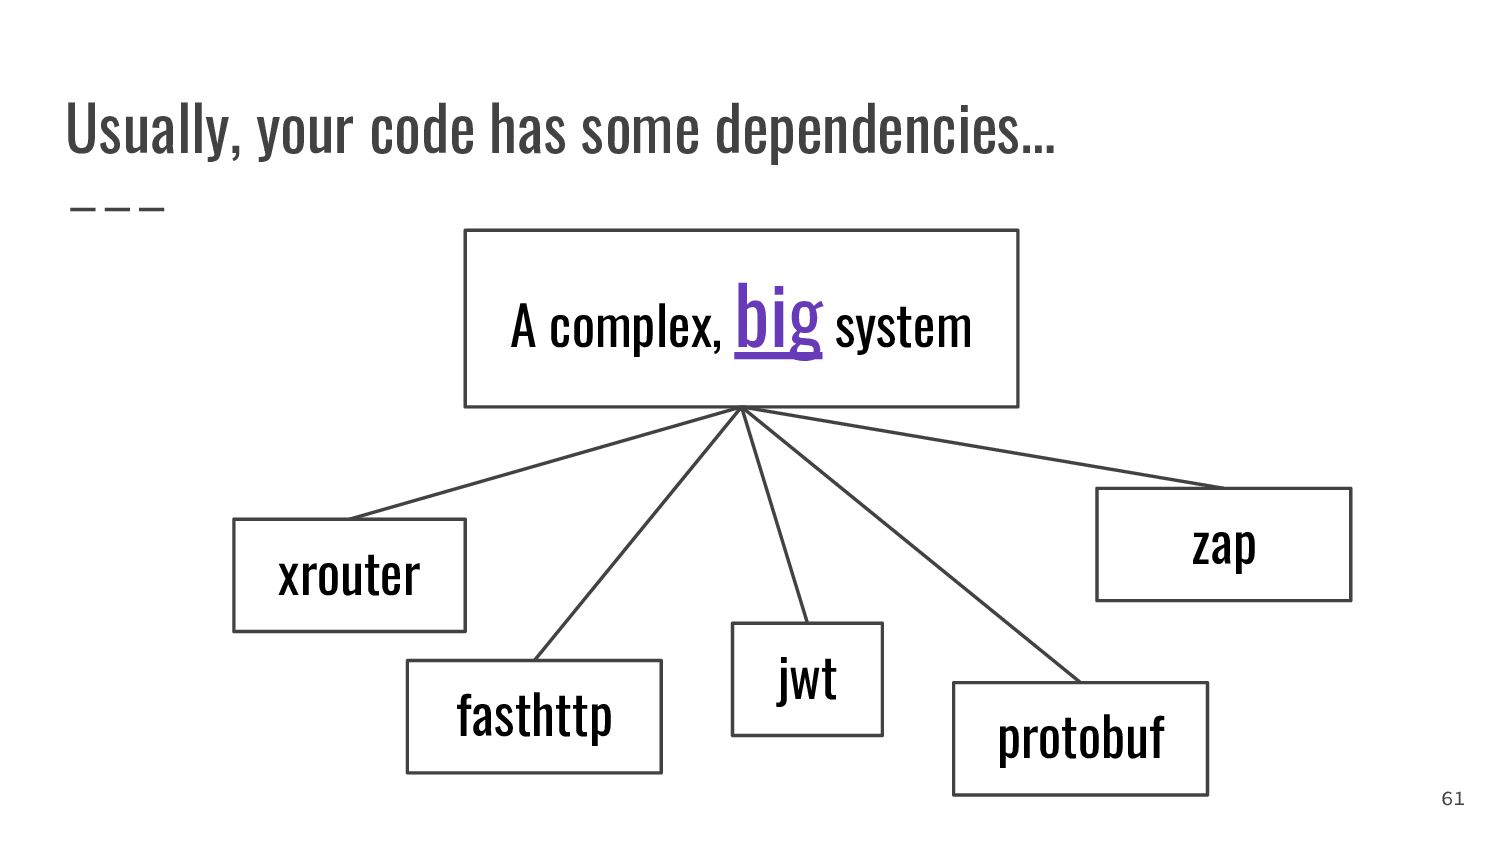
CPU-профили, когда собраны с рабочей системы при репрезентативной нагрузке, позволяют выявлять паттерны исполнения вашей программы. Знаете ли вы, что эти профили можно использовать не только внутри pprof для ручной оптимизации, но и для других целей?

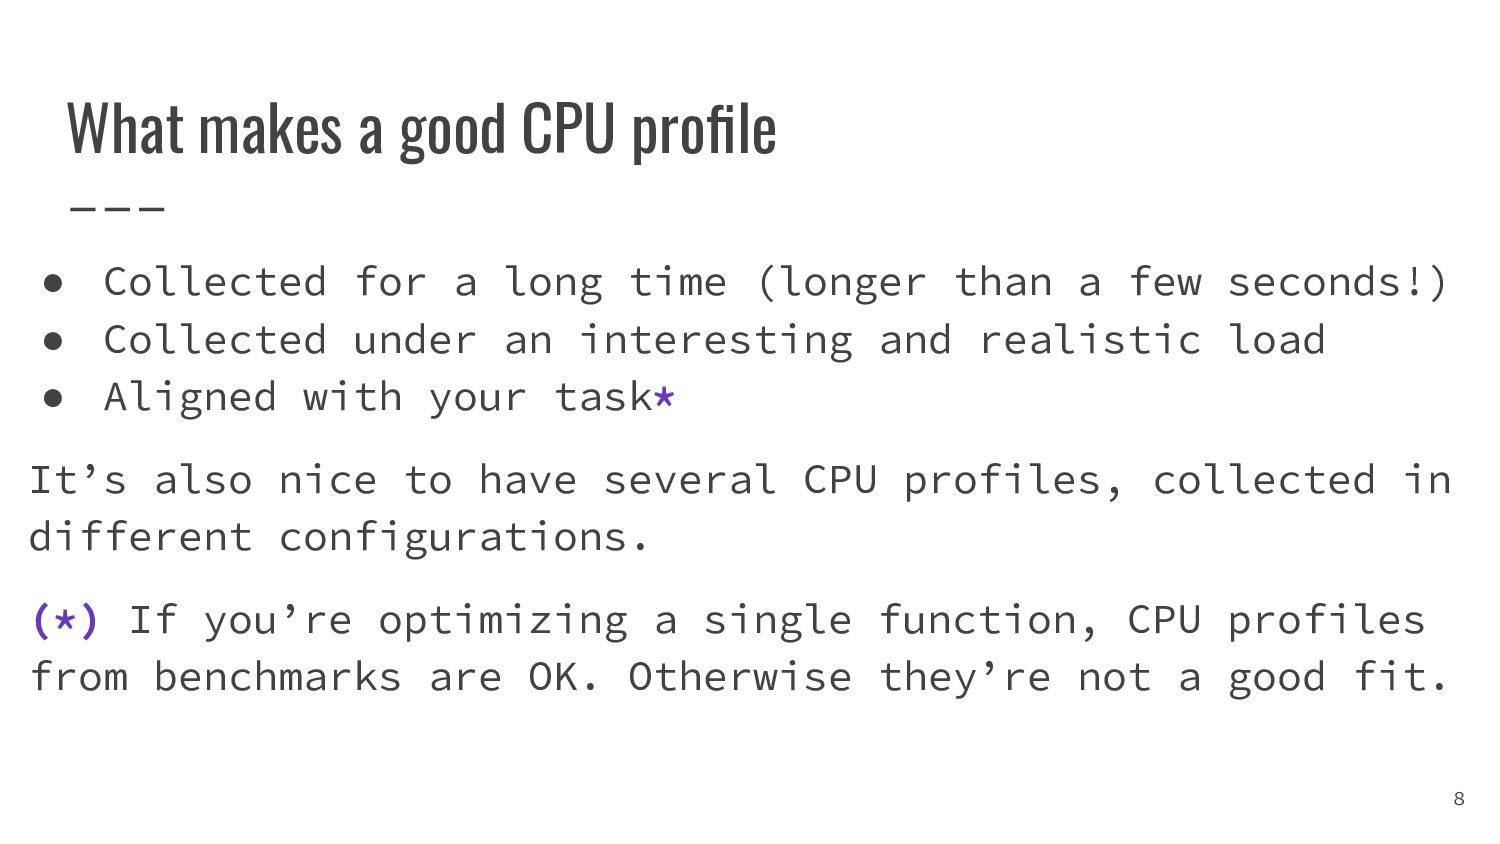
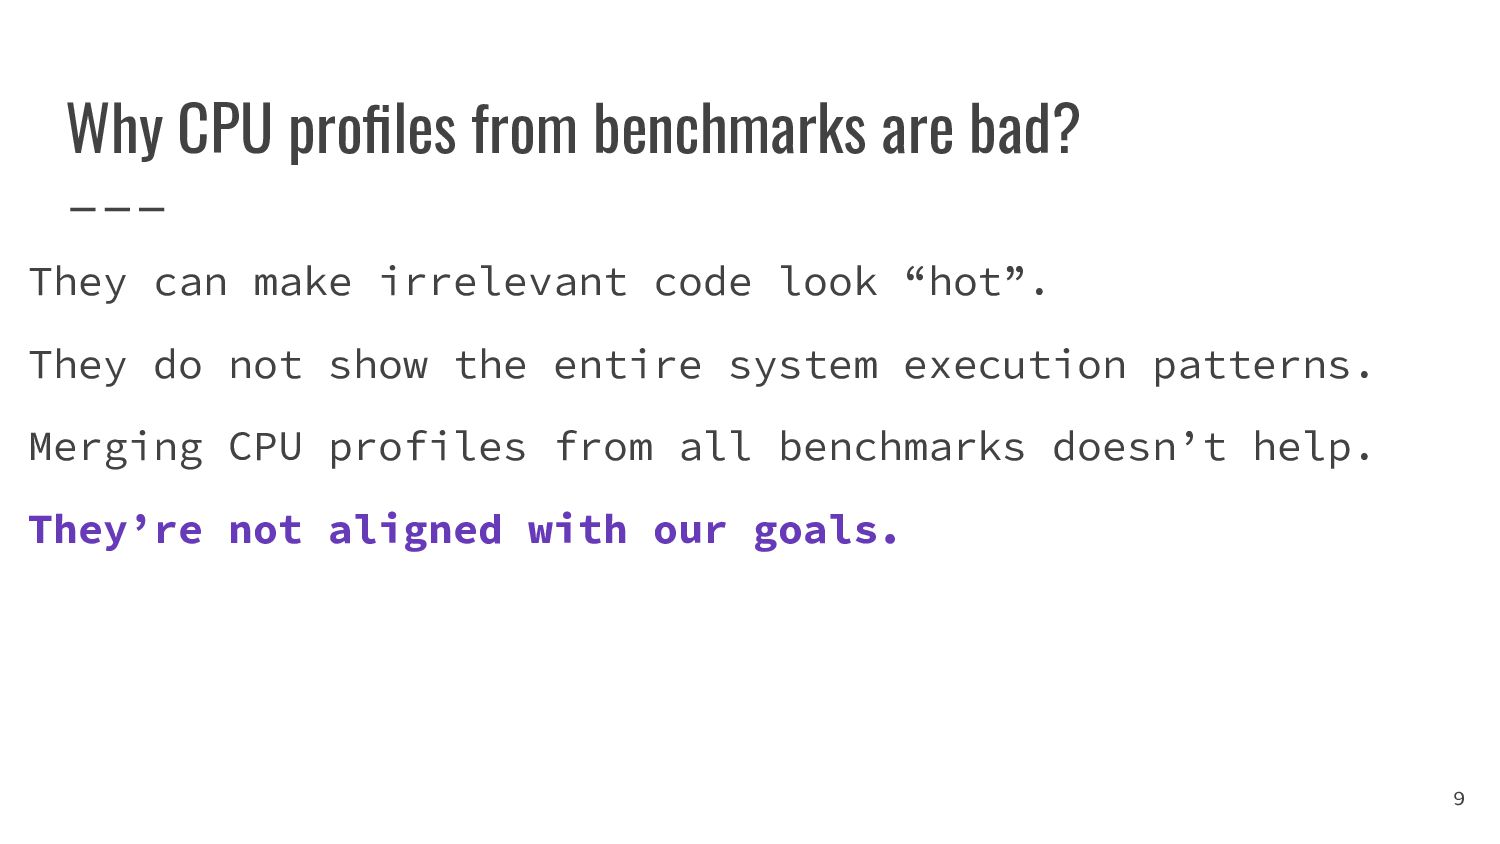
- как отличить хороший CPU профиль от плохого

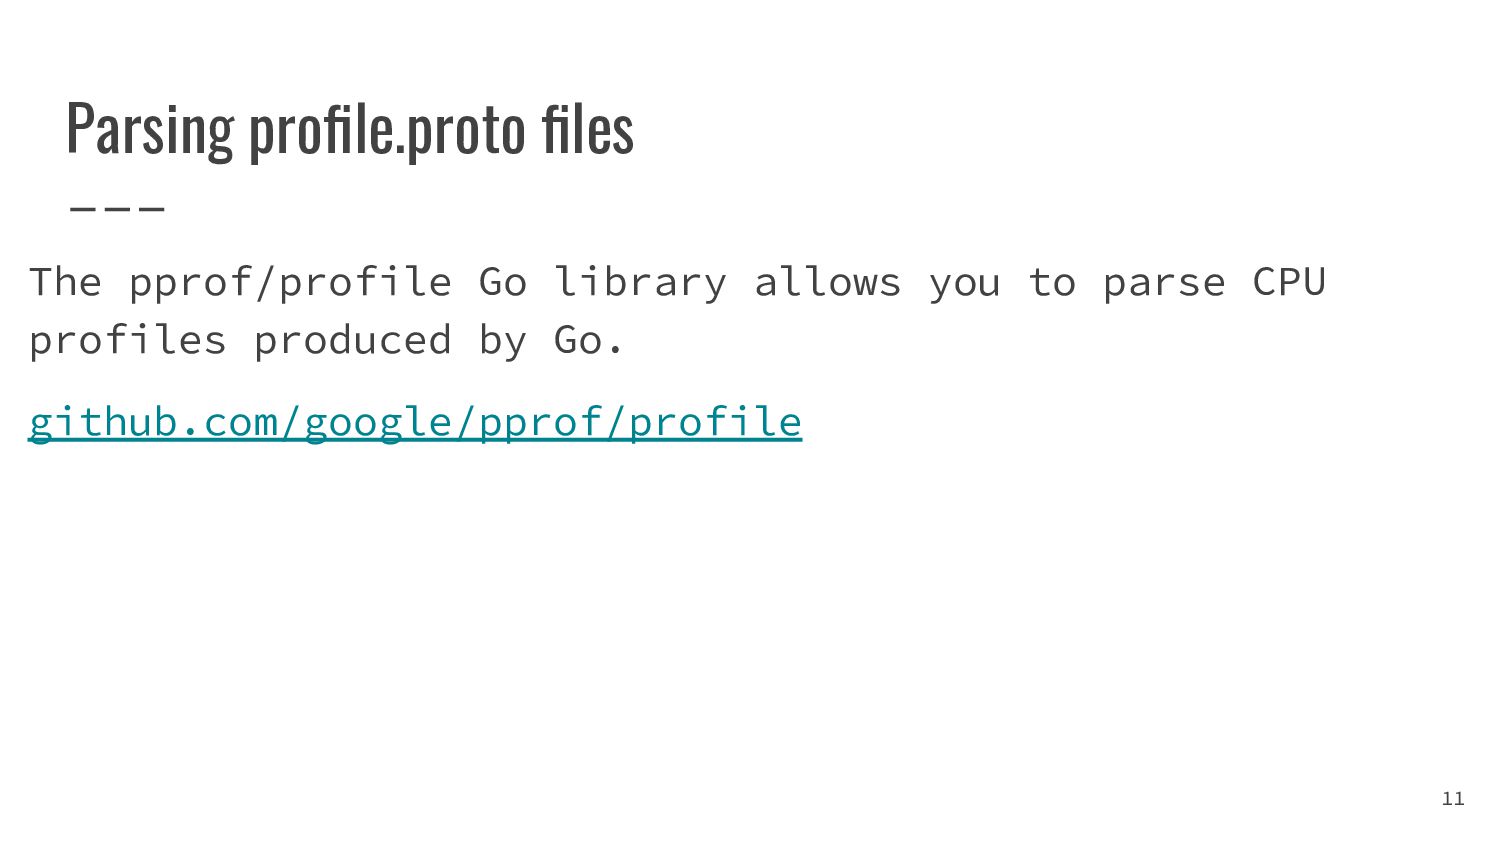
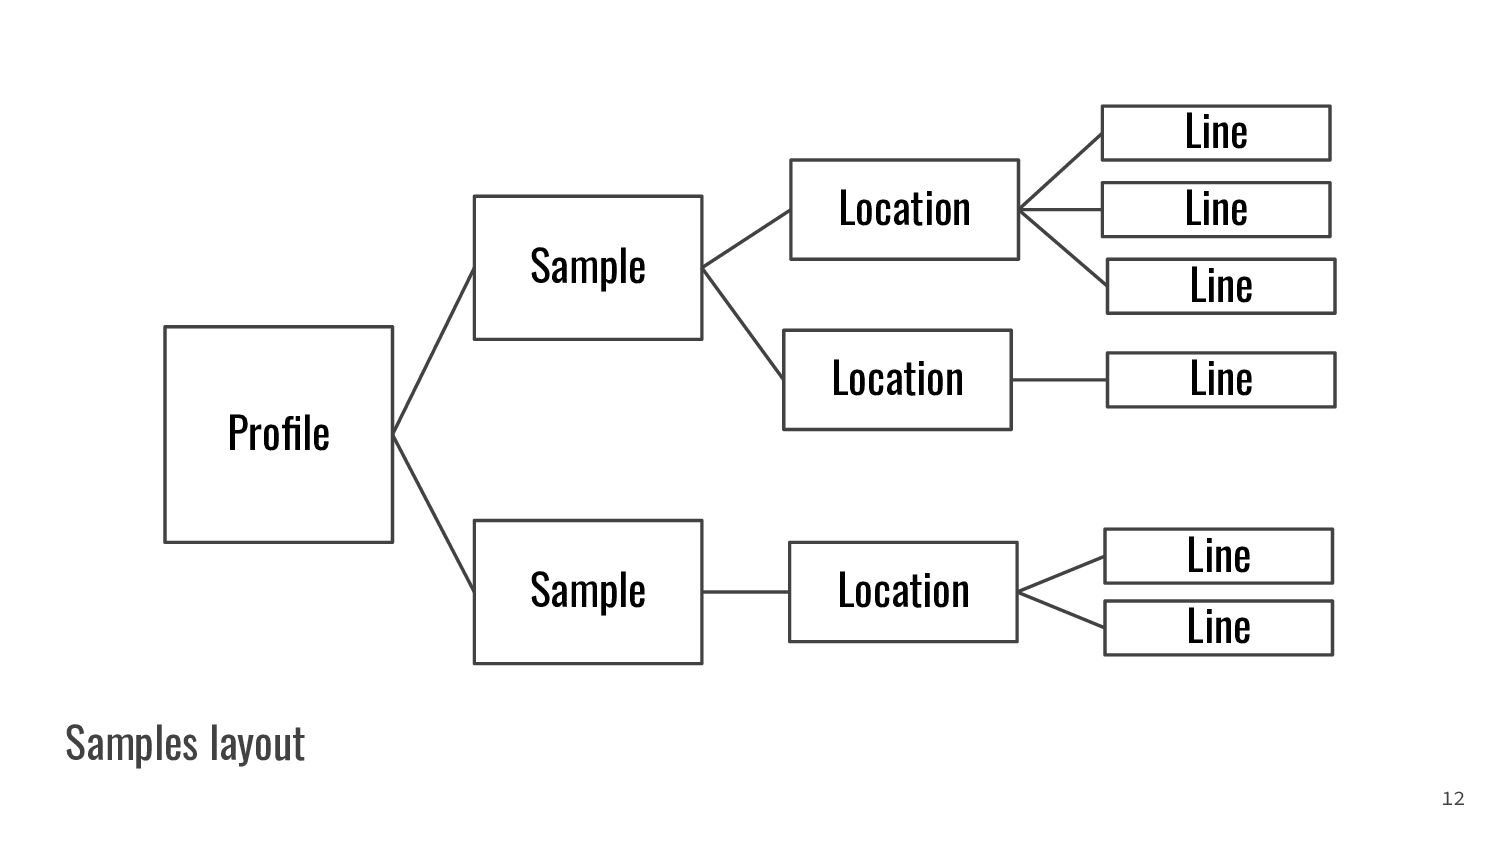
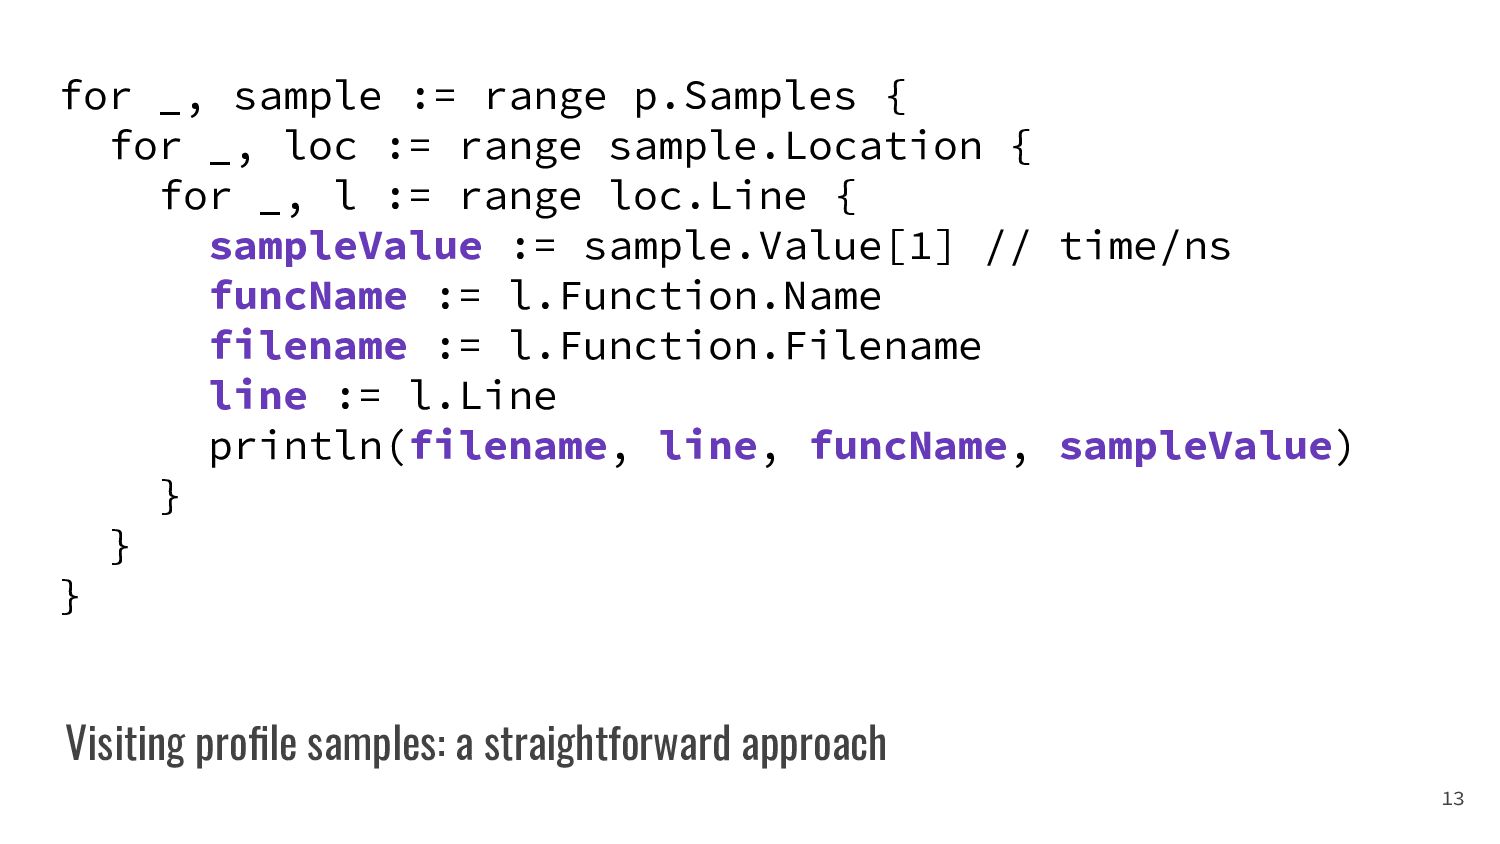
- какова структура profile.proto файлов и как их парсить

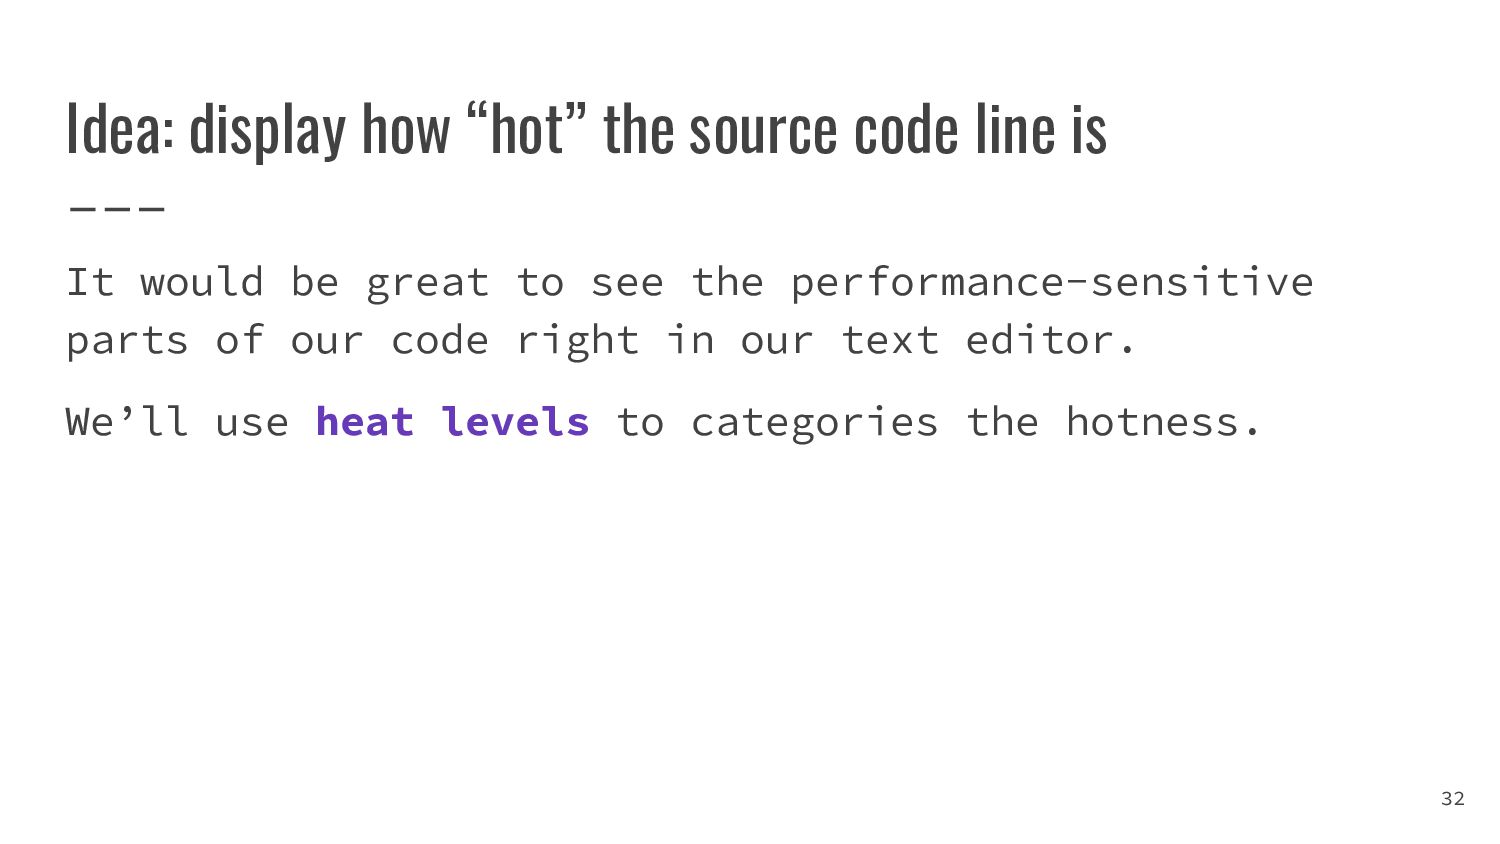
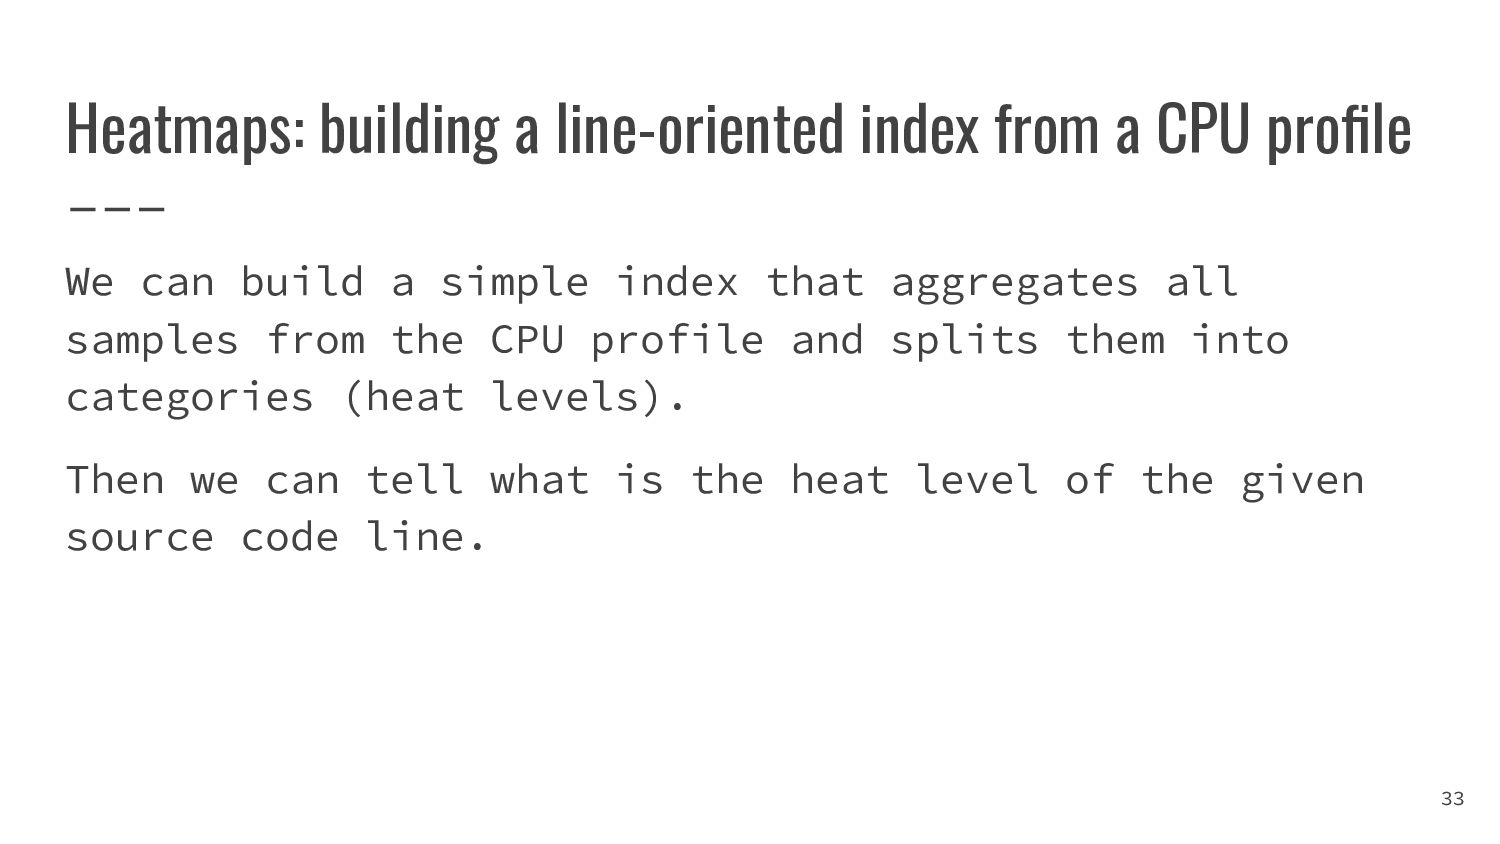
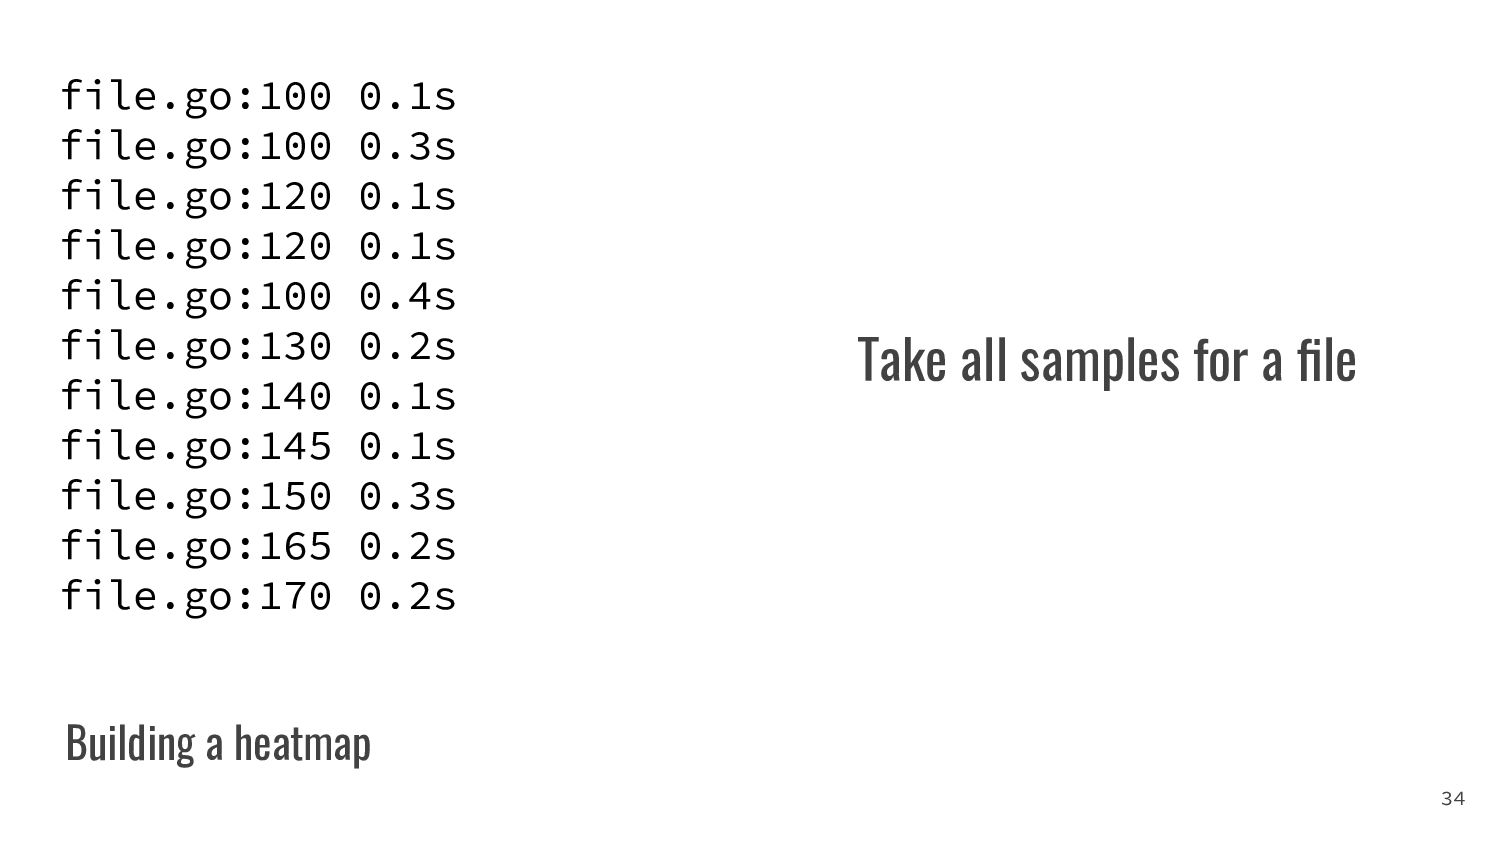
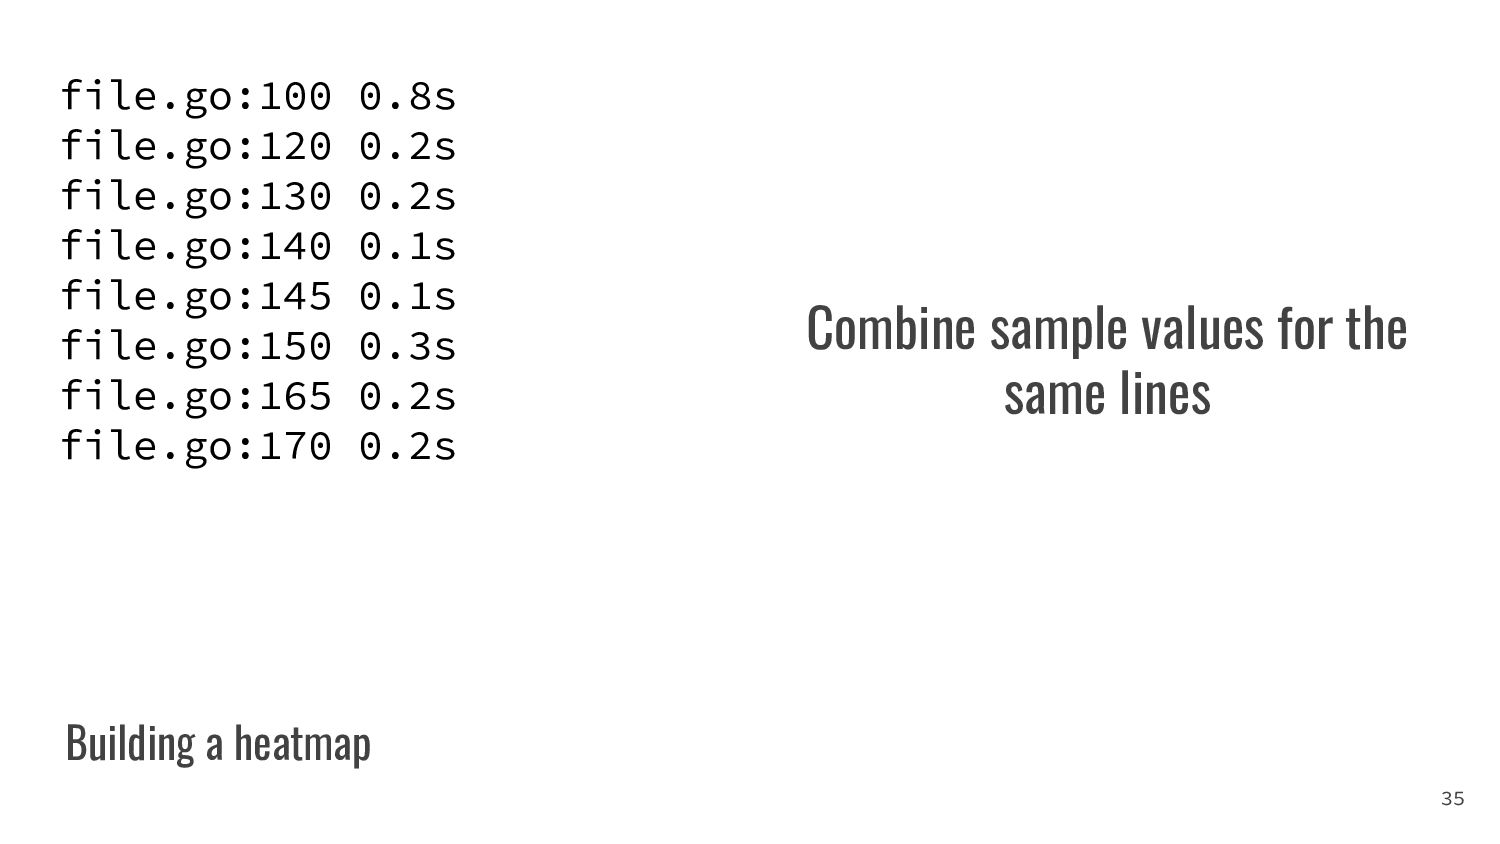
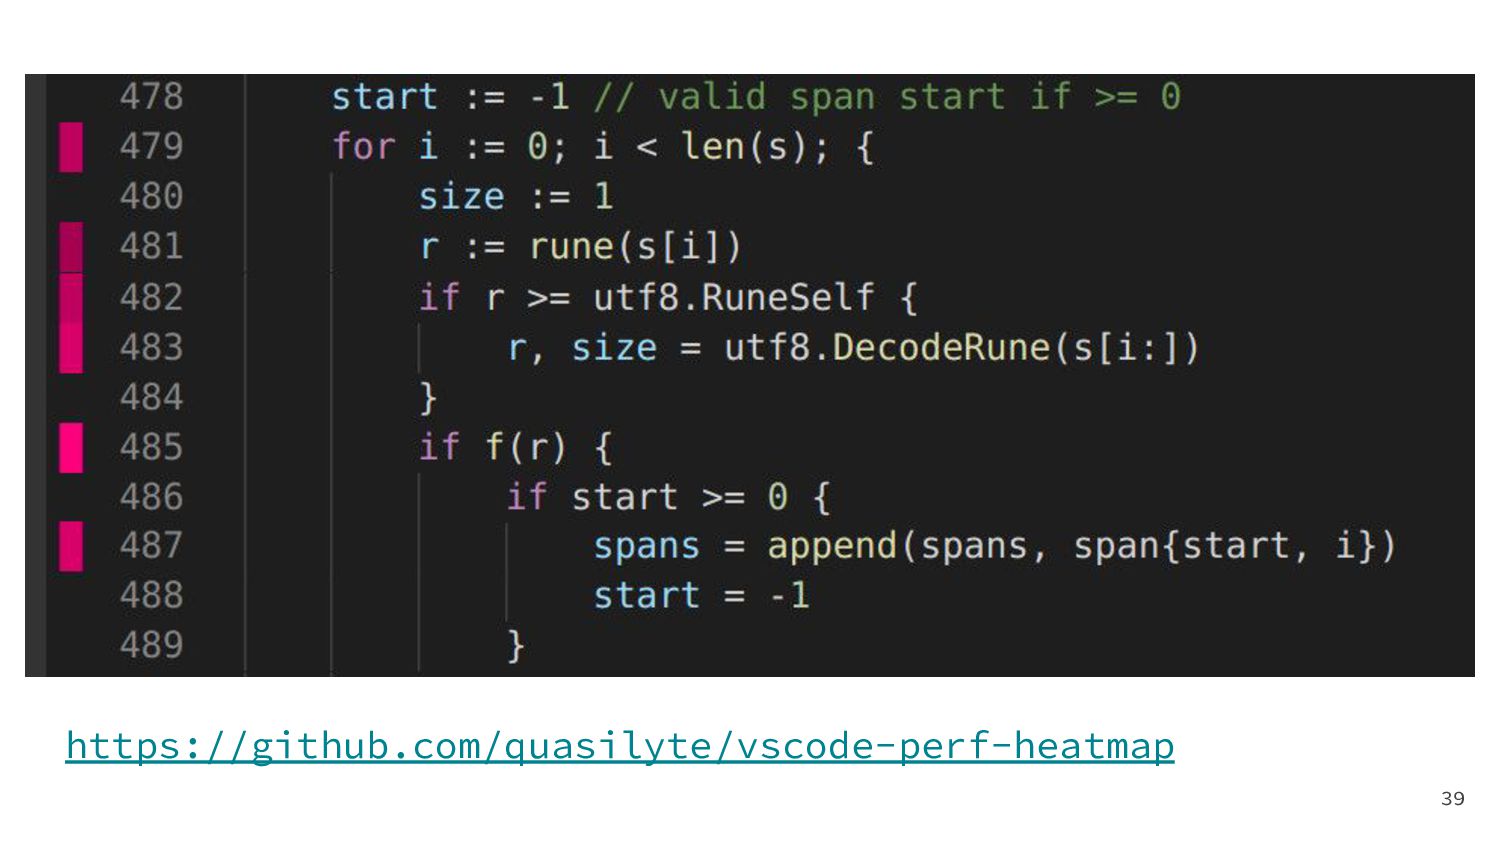
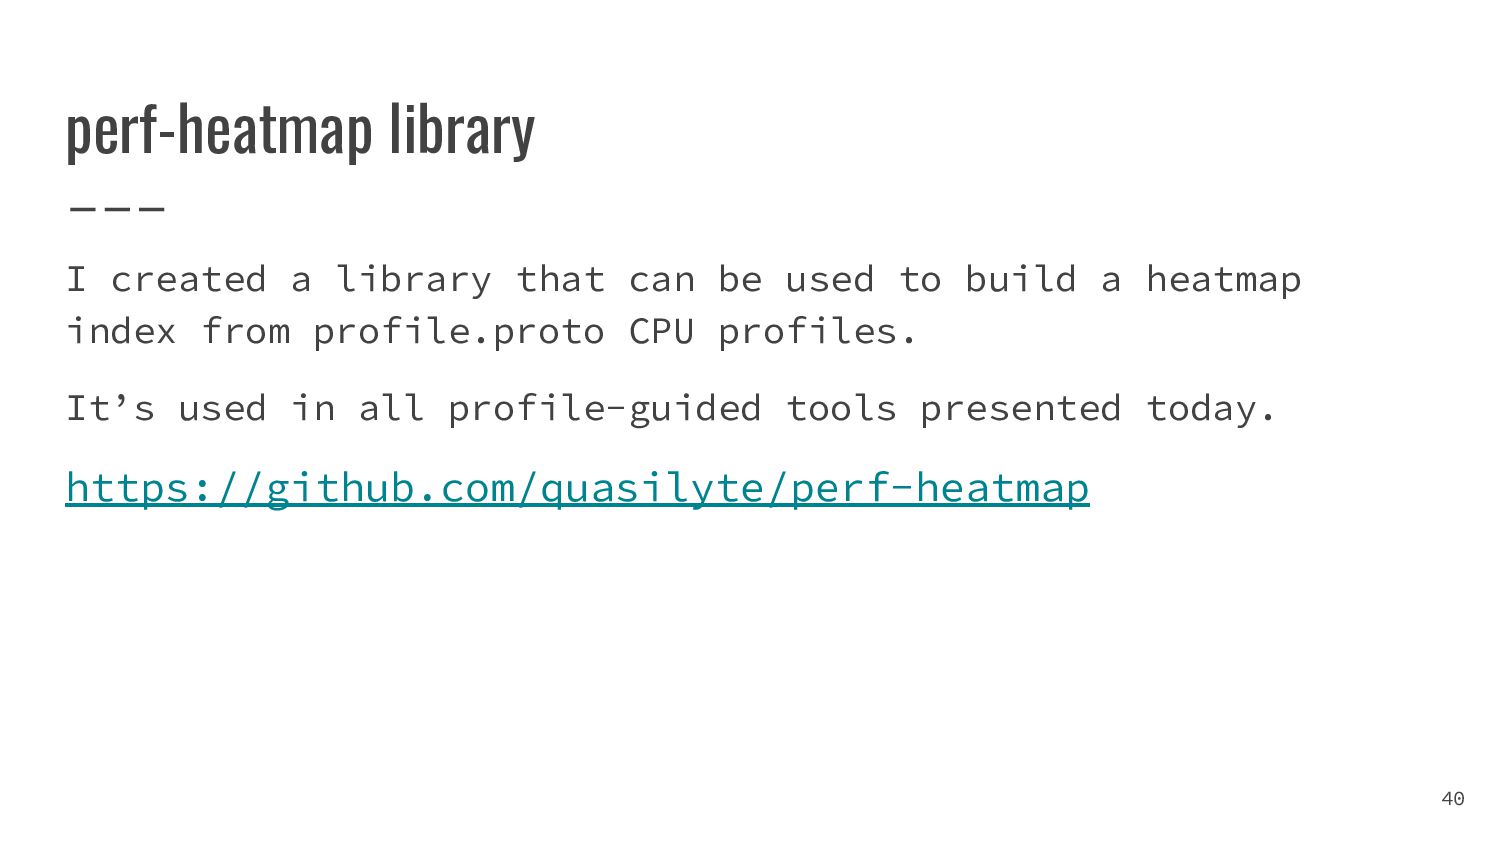
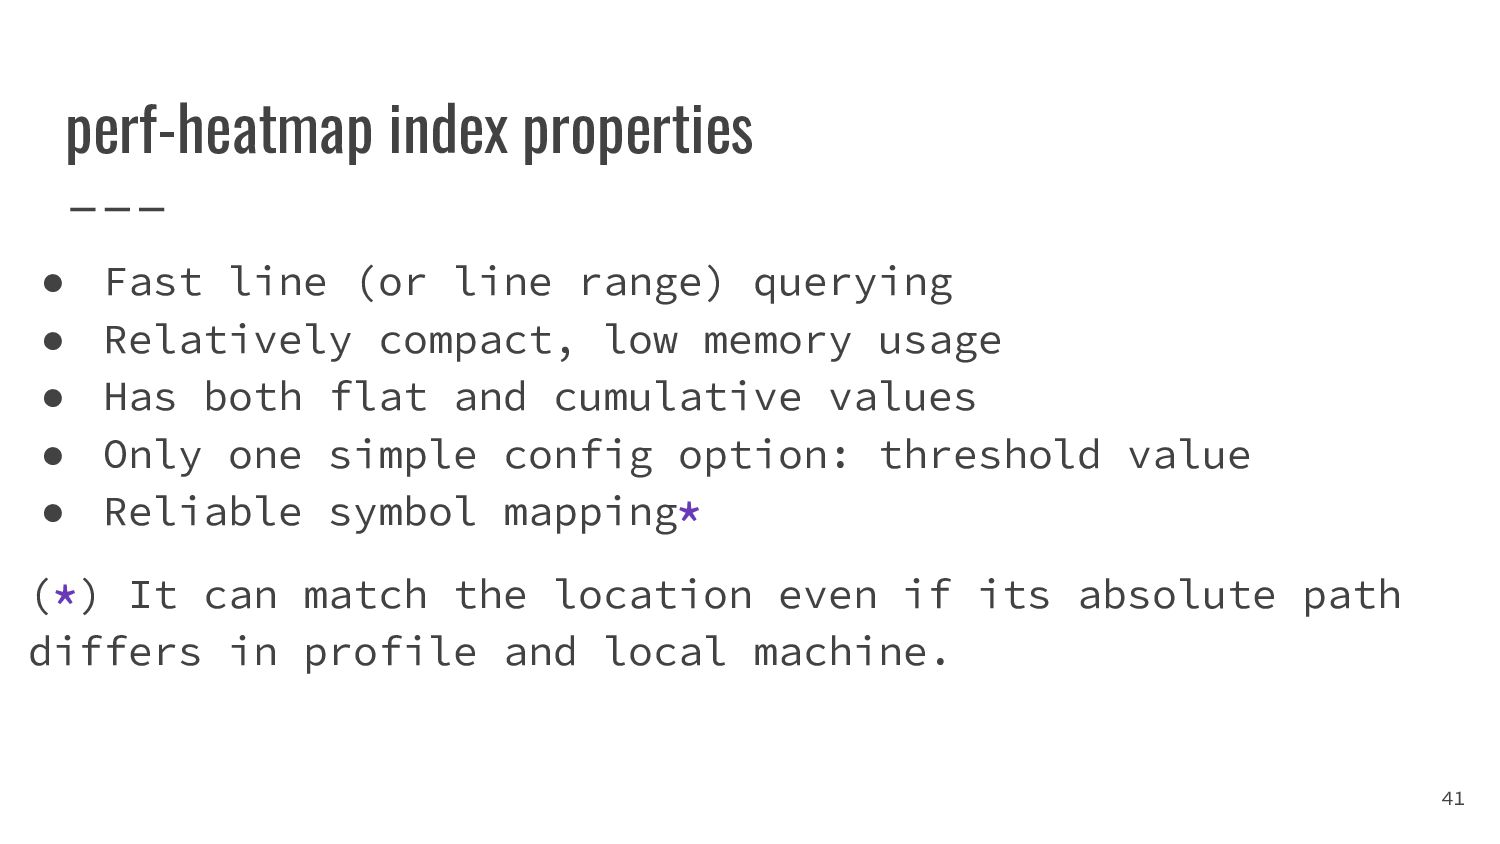
- как раскрасить горячие строки кода в редакторе

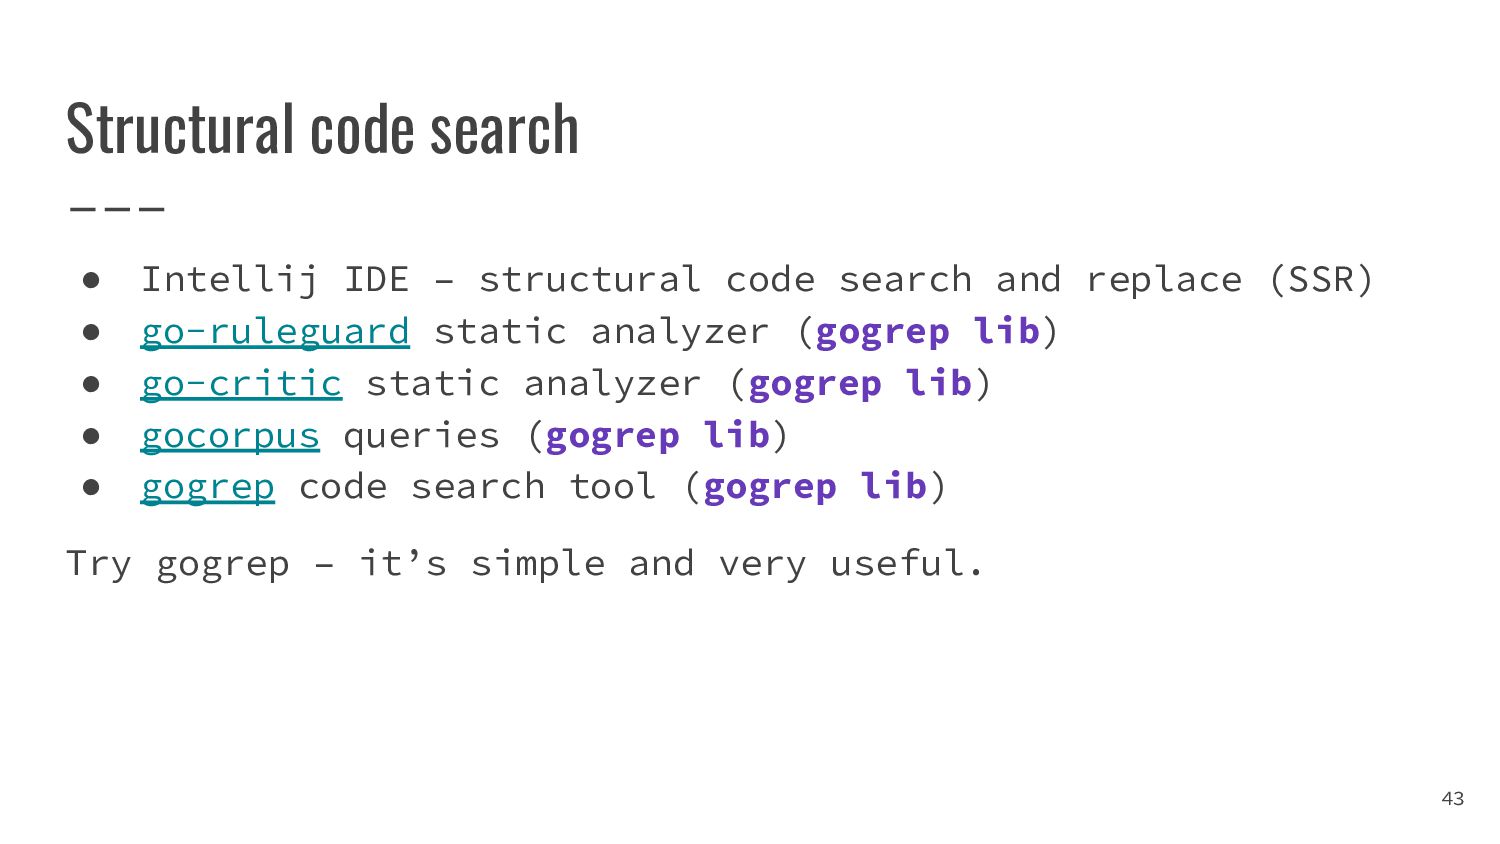
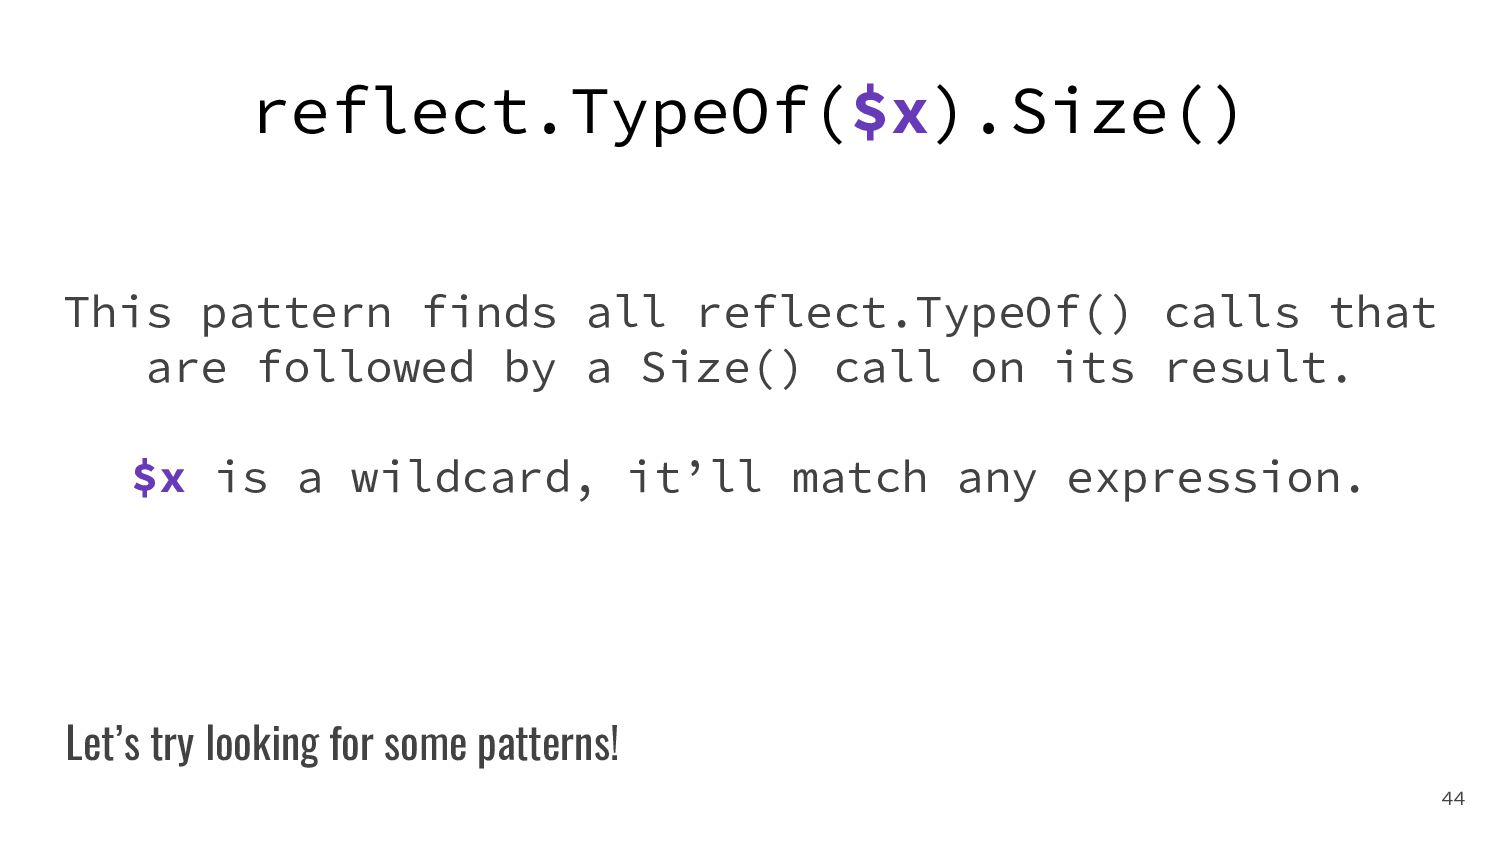
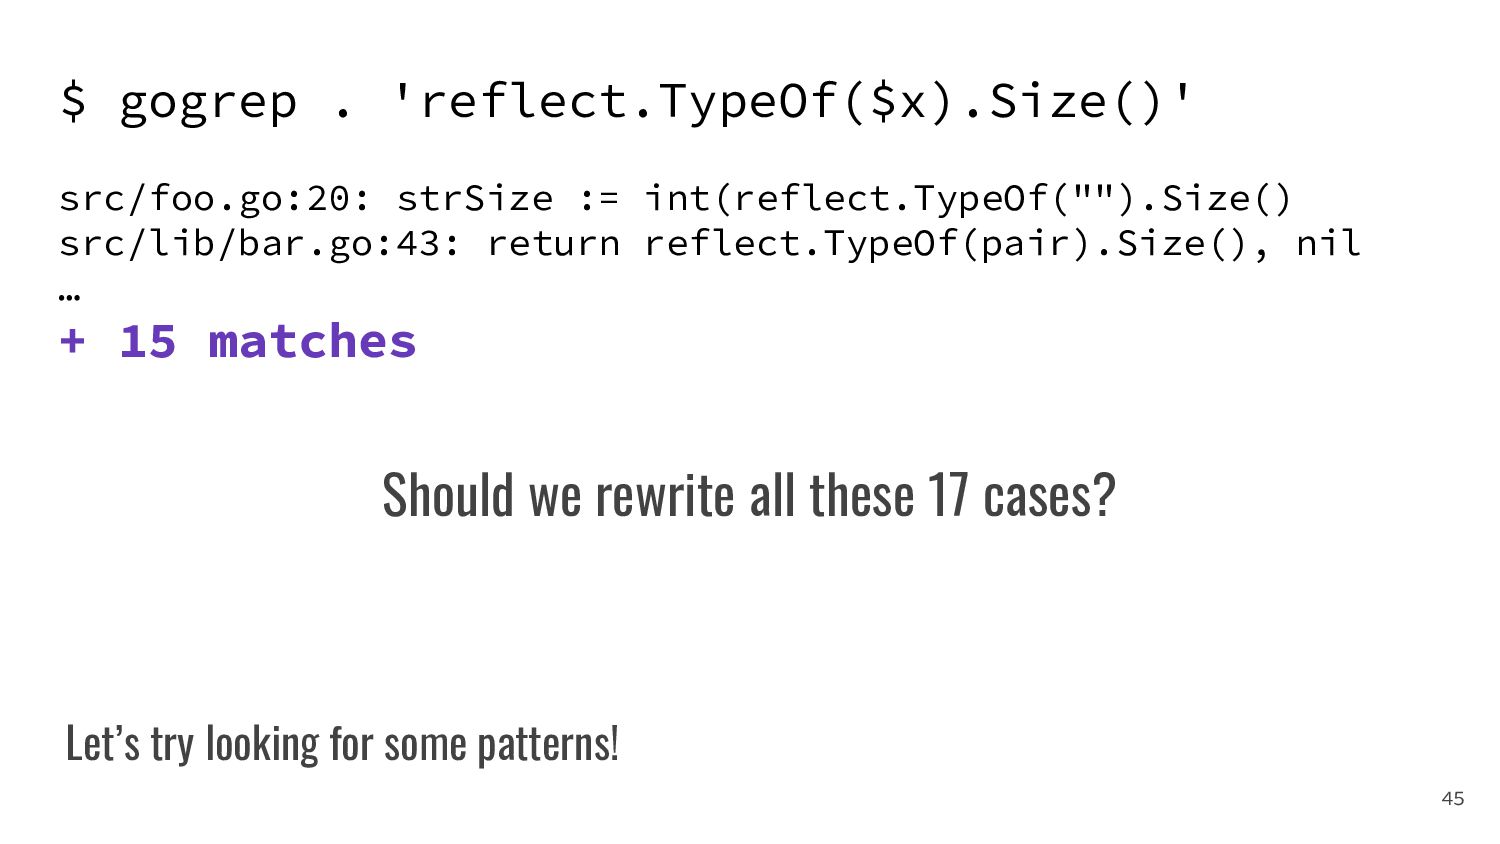
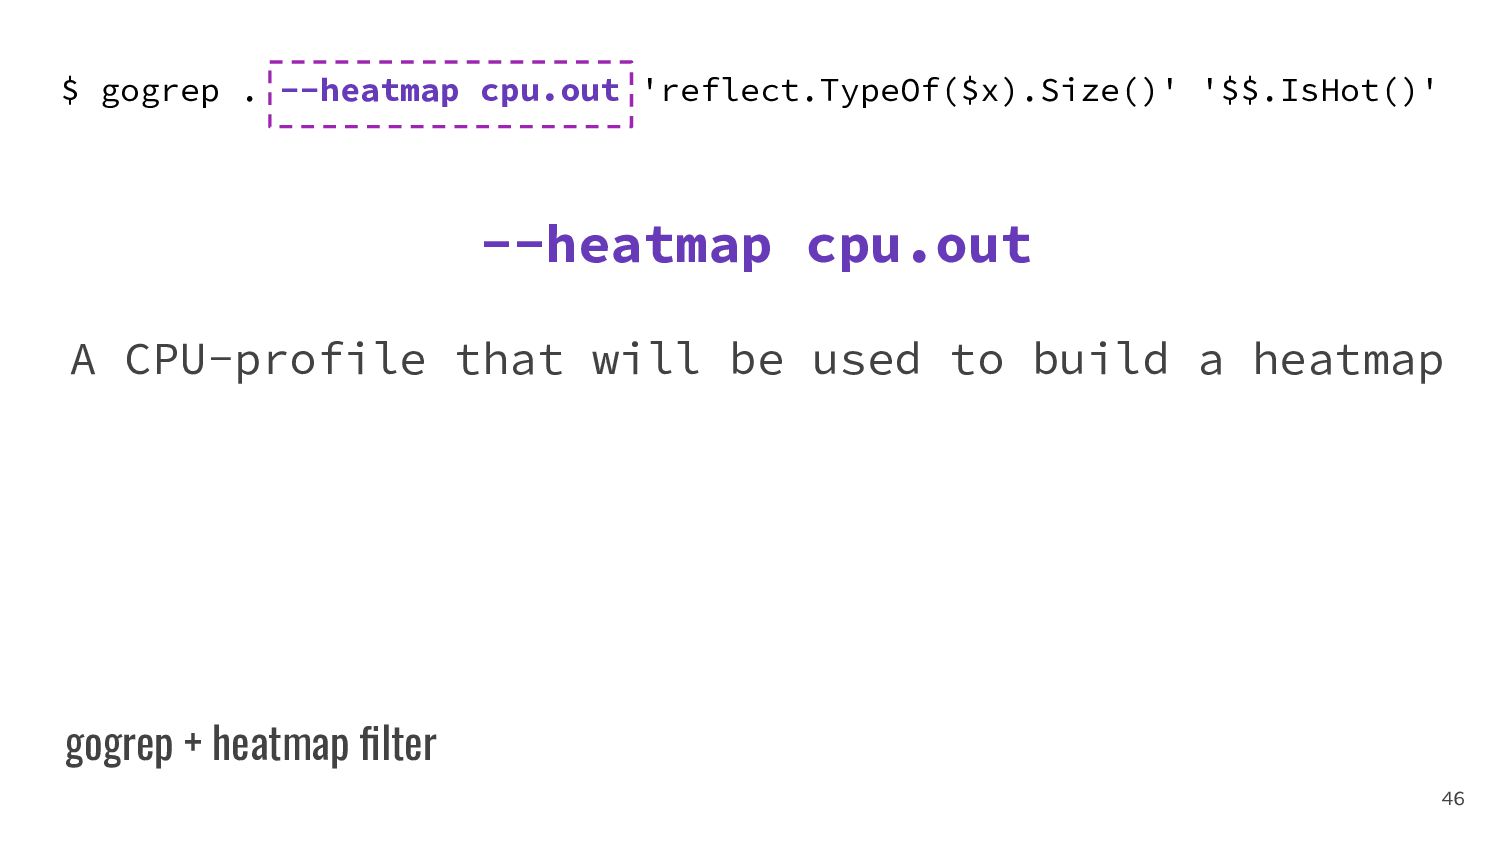
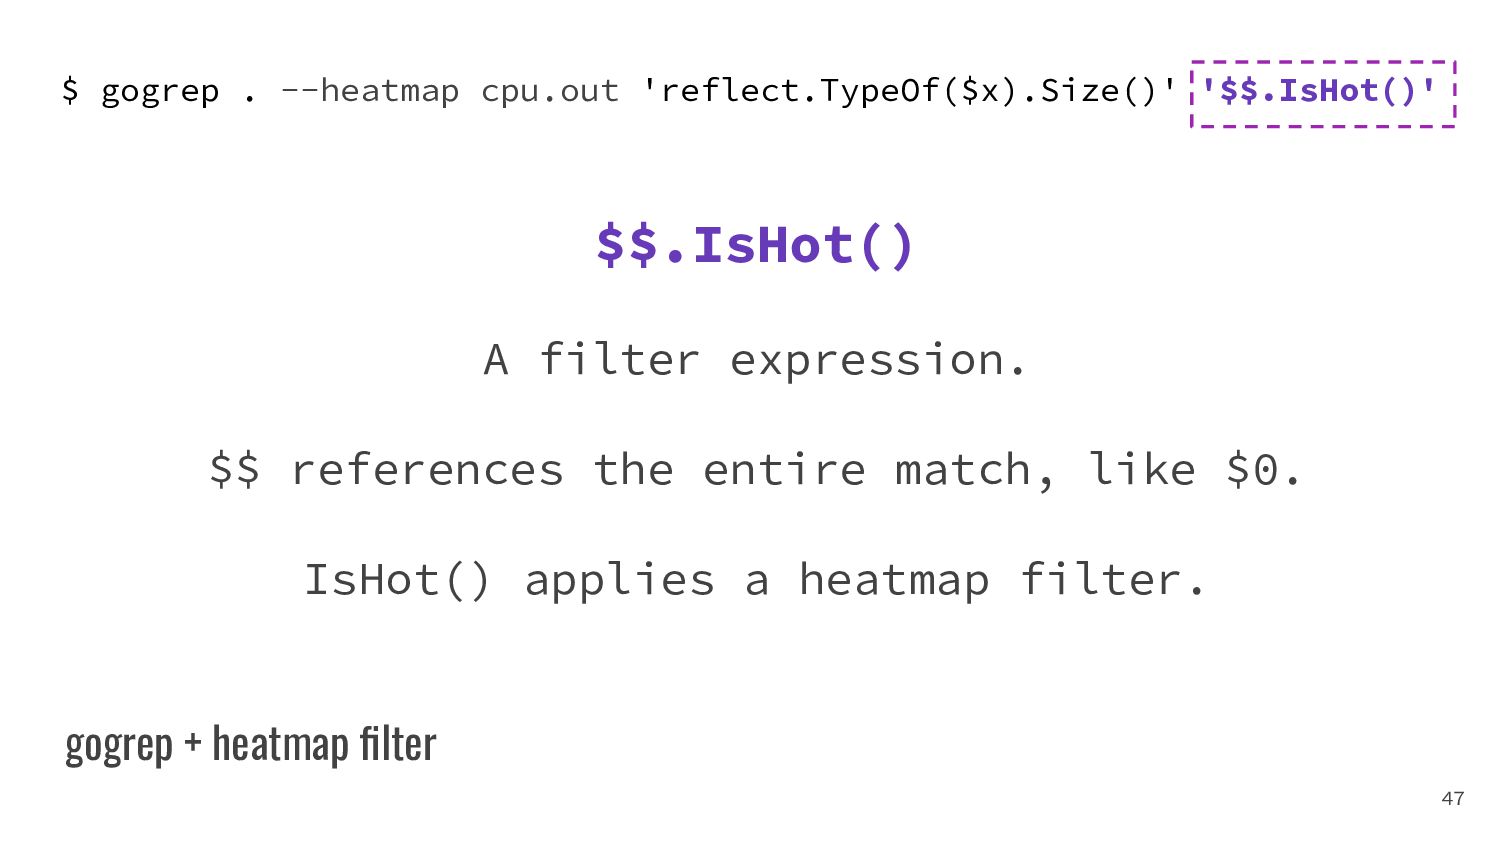
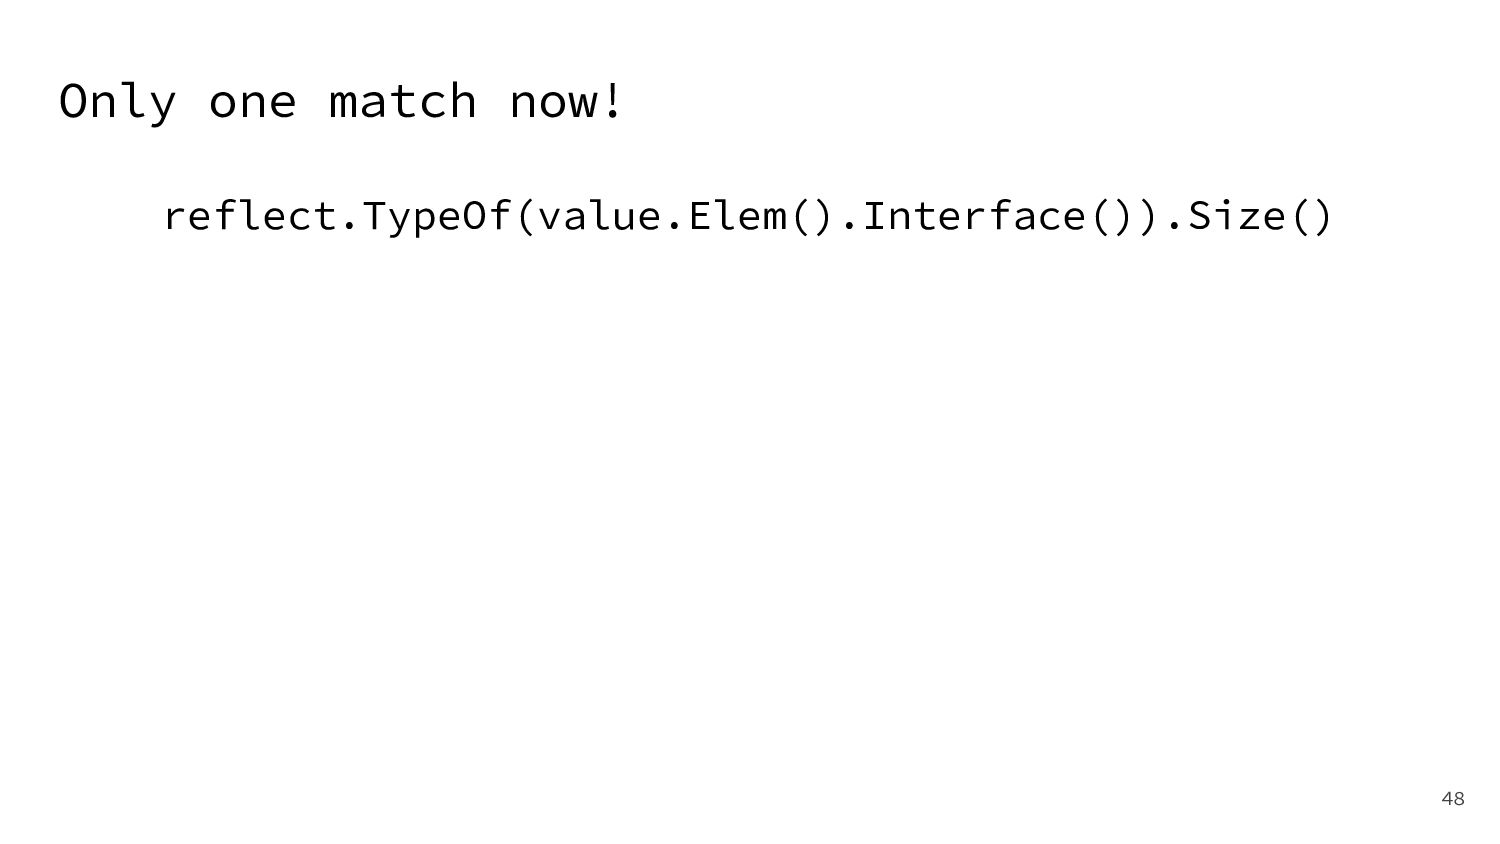
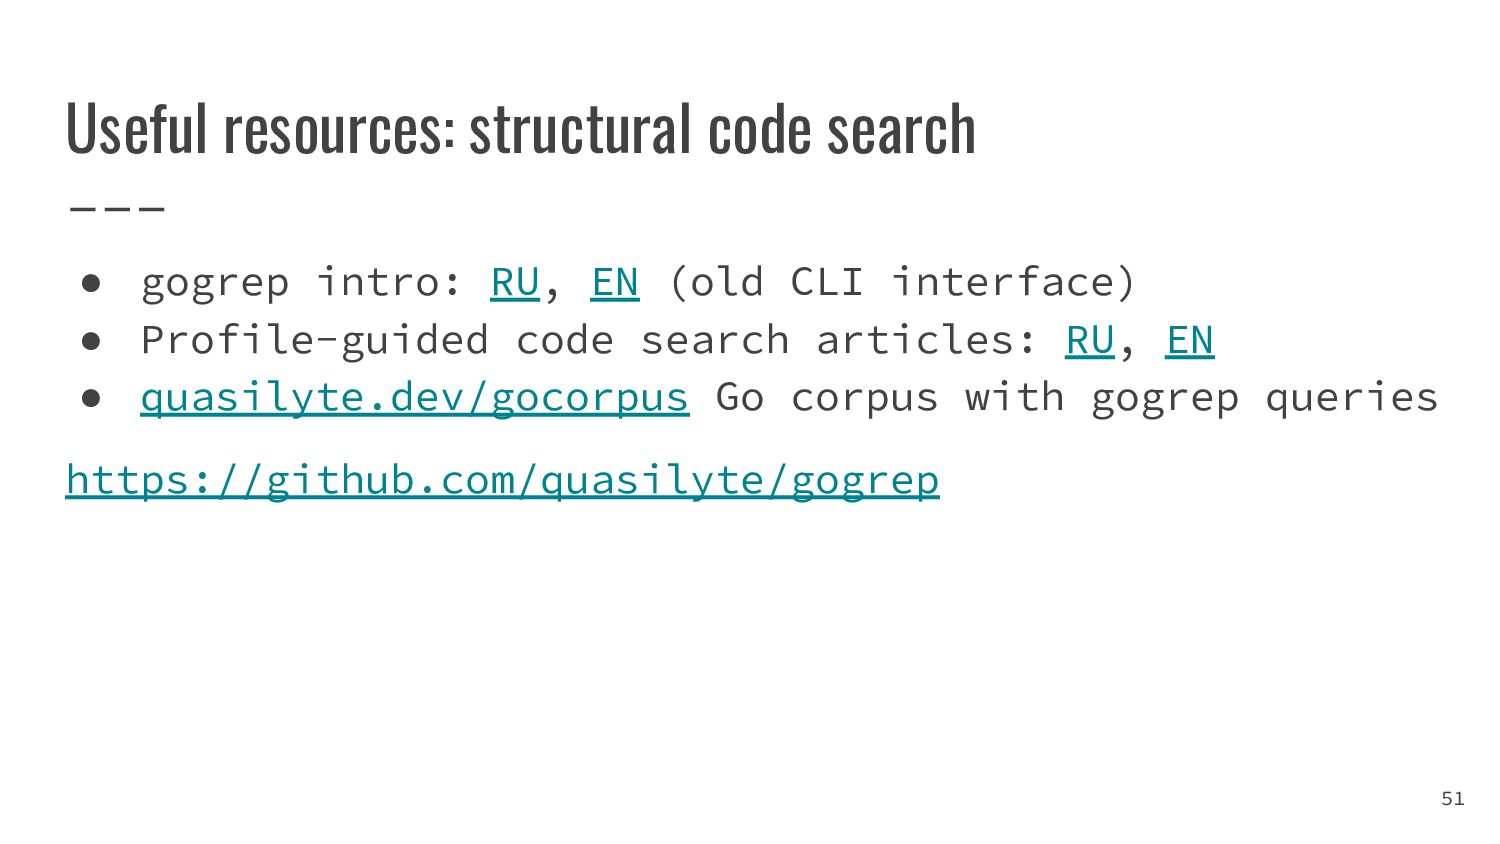
- что такое структурный поиск кода по горячим местам

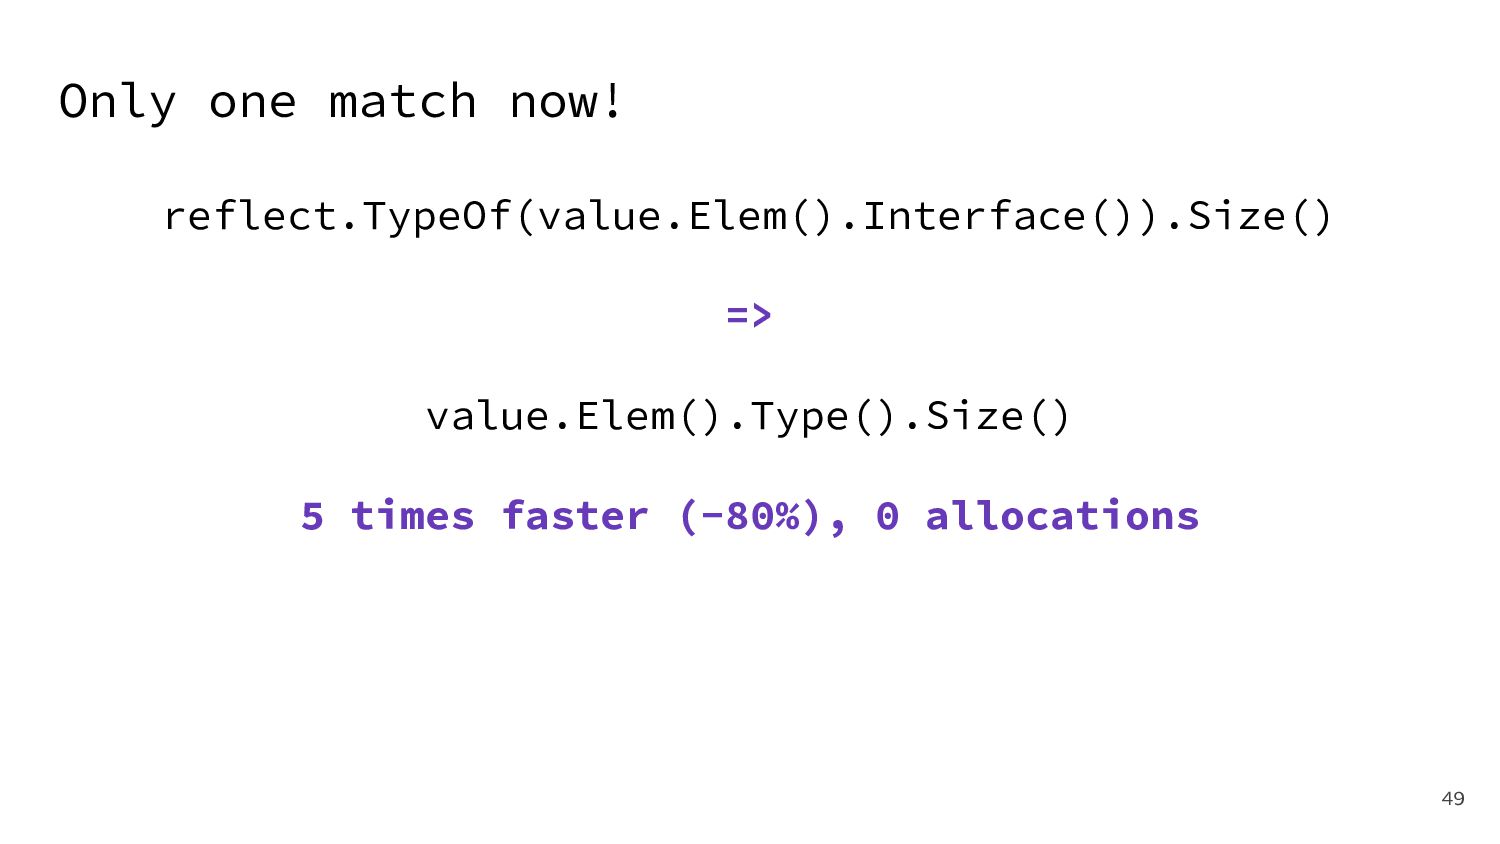
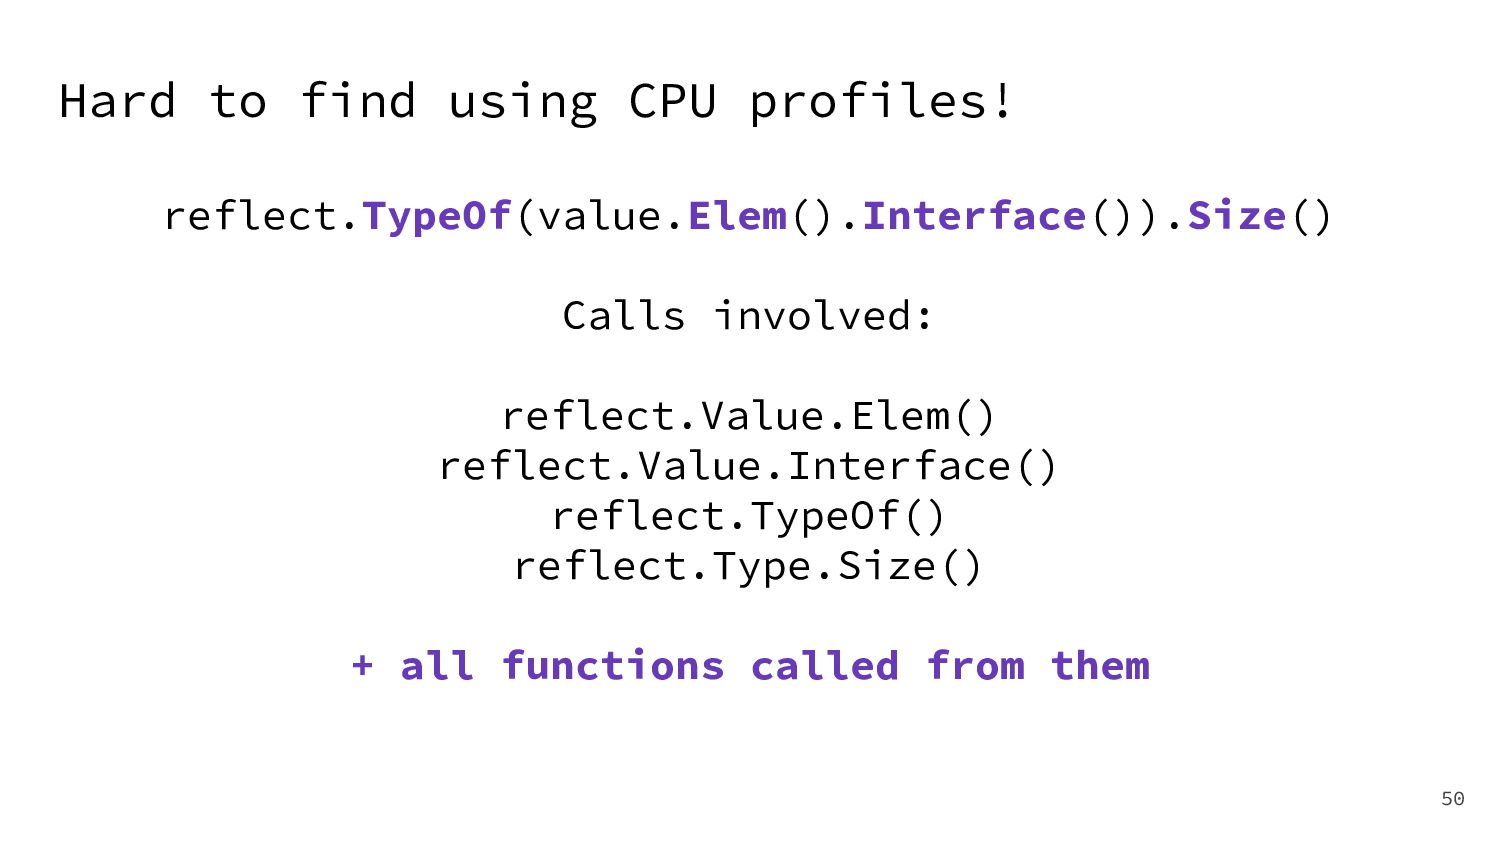
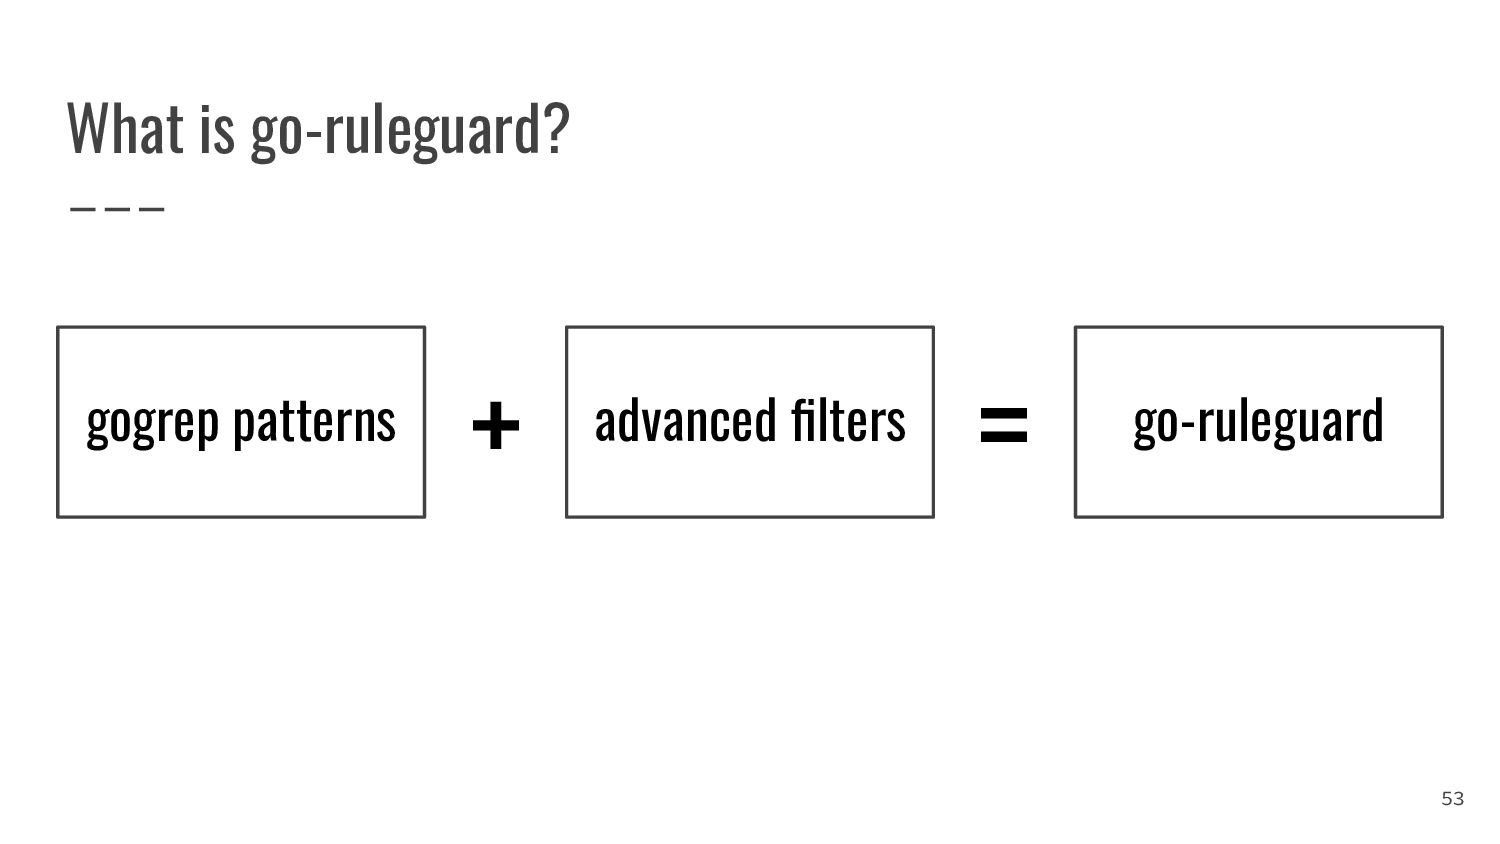
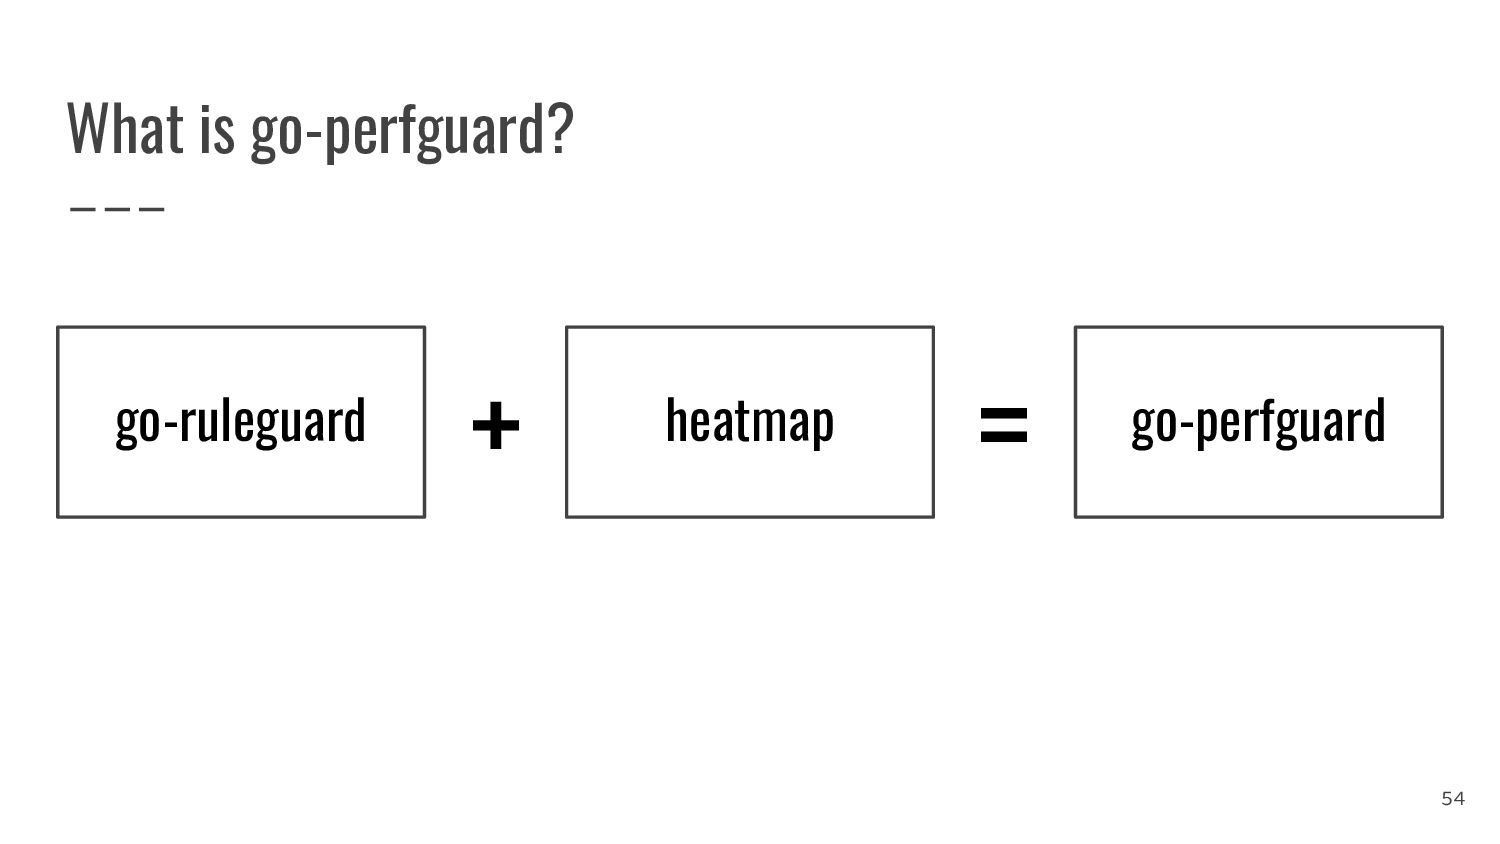
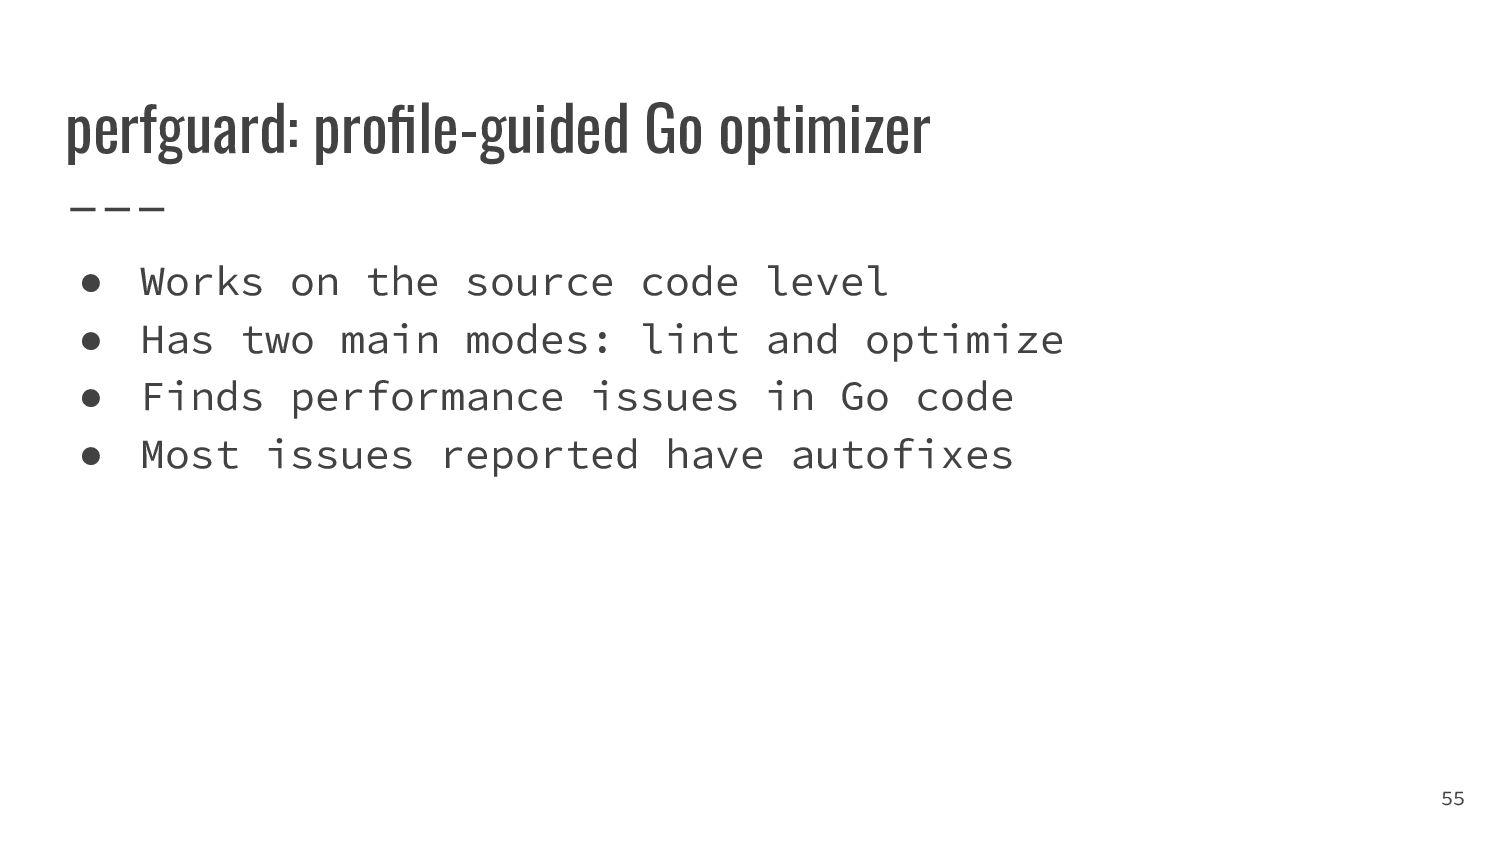
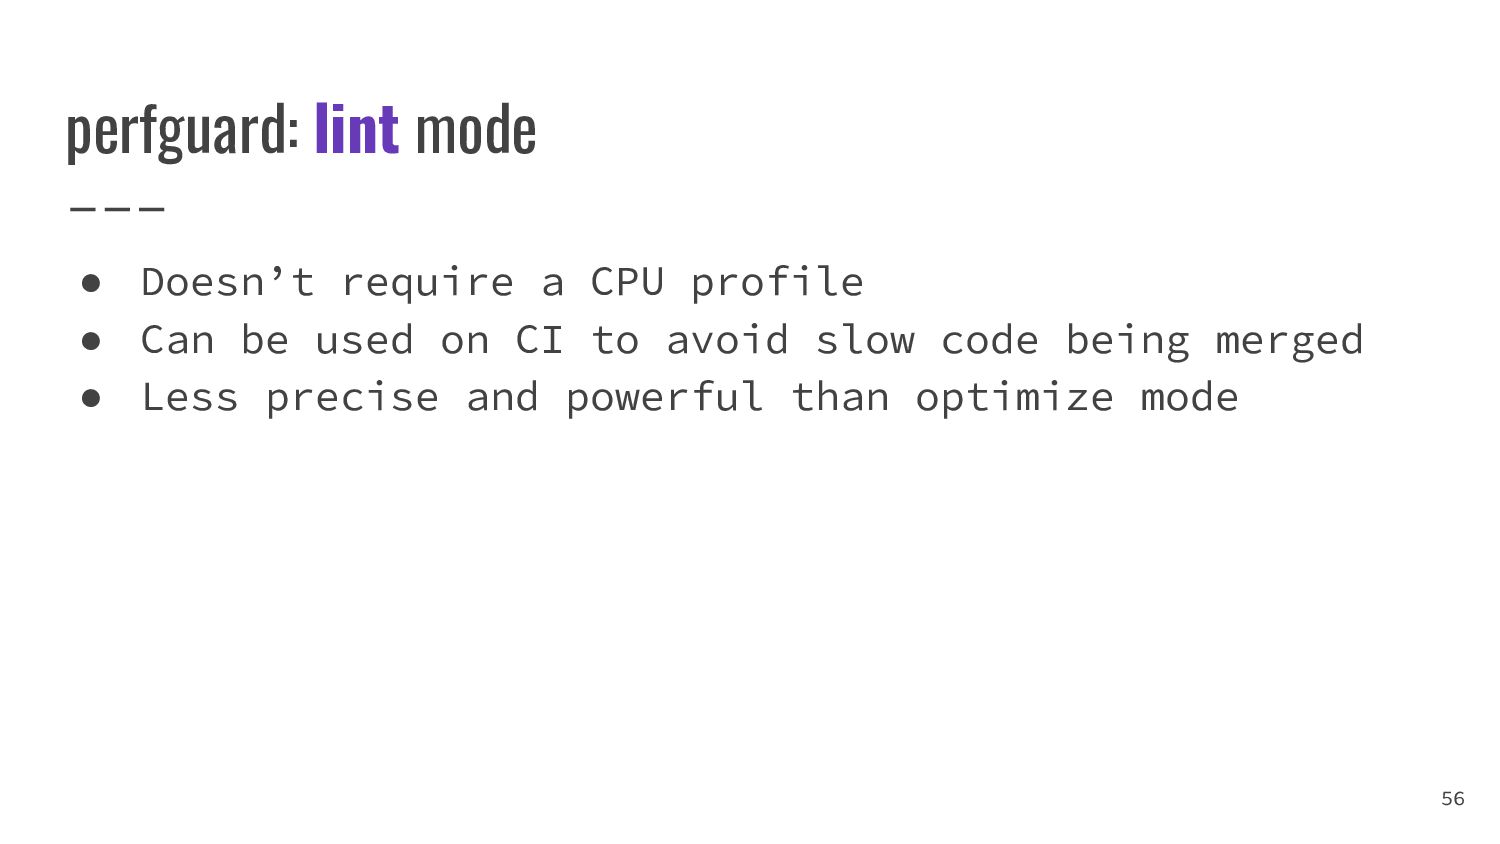
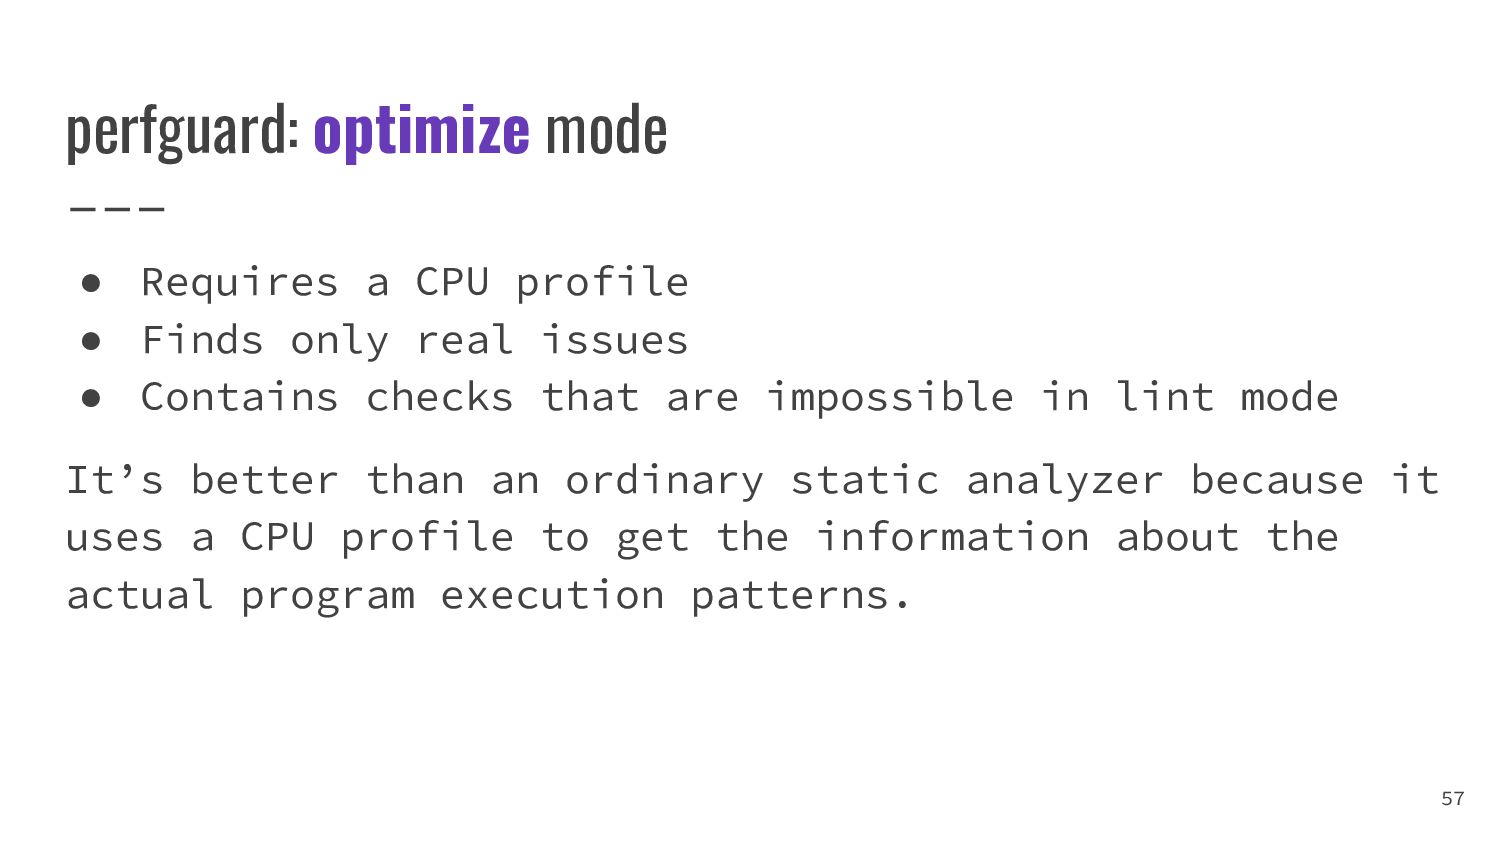
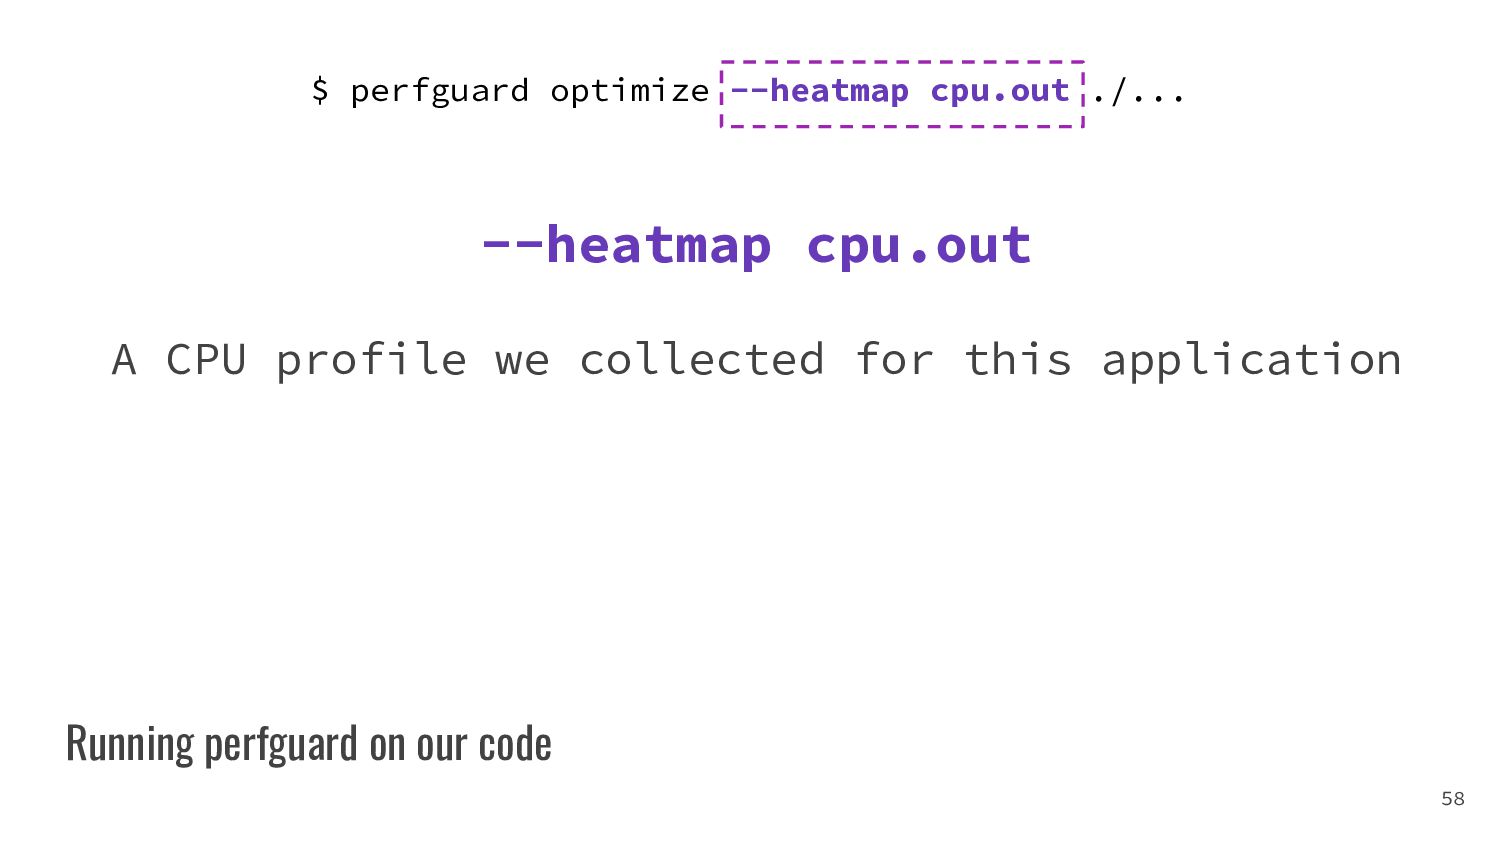
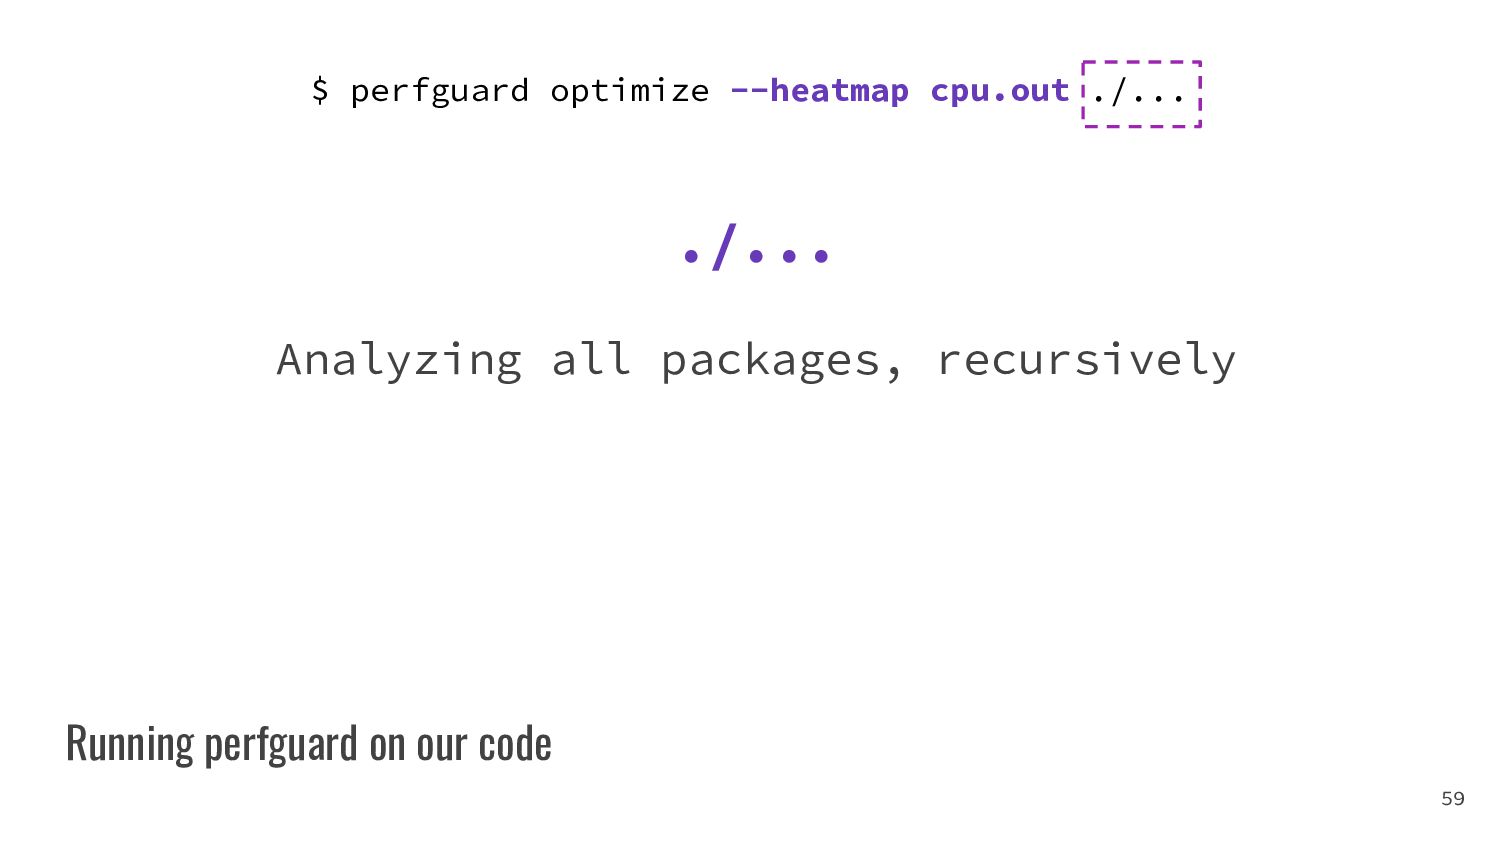
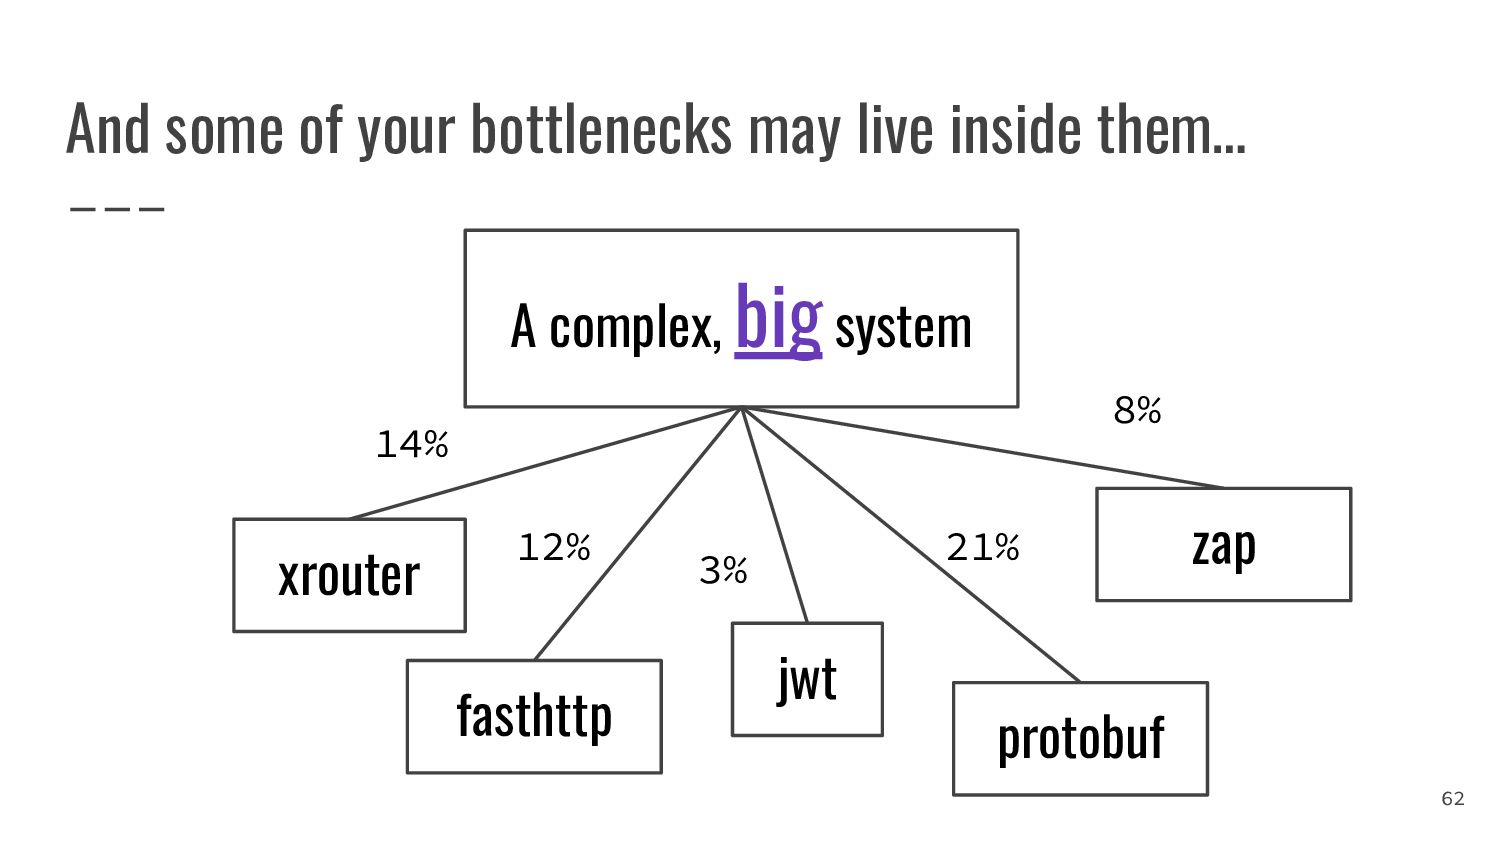
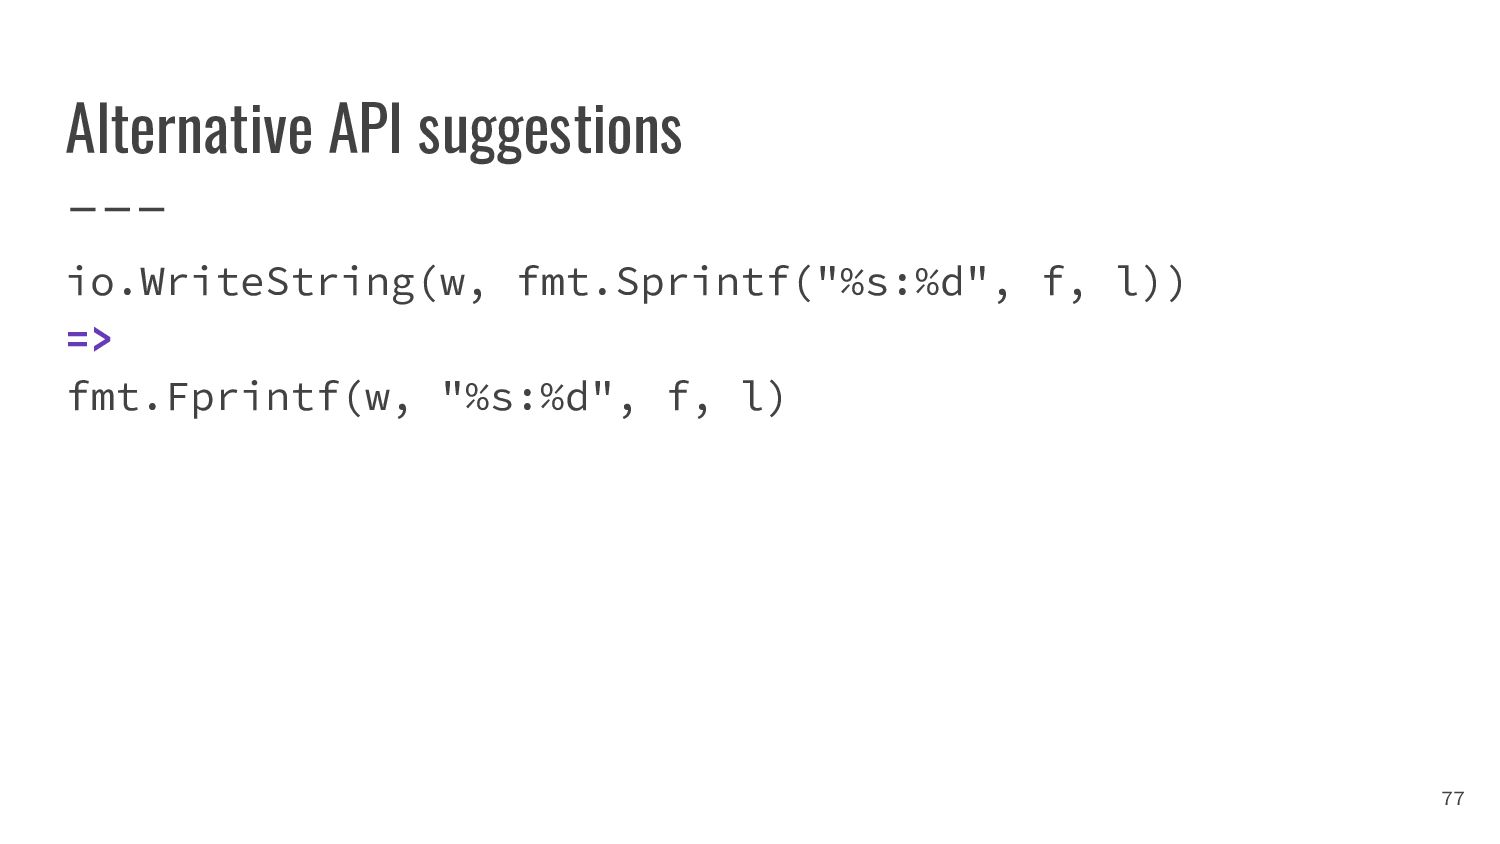
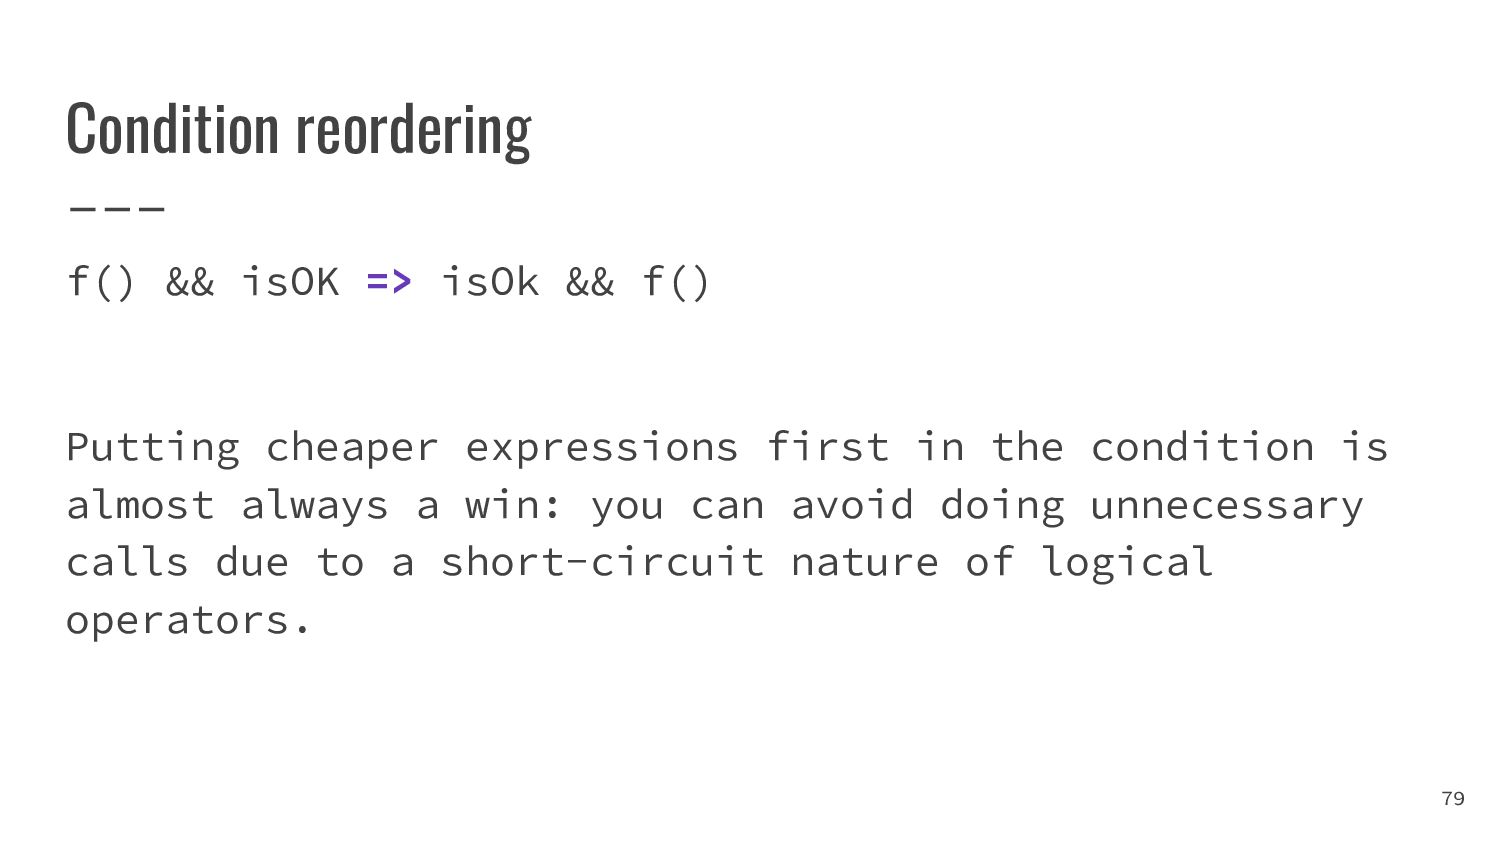
- статический анализ производительности на основе профилей исполнения

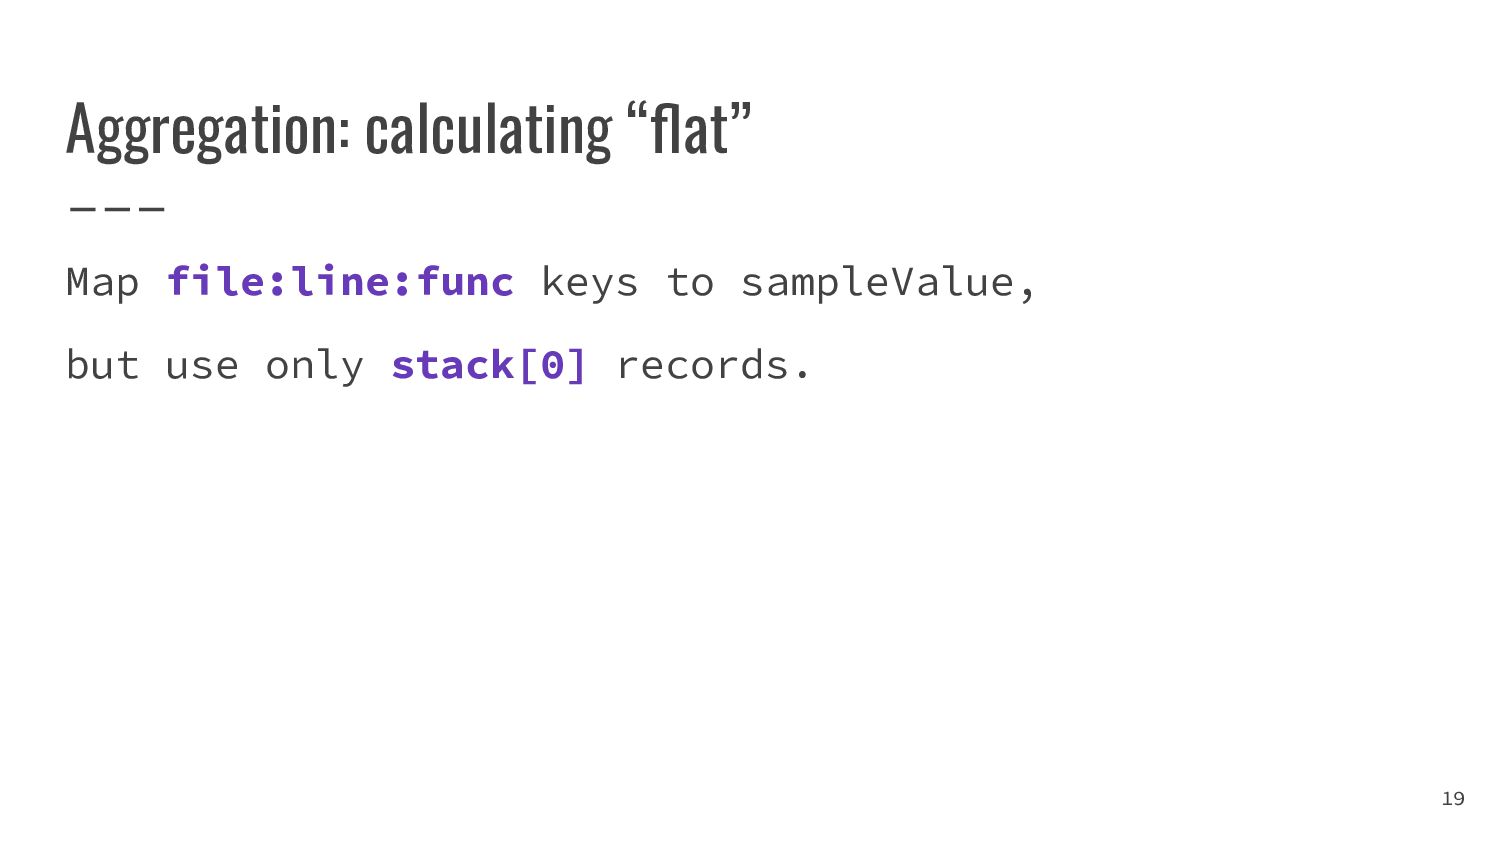
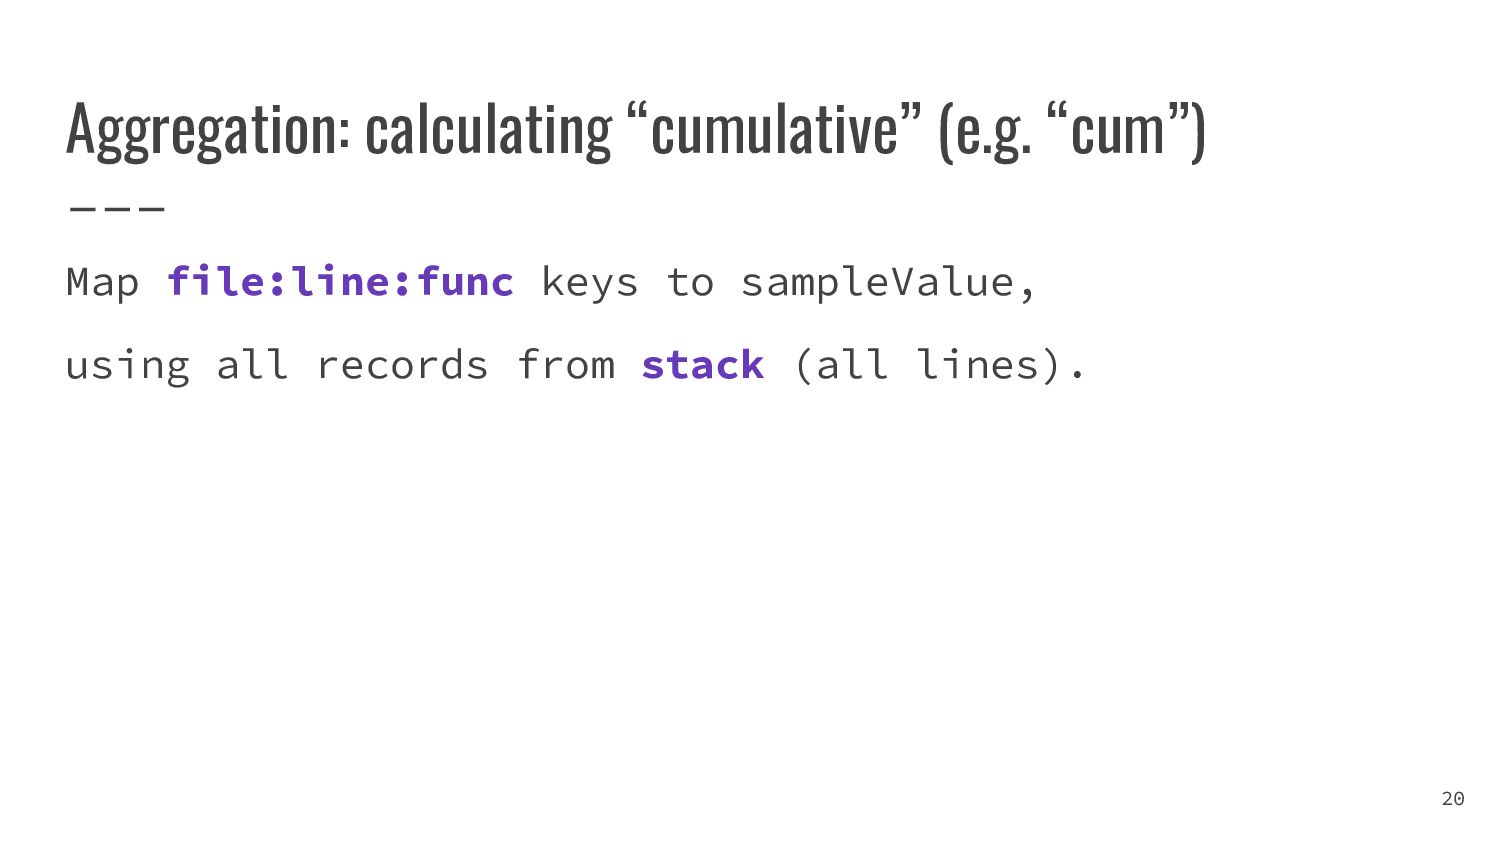
- альтернативные способы агрегации без pprof

Iskander (Alex) Sharipov

February 05, 2022
Tweet

More Decks by Iskander (Alex) Sharipov

Other Decks in Programming

Transcript

  1. Agenda • Some facts about Go CPU profiles and profiling

    • Go profiles parsing • Custom profiles data aggregation • Heatmaps intro and why we need them • Structural code search with heatmap filters • Profile-guided performance static analysis (PGO) • Some pprof insights 2
  2. Why does this talk exists? 3 A complex, big system

    We want to make it faster. But sometimes there are no obvious “bottlenecks”. A system as a whole is slow. There are hundreds of small performance issues.
  3. Let’s state our goal clearly 4 We’re interested in making

    the entire system faster We don’t want to change the code in “cold” paths I don’t care about FooBar benchmark running 100 times faster Our motto is: less code changes => more performance impact
  4. We should not optimize blindly 5 You need to know

    which parts of your program are executed. You also need some extra info, like timings. The CPU profiles provide us this and more.
  5. CPU profiling facts • Interruption-based (SIGPROF on unix) • Sample-based

    (runtime/pprof records 100 samples/sec) • Writes the output in pprof format (profile.proto) 7
  6. What makes a good CPU profile • Collected for a

    long time (longer than a few seconds!) • Collected under an interesting and realistic load • Aligned with your task* It’s also nice to have several CPU profiles, collected in different configurations. (*) If you’re optimizing a single function, CPU profiles from benchmarks are OK. Otherwise they’re not a good fit. 8
  7. Why CPU profiles from benchmarks are bad? They can make

    irrelevant code look “hot”. They do not show the entire system execution patterns. Merging CPU profiles from all benchmarks doesn’t help. They’re not aligned with our goals. 9
  8. Parsing profile.proto files The pprof/profile Go library allows you to

    parse CPU profiles produced by Go. github.com/google/pprof/profile 11
  9. Visiting profile samples: a straightforward approach 13 for _, sample

    := range p.Samples { for _, loc := range sample.Location { for _, l := range loc.Line { sampleValue := sample.Value[1] // time/ns funcName := l.Function.Name filename := l.Function.Filename line := l.Line println(filename, line, funcName, sampleValue) } } }
  10. Visiting profile samples: a smarter approach 14 var stack []profile.Line

    for _, sample := range p.Samples { stack = stack[:0] // reuse memory for every stack for _, loc := range sample.Location { stack = append(stack, loc.Line...) } for i, l := range stack { // handle l } }
  11. Visiting profile samples: a smarter approach 15 var stack []profile.Line

    for _, sample := range p.Samples { stack = stack[:0] for _, loc := range sample.Location { stack = append(stack, loc.Line...) } } stack[0] “self” sample, current function
  12. Visiting profile samples: a smarter approach 16 var stack []profile.Line

    for _, sample := range p.Samples { stack = stack[:0] for _, loc := range sample.Location { stack = append(stack, loc.Line...) } } stack[1:] Callers stack
  13. Function.Name parsing 17 * somefunc * runtime.mallocgc * github.com/foo/pkg.Bar *

    github.com/foo/pkg.Bar.func1 * github.com/foo/pkg.(*Bar).Method
  14. Function.Name parsing 18 * somefunc * runtime.mallocgc * github.com/foo/pkg.Bar *

    github.com/foo/pkg.Bar.func1 * github.com/foo/pkg.(*Bar).Method Some symbols are ambiguous! * Could be a Bar method named “func1” * Could be a lambda “func1” inside “Bar” function Use https://github.com/quasilyte/pprofutil
  15. Does this look familiar to you? (pprof) top 5 9.80%

    runtime.findObject 8.40% runtime.scanobject 3.47% runtime.mallocgc 3.42% runtime.heapBitsSetType 2.87% runtime.markBits.isMarked 22
  16. So, the Go runtime is slow? All top nodes are

    showing that most of the time is spent in the runtime. Does this mean that our app itself is fast, but Go runtime is a bottleneck? 23
  17. copyBytes definition 24 func copyBytes(b []byte) []byte { dst :=

    make([]byte, len(b)) copy(dst, b) return dst }
  18. Benchmarking copyBytes 25 func BenchmarkCopyBytes(b *testing.B) { dst := make([]byte,

    2022) for i := 0; i < b.N; i++ { copyBytes(dst) } } go test -bench=. -cpuprofile=cpu.out
  19. Where is copyBytes? (pprof) top 5 37.56% runtime.mallocgc 12.16% runtime.memclrNoHeapPointers

    9.35% runtime.memmove 8.47% runtime.scanobject 6.42% runtime.scanblock 26
  20. User-code example 27 func copyBytes(b []byte) []byte { dst :=

    make([]byte, len(b)) copy(dst, b) return dst } • mallocgc (allocating a slice) • memclrNoHeapPointers (memory zeroing) • memmove (copying memory)
  21. Aggregation: runtime-cumulative aggregation Map file:line:func keys to sampleValue, like in

    a normal flat or cumulative schemes, but for every runtime stack[0] add this value to a first non-runtime caller. 28
  22. So, the Go runtime is slow? All top nodes are

    showing that most of the time is spent in the runtime. Does this mean that our app itself is fast, but Go runtime is a bottleneck? No, we just need to aggregate the CPU data correctly. 30
  23. Idea: display how “hot” the source code line is It

    would be great to see the performance-sensitive parts of our code right in our text editor. We’ll use heat levels to categories the hotness. 32
  24. Heatmaps: building a line-oriented index from a CPU profile We

    can build a simple index that aggregates all samples from the CPU profile and splits them into categories (heat levels). Then we can tell what is the heat level of the given source code line. 33
  25. Building a heatmap 34 file.go:100 0.1s file.go:100 0.3s file.go:120 0.1s

    file.go:120 0.1s file.go:100 0.4s file.go:130 0.2s file.go:140 0.1s file.go:145 0.1s file.go:150 0.3s file.go:165 0.2s file.go:170 0.2s Take all samples for a file
  26. Building a heatmap 35 file.go:100 0.8s file.go:120 0.2s file.go:130 0.2s

    file.go:140 0.1s file.go:145 0.1s file.go:150 0.3s file.go:165 0.2s file.go:170 0.2s Combine sample values for the same lines
  27. Building a heatmap 36 file.go:100 0.8s file.go:150 0.3s file.go:120 0.2s

    file.go:130 0.2s file.go:165 0.2s file.go:170 0.2s file.go:140 0.1s file.go:145 0.1s Sort samples by their value
  28. Building a heatmap 37 file.go:100 0.8s | L=5 file.go:150 0.3s

    | L=5 file.go:120 0.2s | L=4 file.go:130 0.2s | L=3 file.go:165 0.2s | L=3 file.go:170 0.2s | L=2 file.go:140 0.1s | L=1 file.go:145 0.1s | L=1 Divide them into categories (heat levels)
  29. Building a heatmap 38 file.go:100 0.8s | L=5 file.go:150 0.3s

    | L=4 file.go:120 0.2s | L=3 file.go:130 0.2s | L=2 file.go:165 0.2s | L=0 file.go:170 0.2s | L=0 file.go:140 0.1s | L=0 file.go:145 0.1s | L=0 A threshold can control the % of samples we’re using (top%) Let’s use threshold=0.5
  30. perf-heatmap library I created a library that can be used

    to build a heatmap index from profile.proto CPU profiles. It’s used in all profile-guided tools presented today. https://github.com/quasilyte/perf-heatmap 40
  31. perf-heatmap index properties • Fast line (or line range) querying

    • Relatively compact, low memory usage • Has both flat and cumulative values • Only one simple config option: threshold value • Reliable symbol mapping* (*) It can match the location even if its absolute path differs in profile and local machine. 41
  32. Structural code search • Intellij IDE – structural code search

    and replace (SSR) • go-ruleguard static analyzer (gogrep lib) • go-critic static analyzer (gogrep lib) • gocorpus queries (gogrep lib) • gogrep code search tool (gogrep lib) Try gogrep – it’s simple and very useful. 43
  33. Let’s try looking for some patterns! 44 reflect.TypeOf($x).Size() This pattern

    finds all reflect.TypeOf() calls that are followed by a Size() call on its result. $x is a wildcard, it’ll match any expression.
  34. Let’s try looking for some patterns! 45 $ gogrep .

    'reflect.TypeOf($x).Size()' src/foo.go:20: strSize := int(reflect.TypeOf("").Size() src/lib/bar.go:43: return reflect.TypeOf(pair).Size(), nil … + 15 matches Should we rewrite all these 17 cases?
  35. gogrep + heatmap filter 46 $ gogrep . --heatmap cpu.out

    'reflect.TypeOf($x).Size()' '$$.IsHot()' --heatmap cpu.out A CPU-profile that will be used to build a heatmap
  36. gogrep + heatmap filter 47 $ gogrep . --heatmap cpu.out

    'reflect.TypeOf($x).Size()' '$$.IsHot()' $$.IsHot() A filter expression. $$ references the entire match, like $0. IsHot() applies a heatmap filter.
  37. 50 Hard to find using CPU profiles! reflect.TypeOf(value.Elem().Interface()).Size() Calls involved:

    reflect.Value.Elem() reflect.Value.Interface() reflect.TypeOf() reflect.Type.Size() + all functions called from them
  38. Useful resources: structural code search • gogrep intro: RU, EN

    (old CLI interface) • Profile-guided code search articles: RU, EN • quasilyte.dev/gocorpus Go corpus with gogrep queries https://github.com/quasilyte/gogrep 51
  39. perfguard: profile-guided Go optimizer • Works on the source code

    level • Has two main modes: lint and optimize • Finds performance issues in Go code • Most issues reported have autofixes 55
  40. perfguard: lint mode • Doesn’t require a CPU profile •

    Can be used on CI to avoid slow code being merged • Less precise and powerful than optimize mode 56
  41. perfguard: optimize mode • Requires a CPU profile • Finds

    only real issues • Contains checks that are impossible in lint mode It’s better than an ordinary static analyzer because it uses a CPU profile to get the information about the actual program execution patterns. 57
  42. Running perfguard on our code 58 $ perfguard optimize --heatmap

    cpu.out ./... --heatmap cpu.out A CPU profile we collected for this application
  43. Running perfguard on our code 59 $ perfguard optimize --heatmap

    cpu.out ./... ./... Analyzing all packages, recursively
  44. Analyzing the results If you get some output, be sure

    to try out the --fix option to autofix the issues found. It’s possible to go deeper and analyze the dependencies. 60
  45. Usually, your code has some dependencies… 61 A complex, big

    system xrouter fasthttp jwt protobuf zap
  46. And some of your bottlenecks may live inside them… 62

    A complex, big system xrouter fasthttp jwt protobuf zap 14% 12% 3% 21% 8%
  47. Some of them are 3rd party -> hard to fix

    63 A complex, big system fasthttp jwt protobuf zap 12% 3% 21% 8%
  48. But some of them can be under your control 64

    A complex, big system xrouter 14%
  49. Let’s grab the dependencies for the analysis Execute this: $

    go mod vendor Now we should have a “vendor” folder that contains the sources of all our dependencies. You can undo this after we finish with analysis. 65
  50. Running perfguard on dependencies 66 $ perfguard optimize --heatmap cpu.out

    ./vendor/... --heatmap cpu.out The same CPU profile we collected and used on our own source code
  51. Running perfguard on dependencies 67 $ perfguard optimize --heatmap cpu.out

    ./vendor/... ./vendor/... Running the analysis on our dependencies
  52. Analyzing the results vendor/jwt/jwt.go:20: []byte(s)... => s... vendor/b/b.go:15: bytes.Buffer =>

    strings.Builder vendor/xrouter/xrouter.go: compiling regexp on hot path vendor/c/c.go:50: allocating const error, use global var 68
  53. Analyzing the results vendor/jwt/jwt.go:20: []byte(s)... => s... vendor/b/b.go:15: bytes.Buffer =>

    strings.Builder vendor/xrouter/xrouter.go: compiling regexp on hot path vendor/c/c.go:50: allocating const error, use global var 69
  54. Running perfguard on xrouter 71 $ perfguard optimize --heatmap cpu.out

    ./... --heatmap cpu.out The very same CPU profile again
  55. Running perfguard on xrouter 72 $ perfguard optimize --heatmap cpu.out

    ./... ./... Note: running on the xrouter “own” sources
  56. xrouter results vendor/xrouter/xrouter.go: compiling regexp on hot path Only relevant

    results. Can also use --fix option to apply autofixes. 73
  57. Why bother with “go mod vendor”? Maybe it’s possible for

    perfguard to figure out where to find the relevant sources in the Go mod pkg dir, but vendoring the sources is easier for now. This could change in the future, but for now you’ll need to make the dependencies code easily accessible. 74
  58. Suggesting one types over the others bytes.Buffer => strings.Builder If

    local bytes.Buffer is used using the API also covered with strings.Builder and the final result is constructed with String() method, using strings.Builder will result in 1 less allocation. 76
  59. Removing redundant data copies b = append(b, []byte(s)...) => b

    = append(b, s...) copy(b, []byte(s)) => copy(b, s) re.Match([]byte(s)) => re.MatchString(s) w.Write([]byte(s)) => w.WriteString(s) And many more transformations that remove excessive data conversions. 78
  60. Condition reordering f() && isOK => isOk && f() Putting

    cheaper expressions first in the condition is almost always a win: you can avoid doing unnecessary calls due to a short-circuit nature of logical operators. 79
  61. map[T]bool -> map[T]struct{} When local map[T]bool is used as a

    set, perfguard can automatically rewrite it to map[T]struct{}, updating all relevant code parts that use it. 80
  62. Useful resources: ruleguard & perfguard • ruleguard intro: RU, EN

    • ruleguard by example tour • ruleguard comparison with Semgrep and CodeQL https://github.com/quasilyte/go-perfguard https://github.com/quasilyte/go-ruleguard 81
  63. Final thoughts • Heatmaps do not replace pprof/flamegraphs/etc • Filtering

    results depend on the CPU profile quality • perfguard can’t magically solve all of your problems 82